prometheus使用三(自定义监控指标实现)
prometheus提供了一系列的export帮助采集各种容器和中间件的运行指标,但有时我们还需要更灵活的监控指标,介绍一下自定义监控指标
本文用来监控dubbo的服务提供者的被调用指标,包括调用次数,p99等。
首先引入jar包
<dependency>

<groupId>io.prometheus</groupId>

<artifactId>simpleclient_httpserver</artifactId>

<version>0.6.0</version>
</dependency>

<dependency>

<groupId>io.prometheus</groupId>

<artifactId>simpleclient_pushgateway</artifactId>

<version>0.7.0</version>
</dependency>
写一个util工具类,里面有四大基本统计类型的用法
import io.prometheus.client.Gauge;
import io.prometheus.client.Histogram;
import io.prometheus.client.Summary;
import org.springframework.stereotype.Component;

@Component
public class PrometheusUtil {


static final Gauge gauge = Gauge.build()
.name("requests_count")
.labelNames("getCount") //key

.help("requests_count").register(); //累加的count值


//用法: 代码前加入 gauge.labels("get").inc(); //+1 get,value
// gauge.labels("get").dec(); //-1


Summary receivedBytes = Summary.build()
.name("requests_size_bytes")
.labelNames("summaryBytes")
.help("Request size in bytes.").register(); //http请求的字节数

//用法: 方法后执行 receivedBytes.observe(req.size());


static final Summary summaryTime = Summary.build()
.name("requests_summary_seconds")
.labelNames("summaryTime")
.help("Request latency in seconds.").register(); //请求处理的时间


static final Histogram hisTimer=

Histogram.build()
.name("histogram")
.labelNames("histogram")
.help("request histogram")
.exponentialBuckets(1,1.2,10).register(); //处理p99


//count+

public static void inc(String lable){

gauge.labels(lable).inc();
}


//请求处理时间开始

public static Summary.Timer summaryTimeStart(String lable){
Summary.Timer timer= summaryTime.labels(lable).startTimer();

return timer;
}


//请求处理时间结束

public static void summaryStop(Summary.Timer timer){
timer.observeDuration();
}


//p99开始

public static Histogram.Timer histogramStart(String lable){
Histogram.Timer timer=hisTimer.labels(lable).startTimer();

return timer;
}


//p99结束

public static void histogramStop(Histogram.Timer timer){
timer.observeDuration();
}

}


然后在dubbo服务提供者启动类里开个端口,用来让prometheus访问

public class Provider {

public static void main(String[] args) throws Exception {
ClassPathXmlApplicationContext context = new ClassPathXmlApplicationContext("/provider.xml");

//模拟调用dubbo service,方便调试,实际使用中不需要

DemoServiceImpl service = context.getBean(DemoServiceImpl.class);

for (int i=0;i<5;i++){
String sayHello = service.sayHello("prometheus");
System.out.println(sayHello);
}

HTTPServer server=new HTTPServer(8080);

context.start();
System.in.read();
}
}
service层如下
@Component

public class DemoServiceImpl implements Service{

@Override
public String sayHello(String name) throws InterruptedException, IOException {
PrometheusUtil.inc("sayHello");

Histogram.Timer timer = PrometheusUtil.histogramStart("sayHello");
Summary.Timer timer1 = PrometheusUtil.summaryTimeStart("sayHello");

  try{
    Random random = new Random(1);
    Thread.sleep(500 + random.nextInt(3000));
   }catch (Exception e){
    System.out.println(e.getMessage());
   }finally {
   PrometheusUtil.histogramStop(timer);
PrometheusUtil.summaryStop(timer1);
}

return "Hello " + name;
}

}
然后在prometheus的prometheus.yml上配置一个job,参数prometheus二中方法配置即可。
然后启动dubbo,再看prometheus的targets有没有监控到
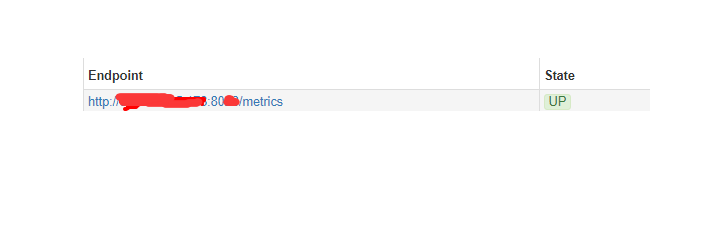
已是up状态,有监控到,点击打开查看指标
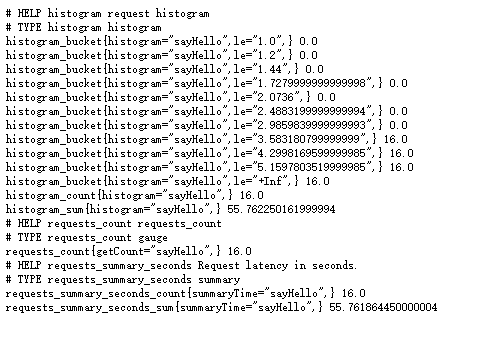
跟预期一样,有指标,然后展示在grafana
自定义一个仪表盘,新建一个panel
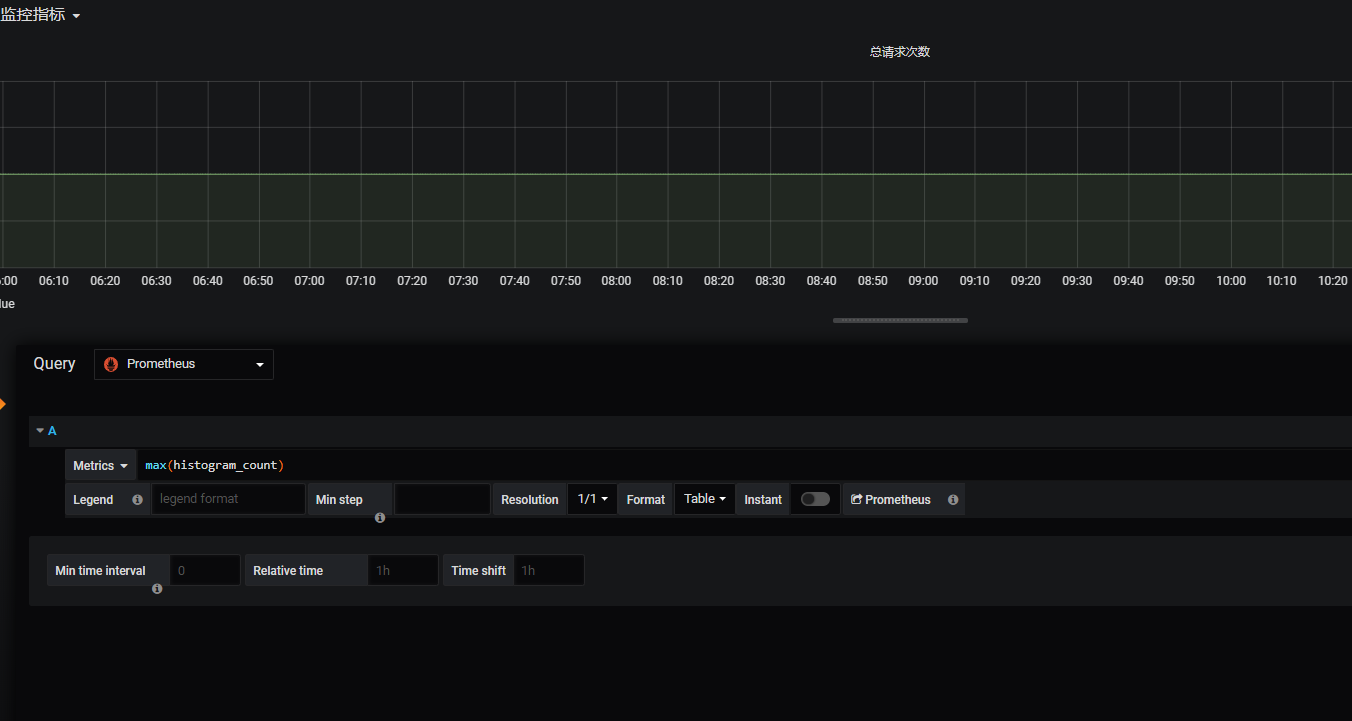
写好表达式即可展示。同理写出其它几个指标,主要表达式为
平均响应时间 rate(histogram_sum[5m])/rate(histogram_count[5m])
平均qps increase(histogram_count[5m])/300
p90或p99 histogram_quantile(0.9, sum(rate(histogram_bucket[5m])) by (le)) 等等
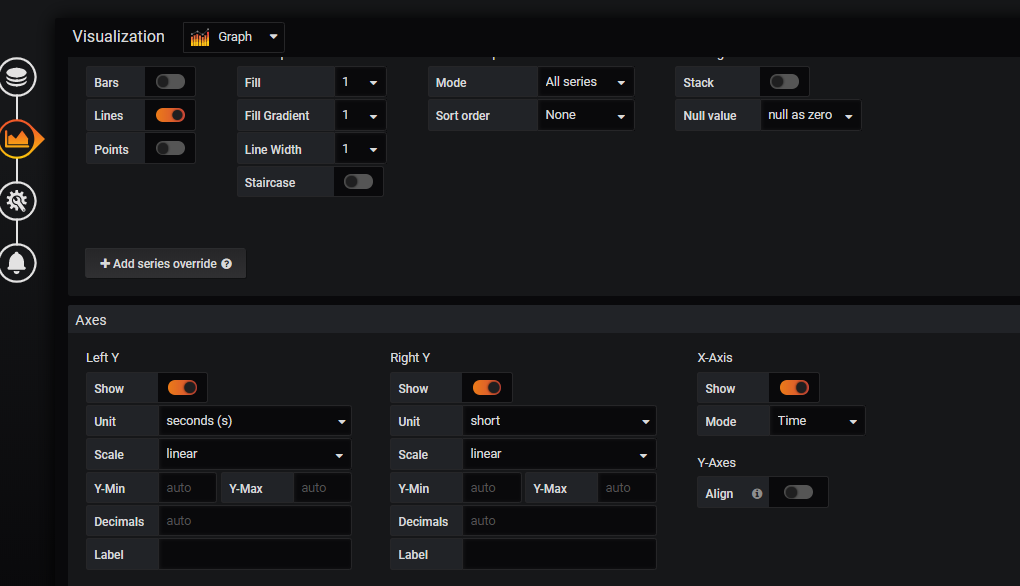
或微调这些项得到最理想的展示
还有其它很多用法,欢迎大家告知。

 浙公网安备 33010602011771号