

第五周总结
json转换语言格式
json转为python使用loads()函数
python转为json使用dumps()函数
图表代码网址 :中文简介 - Document (pyecharts.org)
学会使用网上的json视图查看器分层次(网址:JSON在线视图查看器(Online JSON Viewer) (ab173.com))
set_global_opts方法可以设置全局配置项
折线图:
Line()函数
地图:
Map()函数
add("地图名称",data,"类型")
柱状图:
Bar()函数
reversal_axis()函数:反转xy
label_opts=LabelOpts()设置数值标签
基础时间线柱状图:
Timeline():时间线
add()添加时间线
add_schema函数设置自动播放
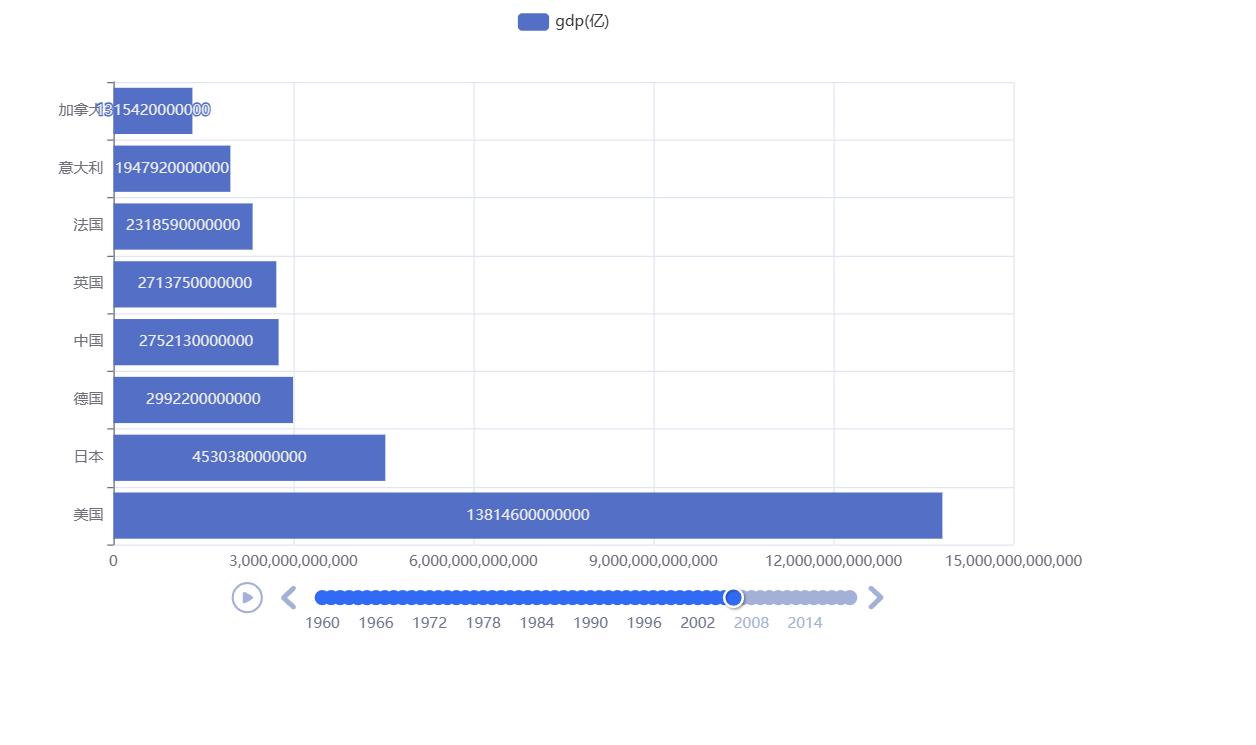
动态柱状图:
sort(key=依据函数结果排序的函数,reverse=Ture|False)函数
代码:
from pyecharts.charts import Bar,Timeline
f=open(r"C:\Users\l'j'h\Desktop\1960-2019全球GDP数据.csv","r",encoding="ANSI")
a=f.readlines()
f.close()
a.pop(0)
dict1={}
timeline=Timeline()
for i in a:
b=i.split(",")
year=int(b[0])
gdp=b[1]
rate=float(b[2])
try:
dict1[year].append([gdp,rate])
except:
dict1[year]=[]
dict1[year].append([gdp,rate])
dict2=sorted(dict1.keys())
for year in dict2:
dict1[year].sort(key=lambda element:element[1],reverse=True)
dict3=dict1[year][0:8]
x=[]
y=[]
for country in dict3:
x.append(country[0])
y.append(country[1])
bar=Bar()
bar.add_xaxis(x)
bar.add_yaxis("gdp(亿)",y)
bar.reversal_axis()
timeline.add(bar,str(year))
timeline.add_schema(
play_interval=1000,
is_timeline_show=True,
is_auto_play=True,
is_loop_play=False
)
timeline.render("1.html")‘

 浙公网安备 33010602011771号