


完整教程:[HTML5]快速掌握canvas
背景
canvas 是 html5 标准中提供的一个标签, 顾名思义是定义在浏览器上的画布
- 通过其强大的绘图接口,我们可以实现各种各样的图形,炫酷的动画,
- 甚至可以利用他开发小游戏,包括市面上很流行的数据可视化框架底层都用到了Canvas。
- 既然他这么强大,那我们还有什么理由不去学习它呢?
基础
渲染上下文
<canvas>是一个HTML元素,我们可以将它简单理解为一个画板,通过Canvas提供的绘制api我们就可以绘制出各种图形。
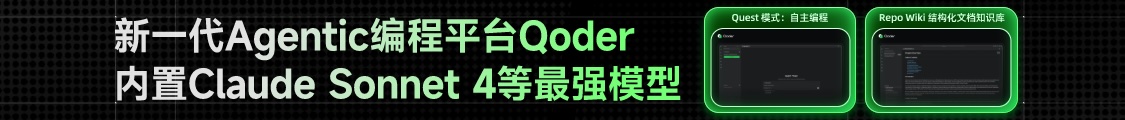
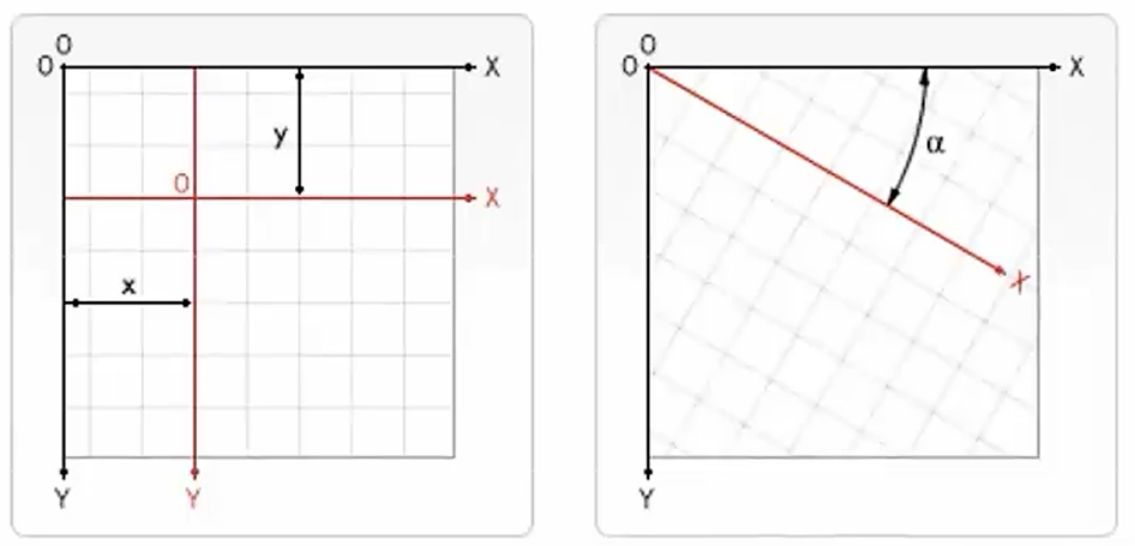
Document .canvas { background-color: pink; } // 获取画布 const c = document.getElementById("canvas") /** * 获取画笔 * 可选参数: * 2d: 获取平面画笔, 绘制2d图形 * webgl: 获取3d画笔, 绘制3d图形 * */ const ctx = c.getContext("2d")canvas中的坐标系和html中的坐标系一样
- 坐标: 控制图形画在什么位置
- 尺寸: 控制图形画多大
绘制图形
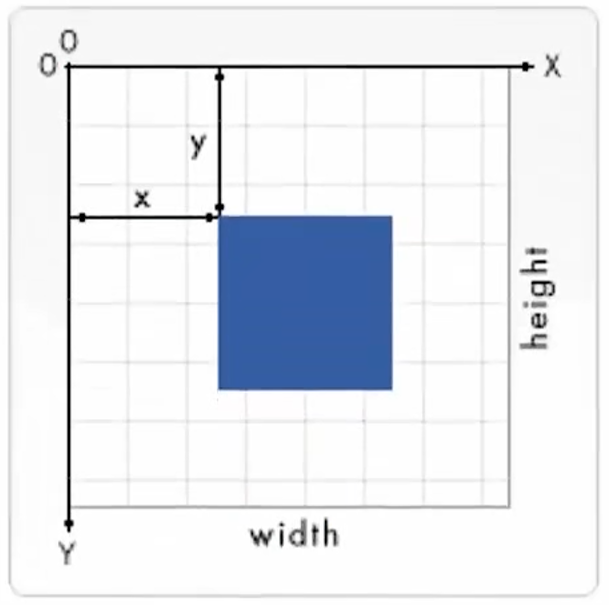
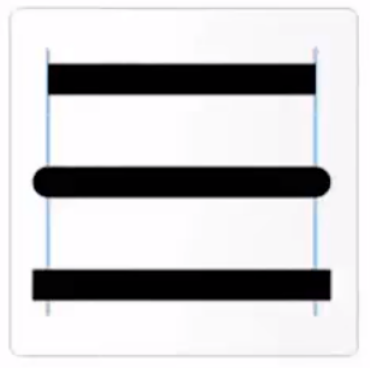
1.1. 线(线, 三角形, 矩形)
重要的API
- 绘制: moveTo, lineTo,stroke
- 设置样式: lineWidth,strokeStyle
- 路径: beginPath,closePath
Document .canvas { background-color: pink; } // 获取画布 const c = document.getElementById("canvas") /** * 获取画笔 */ const ctx = c.getContext("2d") /** * 绘制线条 */ ctx.moveTo(0, 10) // 确定画笔位置 ctx.lineTo(200, 10) // 线的终点 ctx.lineWidth = 50 // 设置线的宽度 ctx.strokeStyle = 'red' // 设置画笔的颜色 (画笔是全局唯一实例) ctx.stroke() // 完成绘制 /** * 绘制线条 */ ctx.beginPath() // 新建路径, 不影响其他路径 ctx.moveTo(0, 50) ctx.lineTo(200, 50) ctx.lineWidth = 10 ctx.strokeStyle = 'blue' ctx.stroke() // stroke的绘制以beginPath为界 /** * 绘制三角形 */ ctx.beginPath() ctx.moveTo(0, 70) ctx.lineTo(200, 70) ctx.lineTo(50, 200) // ctx.lineTo(0, 70) // 手动画线完成路径闭合 ctx.closePath() // 让路径自动闭合 ctx.lineWidth = 1 ctx.fillStyle = 'green' // 设置填充颜色 ctx.fill() // 完成填充 ctx.strokeStyle = 'red' // 设置画笔颜色 ctx.stroke() // 完成绘制 /** * 绘制矩形1 */ ctx.beginPath() // 上定义矩形: 四个参数分别表示矩形左上角的 x 坐标、y 坐标,以及矩形的宽度和高度。 ctx.rect(0, 220, 200, 100) ctx.strokeStyle = 'green' ctx.stroke() /** * 绘制矩形2 */ ctx.beginPath() // 绘制矩形并设置填充色 ctx.fillStyle = 'red' ctx.fillRect(10, 350, 150 ,100) // 绘制矩形并设置边框颜色 ctx.strokeStyle = 'green' ctx.strokeRect(50, 460, 150, 100)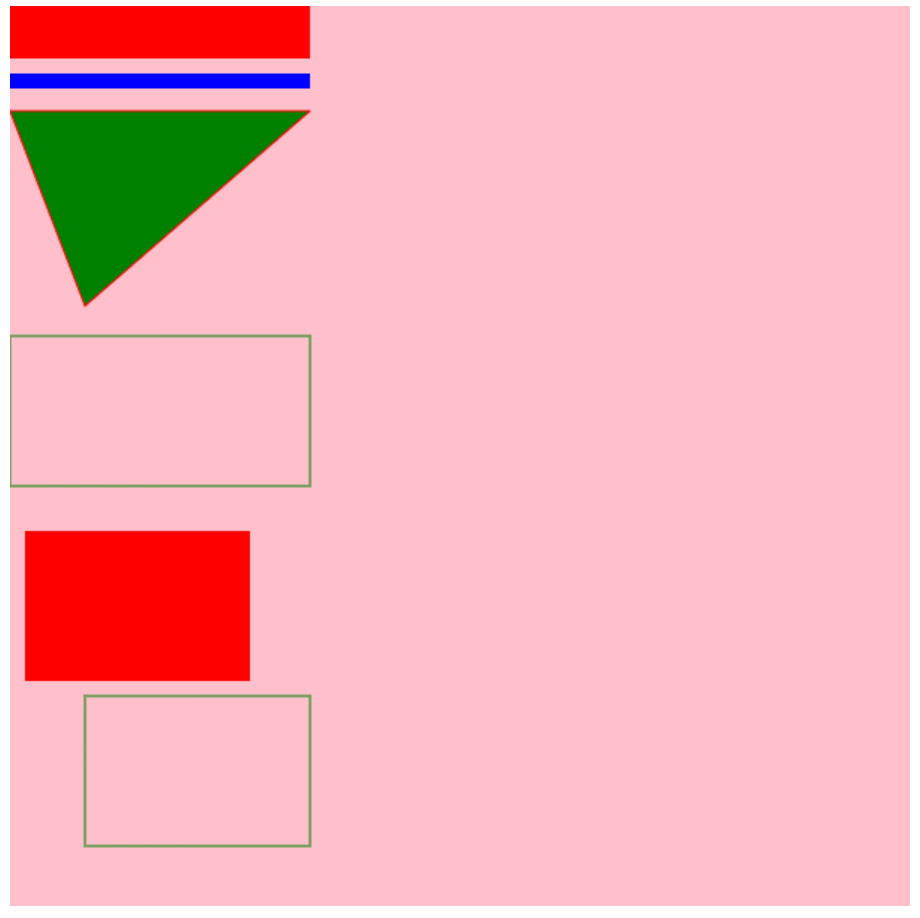
1.2. 弧线(弧, 圆弧, 圆)
arcTo(x1, y1, x2, y2, radius);
- x1和y1: 画笔的坐标
- x2和y2: 两个辅助点
- radius: 控制内切圆的半径, 半径越大弧越大
- 三个点相连组成角, 根据半径计算内切圆, 圆和三角相交的地方叫切点
- 切点相连就画出了一个弧, 弧与起点相连, 就是最终得到的弧线
- 示例
Document .canvas { background-color: pink; } // 获取画布 const c = document.getElementById("canvas") // 获取画笔 const ctx = c.getContext("2d") // 画弧线 ctx.beginPath() ctx.moveTo(200, 10) // 画笔位置就是起点 ctx.arcTo(200, 300, 0, 10, 80) // 画弧 ctx.lineWidth = 5 ctx.strokeStyle = 'green' ctx.stroke() // 画辅助线帮助理解 ctx.strokeStyle = 'red' ctx.lineWidth = 1 ctx.beginPath() ctx.moveTo(200, 10) ctx.lineTo(200, 300) ctx.lineTo(200, 300) ctx.lineTo(0, 10) ctx.closePath() ctx.stroke()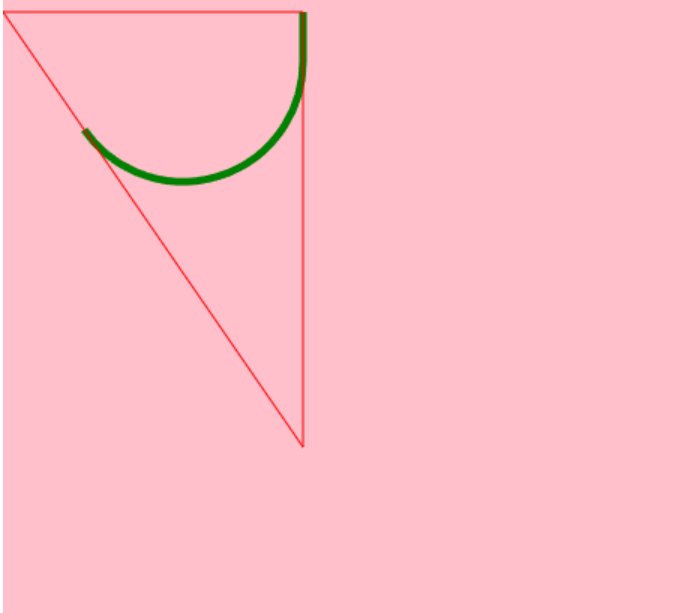
arc(x, y,radius, startAngle, endAngle, anticlockwise);
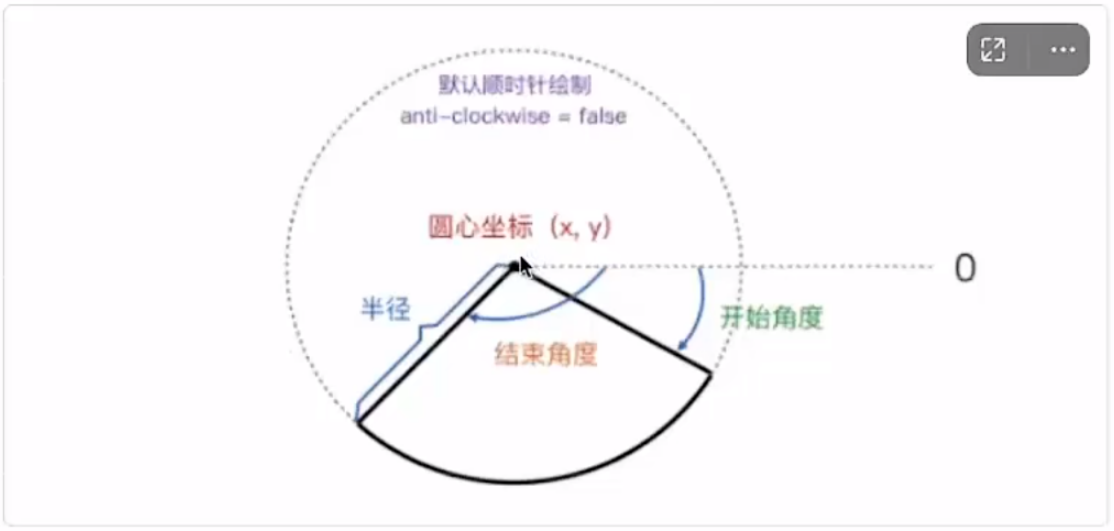
- 参数x, y: 圆心的坐标
- 参数radius: 圆的半径
- 参数startAngle, endAngle: 起始角度和终止角度
- 参数anticlockwise: 顺时针还是逆时针, 默认顺时针
- 示例代码
Document .canvas { background-color: pink; } // 获取画布 const c = document.getElementById("canvas") // 获取画笔 const ctx = c.getContext("2d") // 画弧 ctx.beginPath() ctx.arc(400, 400, 100, 0, Math.PI / 6, true) ctx.strokeStyle = "red" ctx.stroke()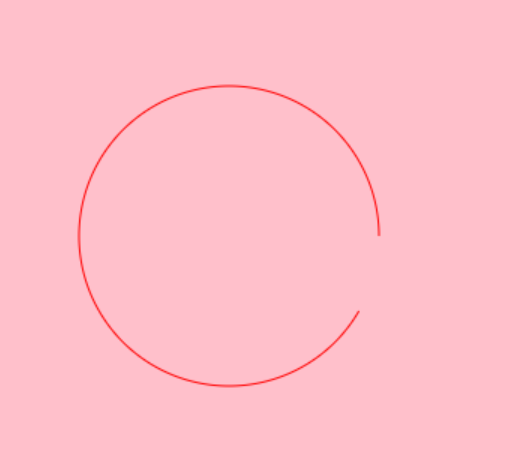
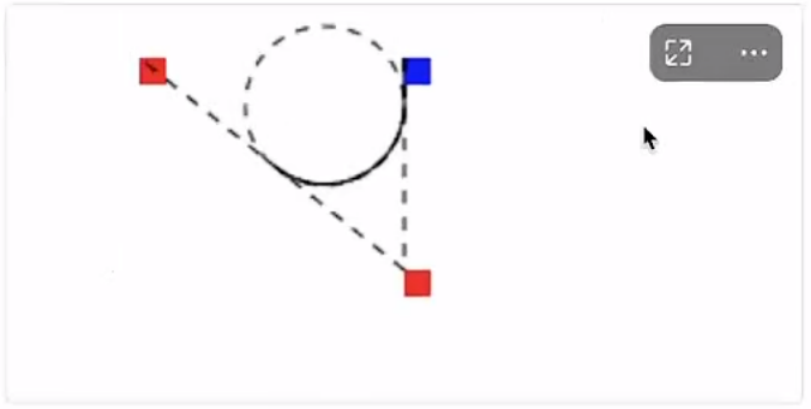
1.3. 贝塞尔曲线
贝塞尔曲线二阶
quadraticCurveTo(cpx, cpy, x, y);
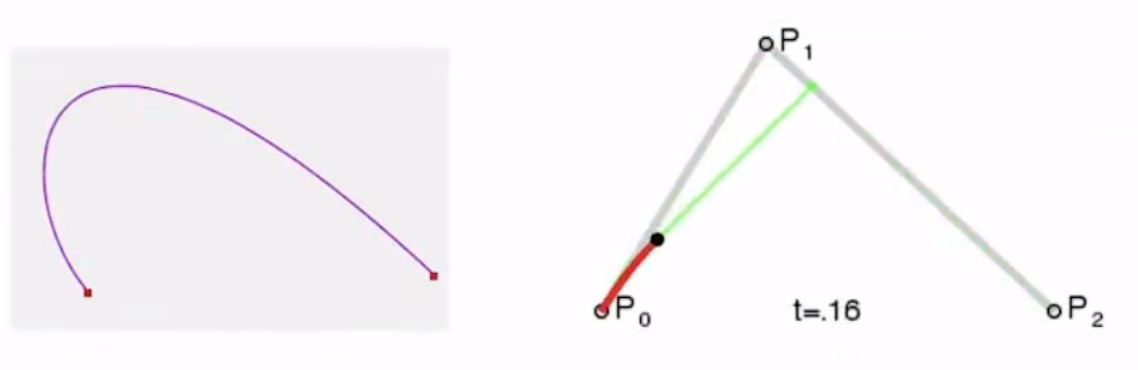
- 参数说明
- cpx, cpy 是控制点的坐标
- x,y 是结束点的坐标
- 通过调整控制点, 就可以生成各种曲线
- 二次贝塞尔曲线调试工具:
Canvas Quadratic Curve Example
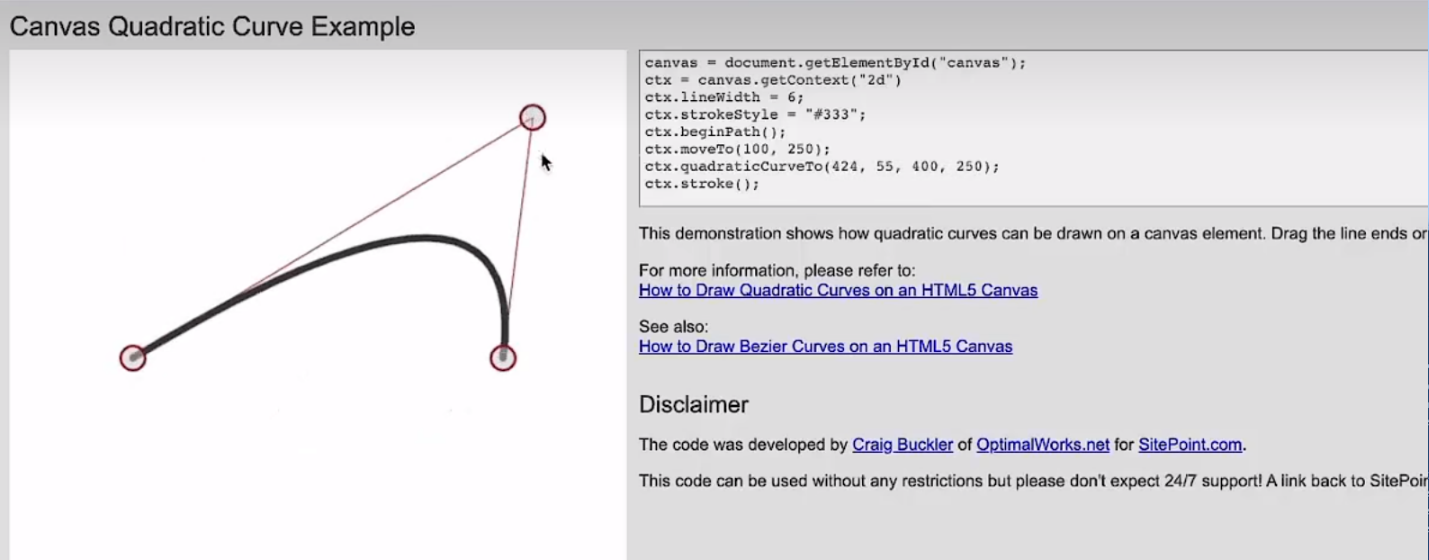
- 示例代码
Document .canvas { background-color: pink; } // 获取画布 const c = document.getElementById("canvas") // 获取画笔 const ctx = c.getContext("2d") // ================================== // 画二阶 ctx.beginPath() ctx.moveTo(100, 100) // 起始点坐标 ctx.quadraticCurveTo(200, 500, 400, 400) ctx.stroke() // 辅助点 ctx.fillStyle = 'red' ctx.fillRect(100, 100, 10, 10) ctx.fillRect(200, 500, 10, 10) ctx.fillRect(400, 400, 10, 10) // ==================================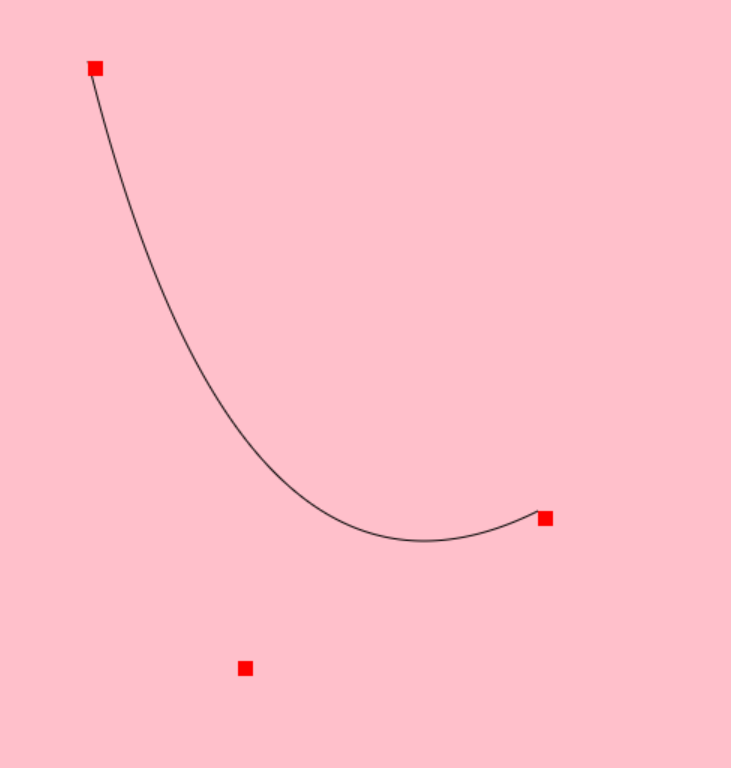
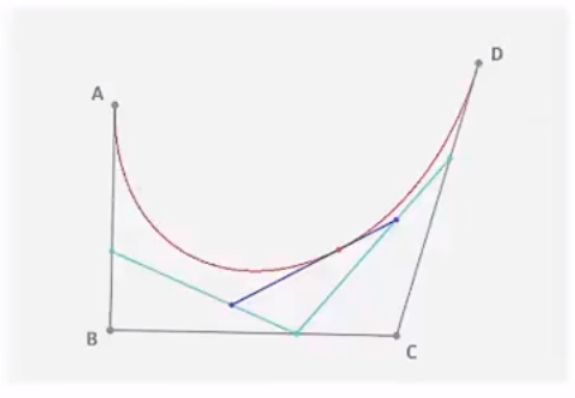
贝塞尔曲线三阶
bezierCurveTo(cp1x, cp1y, cp2x, cp2y, x, y)
- 参数说明
- 三阶就是比二阶多了一个控制点
- cpx1, cpy1 是控制点1的坐标
- cpx2, cpy2 是控制点2的坐标
- x,y 是结束点的坐标
- 通过调整控制点, 就可以生成各种曲线
- 三次贝塞尔调试工具:
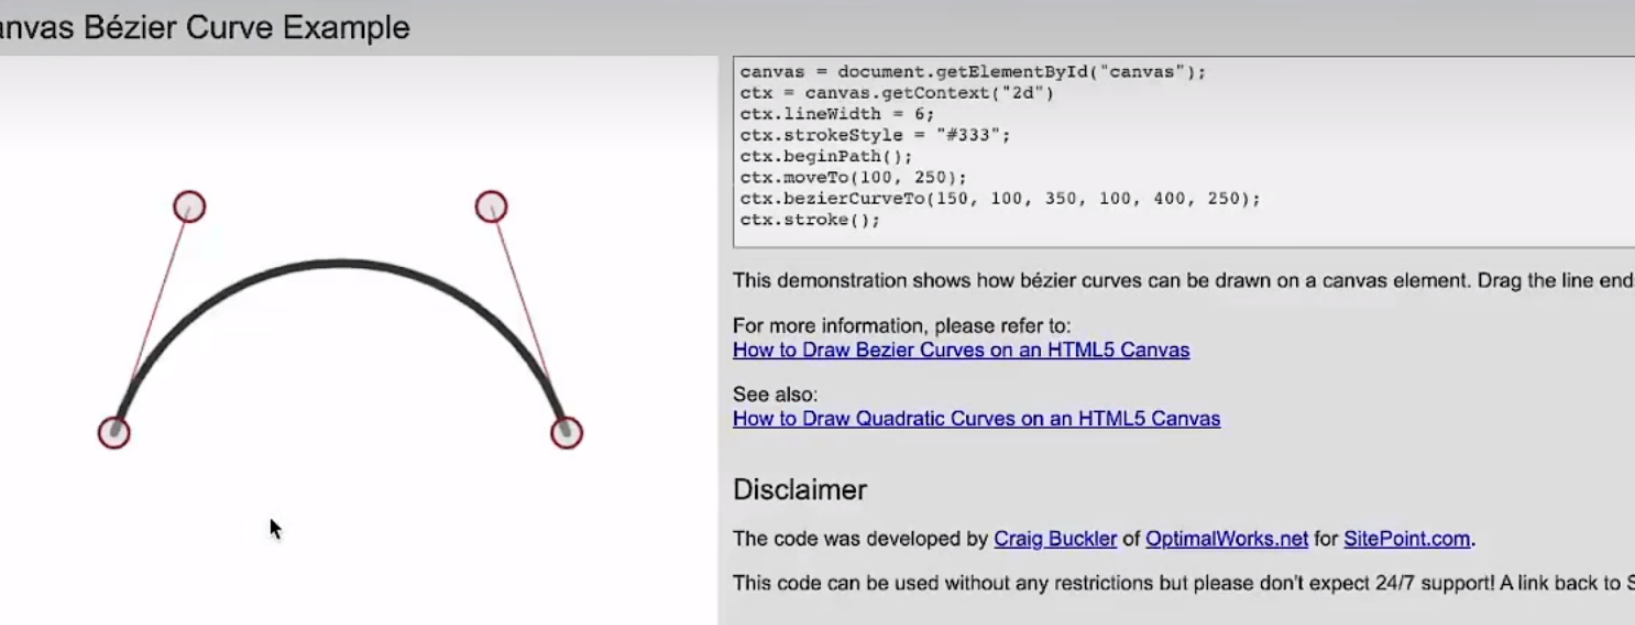
- 示例代码
Document .canvas { background-color: pink; } // 获取画布 const c = document.getElementById("canvas") // 获取画笔 const ctx = c.getContext("2d") // ================================== // 画三阶 ctx.beginPath() ctx.moveTo(20, 20) ctx.bezierCurveTo(20, 700, 200, 100, 700, 500) ctx.stroke() // ==================================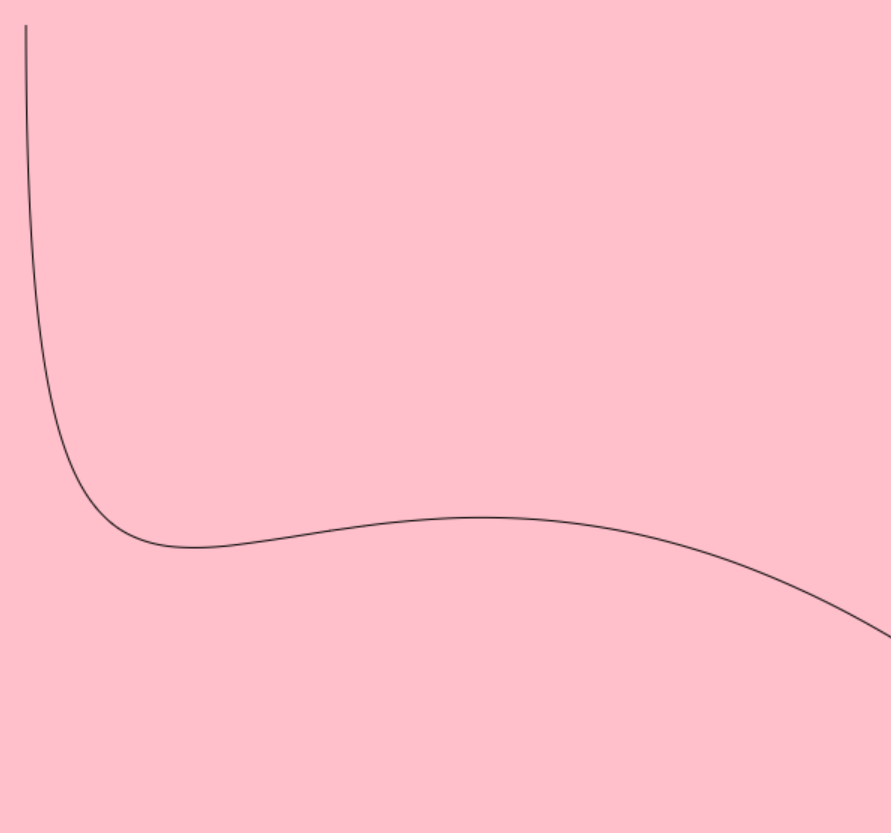
绘图样式
a. 线条样式
- lineWidth: 设置线条的宽度
- lineCap: 设置线条两端的形状
- setLineDash: 设置线条为虚线
- 代码示例
Document .canvas { background-color: pink; } // 获取画布 const c = document.getElementById("canvas") // 获取画笔 const ctx = c.getContext("2d") // 线段样式 ctx.lineWidth = 15 ctx.lineCap = 'round' ctx.beginPath() ctx.moveTo(50, 50) ctx.lineTo(300, 50) ctx.stroke() // 绘制虚线 ctx.beginPath() ctx.moveTo(50, 150) // 参数的是数组, 控制一组线段 // 20是第一个线段长度,40是间隔距离, 50是第二个线段长度 ctx.setLineDash([20, 40, 50]) ctx.lineWidth = 1; ctx.lineTo(500, 150) ctx.stroke()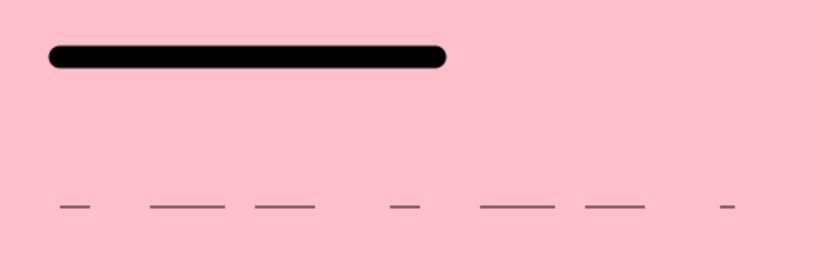
b. 渐变
- 线性渐变 ctx.createLinearGradient(x0,y0,x1, y1);
- 参数说明
- x0,y0是渐变的起点坐标
- x1, y1是渐变的终点坐标
- 有了起点和终点就确定了渐变的方向
- 径向渐变 ctx.createRadialGradient(x0,y0,r0, x1, y1, r1)
- 参数说明
- x0, y0是第一个圆的坐标(圆心), r0是半径
- x1, y1是第二个圆的坐标(圆心), r1是半径
- 示例代码
Document .canvas { background-color: pink; } // 获取画布 const c = document.getElementById("canvas") // 获取画笔 const ctx = c.getContext("2d") // 线性渐变 let gradient = ctx.createLinearGradient(0, 0, 200, 0) // 设置渐变 gradient.addColorStop(0, 'green') // 设置渐变点和颜色值 gradient.addColorStop(1, 'blue') // 设置渐变点和颜色值 ctx.fillStyle = gradient ctx.fillRect(50, 200, 200, 100) // 绘制矩形 // 径向渐变 let gradient2 = ctx.createRadialGradient(150, 450, 150, 150, 450, 0) // 设置渐变 gradient2.addColorStop(0, 'white') gradient2.addColorStop(1, 'green') ctx.fillStyle = gradient2 ctx.fillRect(50, 350, 200, 200)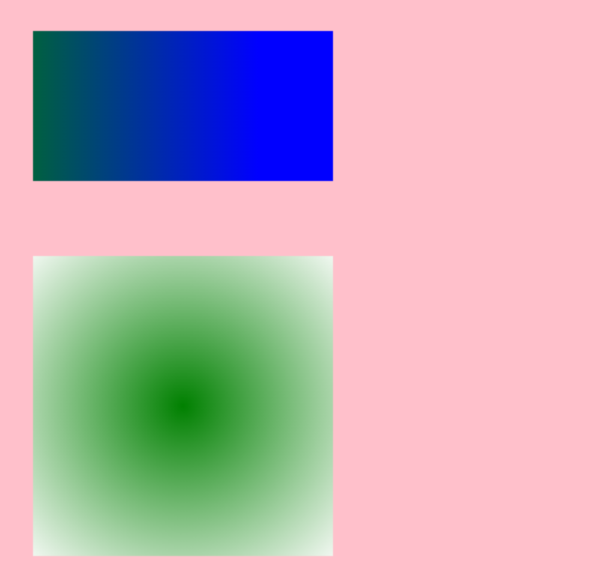
c. 纹理样式
- ctx.createPattern(image, repetition);
参数说明
- image: 把图片作为纹理进行填充
- repetition: 是否重复
代码示例
Document .canvas { background-color: pink; } // 获取画布 const c = document.getElementById("canvas") // 获取画笔 const ctx = c.getContext("2d") // 纹理样式 let img = new Image() img.src = 'images/DE.jpg' img.onload = function () { let pattern = ctx.createPattern(img, 'repeat') ctx.fillStyle = pattern ctx.fillRect(50, 200, 300, 100) }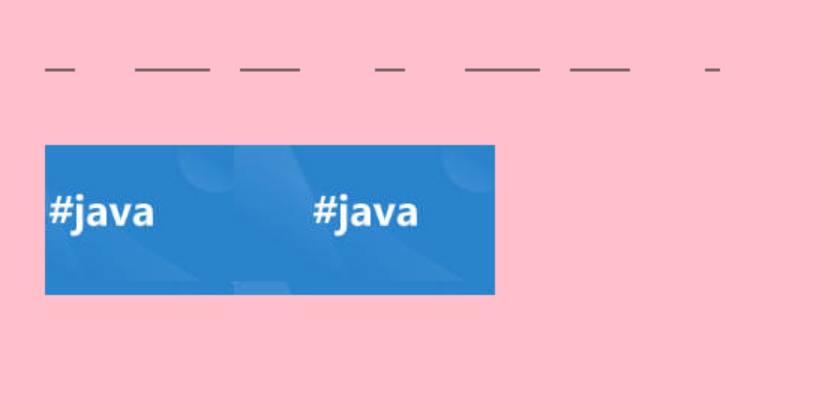
绘制文本
绘制方式
- 轮廓文本 stokeText()
- 填充文本 fillText()
绘制样式
- font、textAlign(设置水平对齐方式)、direction(设置文字方向)、textBaseline(设置垂直对齐方式)
- 阴影: shadowOffsetX和shadowOffsetY、shadowBlur、shadowColor
示例代码
Document .canvas { background-color: pink; } // 获取画布 const c = document.getElementById("canvas") // 获取画笔 const ctx = c.getContext("2d") // 设置文字样式 (字号: 88px 字体: 罗马字体) ctx.font = "88px Times New Roman" // 设置阴影 ctx.shadowOffsetX = 2 //偏移 ctx.shadowOffsetY = 2 //偏移 ctx.shadowBlur = 2 //模糊度 ctx.shadowColor = "rgba(255,0,0,0.5)" // 绘制文本 ctx.fillText('hello canvas', 100, 100) // 纹理背景文字 let img = new Image() img.src = 'images/DE.jpg' img.onload = function () { let pattern = ctx.createPattern(img, 'repeat') ctx.fillStyle = pattern ctx.fillText('hello canvas2', 100, 400) }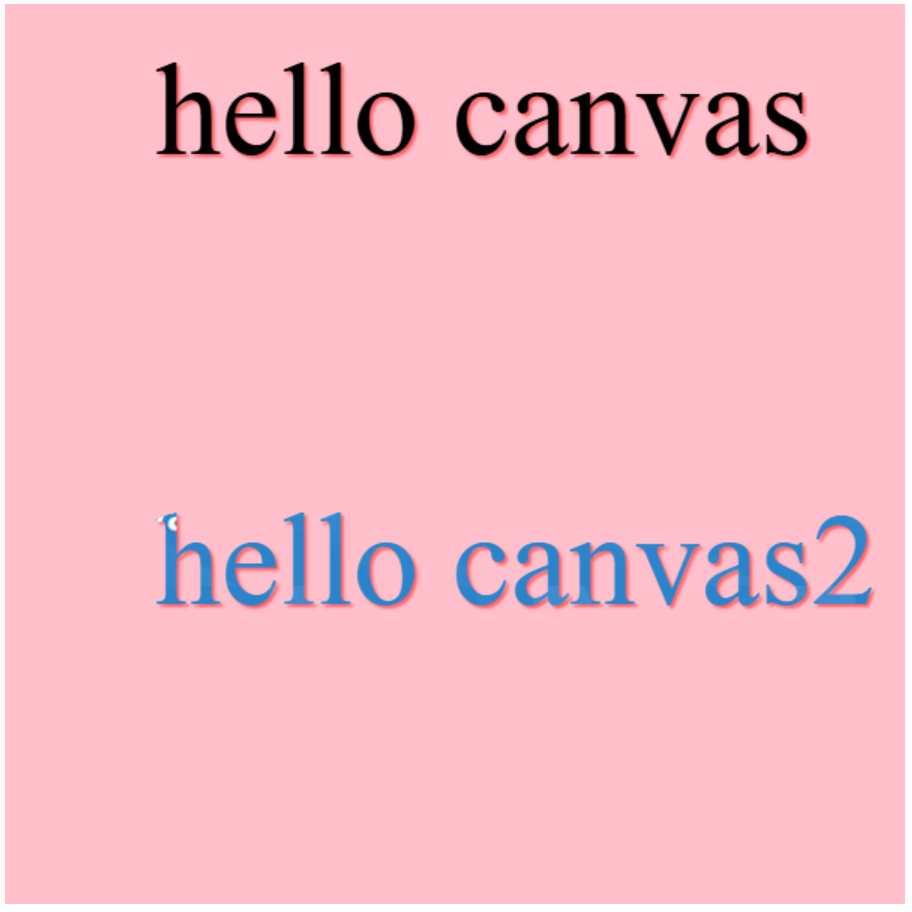
绘制图片
drawimage用法
- drawlmage(image, dx, dy);
- drawlmage(image, dx, dy, dWidth, dHeight);
- drawlmage(image, sx, sy, sWidth, sHeight, dx, dy, dWidth, dHeight);
Document .canvas { background-color: pink; } // 获取画布 const c = document.getElementById("canvas") // 获取画笔 const ctx = c.getContext("2d") // 绘制图片 let img = new Image() img.src = 'images/DE.jpg' img.onload = function () { // 1. 在指定位置画一张图 // drawlmage(image, dx, dy); ctx.drawImage(img, 0, 0) // 2.在指定位置画一张图, 并设置图的尺寸 // drawlmage(image, dx, dy, dWidth, dHeight); ctx.drawImage(img, 0, 120, 50, 50) // 3.指定一张图(image), 选择抠图的位置(sx, sy), 设置抠取的尺寸(sWidth, sHeight), 把抠出来的图放在哪(dx, dy), 放多大(dWidth, dHeight) // drawlmage(image, sx, sy, sWidth, sHeight, dx, dy, dWidth, dHeight); ctx.drawImage(img, 0, 0, 80, 80, 100, 200, 50, 50) }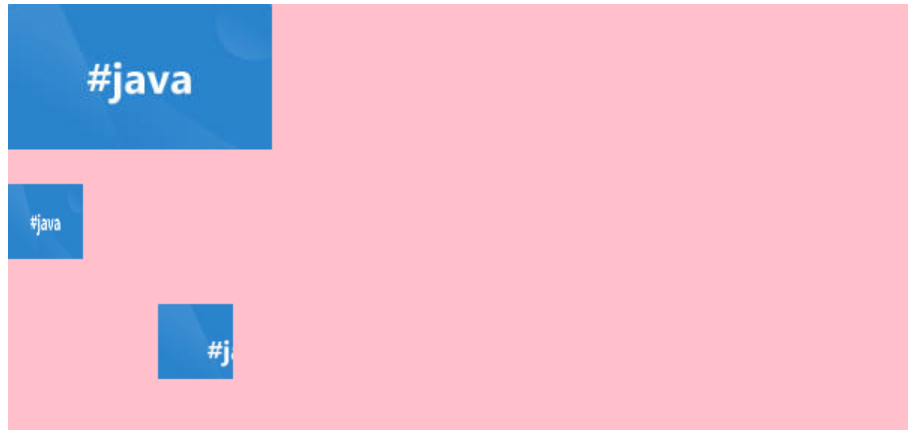
进阶
变形
- 平移, 旋转, 缩放
平移(translate)、旋转(rotate)、缩放(scale)
平移改变的是画布的坐标系位置
Document .canvas { background-color: pink; } // 获取画布 const c = document.getElementById("canvas") // 获取画笔 const ctx = c.getContext("2d") //================================== // 测试平移的效果 // 画个矩形 ctx.fillStyle = 'red' ctx.fillRect(0, 0, 100, 100) // 平移坐标后再画一个矩形 ctx.translate(400, 400) ctx.fillRect(0, 0, 100, 100) // 把坐标平移回原点, 再画一个矩形 ctx.translate(-400, -400) ctx.fillStyle = 'black' ctx.fillRect(0, 0, 50, 50)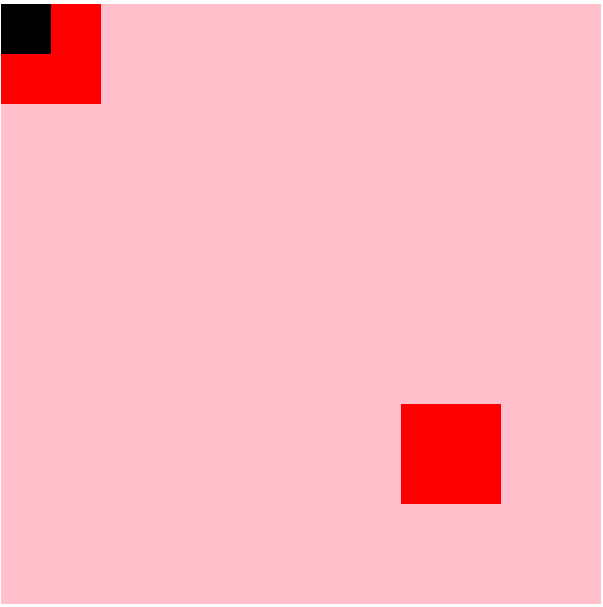
旋转和缩放是对图形的操作
Document .canvas { background-color: pink; } // 获取画布 const c = document.getElementById("canvas") // 获取画笔 const ctx = c.getContext("2d") // 旋转图形 ctx.fillStyle = 'yellow' ctx.rotate(Math.PI / 6) // 旋转60度 ctx.fillRect(100, 0, 100, 100) ctx.restore() // 缩放图形 ctx.fillStyle = 'blue' ctx.scale(0.5, 0.5) ctx.fillRect(400, 400, 100, 100) ctx.restore()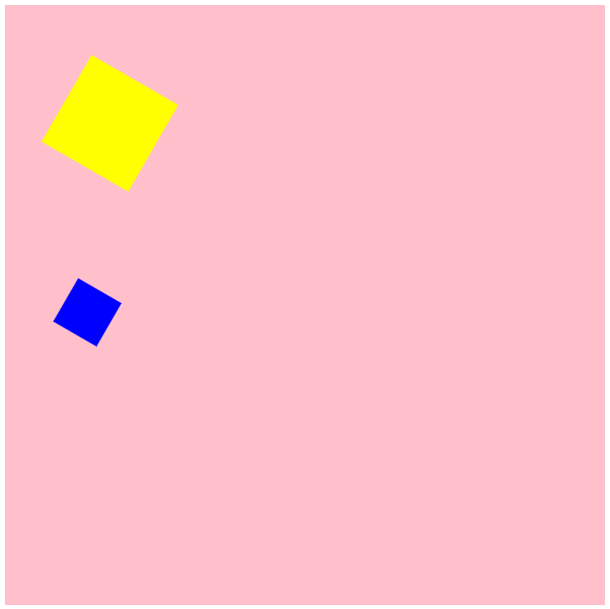
- 状态的保存和恢复 (栈结构)
画布的状态是可以保存和恢复的
Document .canvas { background-color: pink; } // 获取画布 const c = document.getElementById("canvas") // 获取画笔 const ctx = c.getContext("2d") // 上案例的写法需要不断平移坐标, 比较麻烦 // 通过保存和恢复画布状态, 简化对画布的操作 // 画个矩形 ctx.fillStyle = 'red' ctx.fillRect(0, 0, 100, 100) // 平移前先保存画布的状态信息 ctx.save() // 平移坐标后再画一个矩形 ctx.translate(400, 400) ctx.fillRect(0, 0, 100, 100) // 绘制完平移的图形后,恢复之前的状态信息 ctx.restore() // 再绘制图形就不受平移的影响了 ctx.fillStyle = 'black' ctx.fillRect(0, 0, 50, 50)
- transform, setTransform
矩阵变换
语法: transform(a, b, c, d, e, f);
参数:
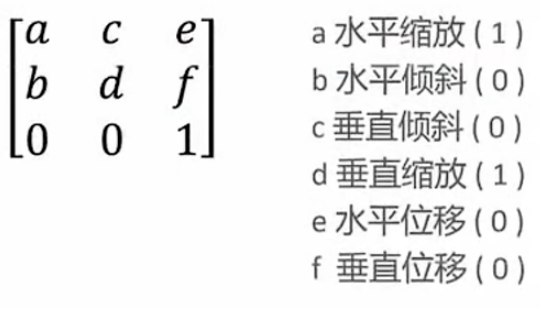
Document .canvas { background-color: pink; } // 获取画布 const c = document.getElementById("canvas") // 获取画笔 const ctx = c.getContext("2d") // 矩阵变换-平移 ctx.transform(1, 0, 0, 1, 400, 400) ctx.fillStyle = 'red' ctx.fillRect(0, 0, 100, 100) ctx.restore() // 矩阵变换-缩放 ctx.transform(0.5, 0, 0, 0.5, 10, 10) ctx.fillStyle = 'green' ctx.fillRect(0, 0, 100, 100) ctx.restore() // 矩阵变换-倾斜 ctx.transform(1, 0.2, 0.2, 1, 10, 10) ctx.fillStyle = 'blue' ctx.fillRect(0, 0, 100, 100) ctx.restore()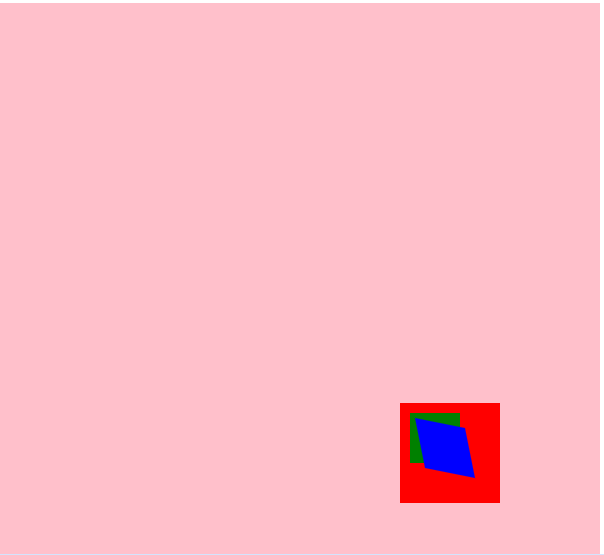
合成
Canvas 提供了26 种图片混排模式
- 语法: ctx.globalCompositeOperation = type;
- 重点参数: destination-out, 可以实现镂空效果
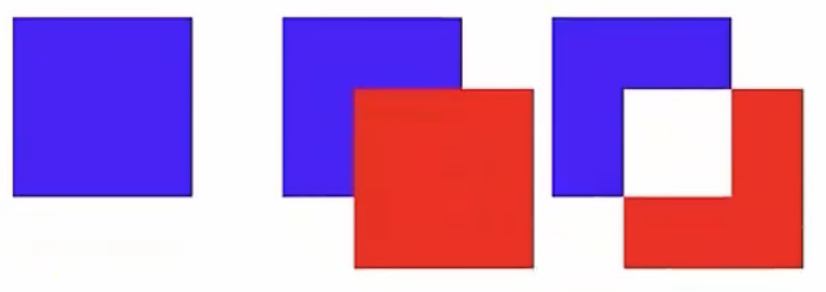
- 其他的合成模式
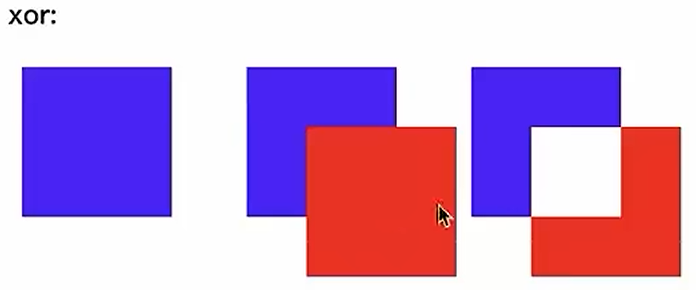
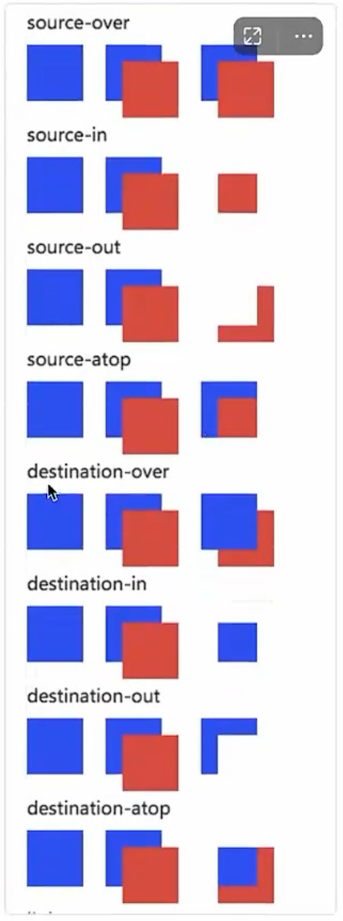
- 示例代码
Document .canvas { background-color: pink; } // 获取画布 const c = document.getElementById("canvas") // 获取画笔 const ctx = c.getContext("2d") ctx.fillStyle = 'blue' ctx.fillRect(10, 10, 100, 100) // source-over: 默认值, 后绘制的图形覆盖先绘制的图形 // ctx.globalCompositeOperation = 'source-over' // destination-over: 先绘制的图形覆盖后绘制的图形 // ctx.globalCompositeOperation = 'destination-over' // destination-out: 图形相交的部分镂空 ctx.globalCompositeOperation = 'destination-out' ctx.fillStyle = 'red' ctx.fillRect(50, 50, 100, 100)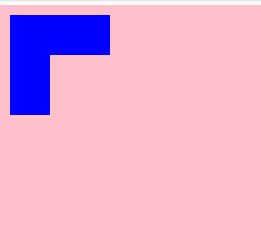
裁剪
clip() 需要配置路径使用
Document .canvas { background-color: pink; } // 获取画布 const c = document.getElementById("canvas") // 获取画笔 const ctx = c.getContext("2d") ctx.rect(0, 0, 200, 100) // 矩形区域 ctx.clip() // 超出矩形区域的文字会被裁剪 ctx.fillStyle = 'red' ctx.font = '44px Times New Roman' ctx.fillText('hello canvas', 50, 50)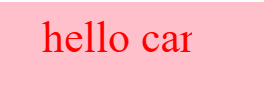
实战
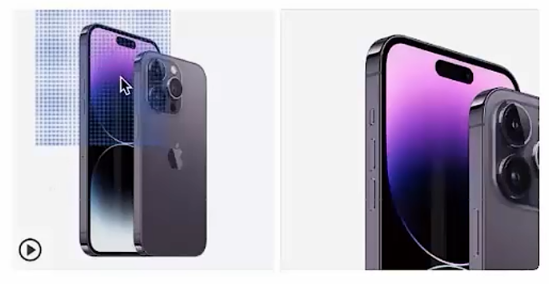
1. 放大镜效果
技术点: 离屏渲染
将一个canvas对象绘制到另一个canvas对象上 (离开用户可视范围内进行染)
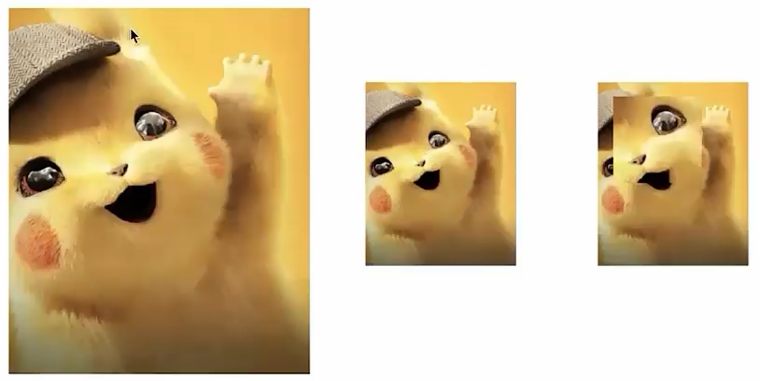
2. 刮刮乐效果
技术点: 图像合成
利用图像合成让绘制的内容与原矩形重合部分清空

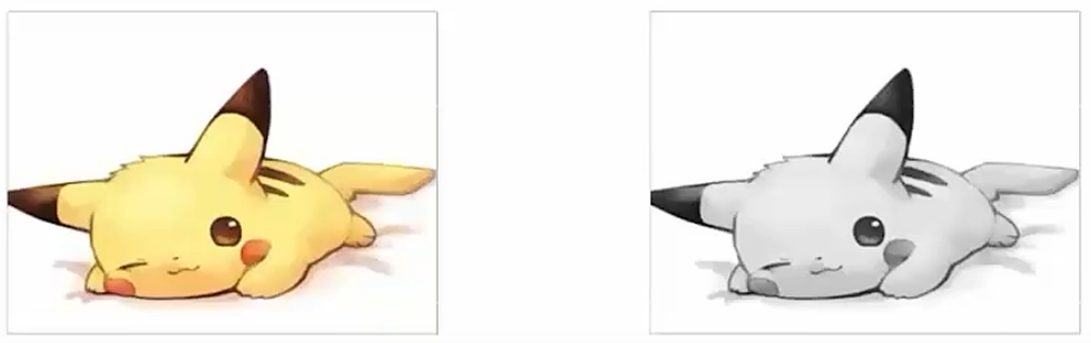
3. 滤镜效果
技术点: 单位像素处理
这里我们主要借用 getlmageData 函数,他返回每个像素的 RGBA 值。借助图像处理公式,操作像素进行相应的、数学运算即可。
- getlmageData()
- putlmageData()

 浙公网安备 33010602011771号