对“数据分析”相关岗位的综合分析
对“数据分析”相关岗位的综合分析
- 数据来源:拉勾网(爬虫) 查看爬虫代码
- 关键字:数据分析
- 样本量:1631条
- 截至日期:2019-07-15
目的
- “数据分析”职位在各城市招聘数量分布
- 总体薪资以及应届生薪资分布
- 工作经验对于薪资的影响
- 相同工作经验下,学历对薪资的影响
- 北京本科应届生及不限经验的平均工资统计
- 应聘者需要掌握哪些技能
    import pandas as pd
    import numpy as np
    import matplotlib.pyplot as plt
    import seaborn as sns
    from wordcloud import WordCloud
    import pymysql
    % matplotlib inline
    plt.rcParams['font.sans-serif'] = ['SimHei']
    # 加载数据
    conn = pymysql.connect(host = "127.0.0.1",
    	port = 3306,
    	user = "root",
    	password = "123456",
    	db = "test",
    	charset = "utf8"
    )
    sqldata = pd.read_sql('SELECT * FROM lagou', conn)
    sqldata.head(2) # 查看数据
    sqldata.to_csv("拉勾数据分析.csv", encoding='utf_8_sig') # 导出
数据清洗
    sqldata.isnull().sum() # 查看缺失值
    sqldata.info() # 查看信息
共1631个值,经纬度(longitude, latitude)缺失部分数据,标签项(hitags)数据严重缺失,但对此次分析并无影响
    # 分割工资
    spllist = sqldata['salary'].str.replace("k",'').str.replace("K",'').str.split('-')
    # 取平均值
    ee = (spllist.str[0].astype('int') + spllist.str[1].astype('int'))/2
    sqldata.drop('salary',axis=1)
    sqldata['salary'] = ee
    # 查看异常值
    sqldata[sqldata['salary']>200]
    # 删除异常值
    sqldata.drop(sqldata[sqldata['salary']>200].index,inplace=True)
各城市招聘数量分布
    city_series = sqldata['city'].value_counts()
    fig,ax=plt.subplots(figsize=(10,5))
    ax.bar(city_series.index,city_series)
    ax.set_title("各城市招聘数量分布",fontsize=17)
    for a,b in zip(city_series.index,city_series):
        plt.text(a, b+1.5, '%.0f' % b, ha='center', va= 'bottom',fontsize=10)
    plt.xticks(np.arange(len(city_series)),city_series.index)
    plt.xlabel('地区', size=12);
    plt.ylabel('频数', size=12);
    plt.ylim(0,520)
    plt.show()
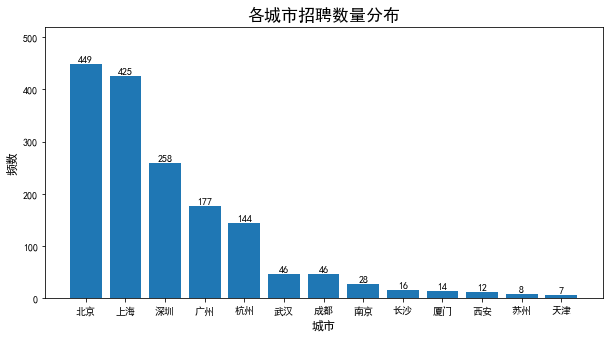
- 由上图所示,“数据分析”这一职业,主要分布在北京、上海、深圳、广州、杭州,其他城市需求较少
- 总体来看,发布此岗位招聘信息的地区主要为一线发达城市。
薪资分布情况
总体薪资分布情况
    sqldata['salary'].hist(figsize=(10,5),bins = 30, edgecolor='k', grid = False, )
    plt.xlabel('薪资(千/月)', size=12)
    plt.ylabel('频数', size=12)
    plt.title('总体薪资分布', size=17)
    plt.xticks(range(0,90,5), size=12)
    plt.yticks(size=12)
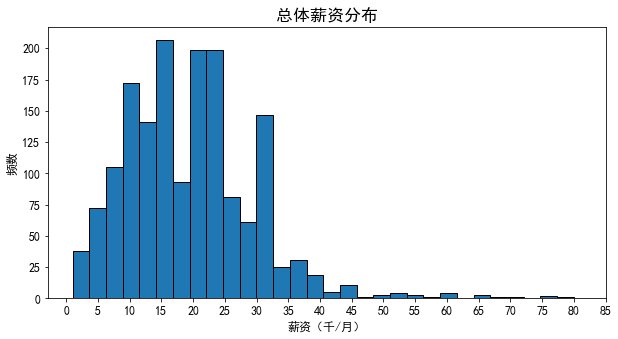
- 从分布来看,"数据分析"这一岗位薪资主要集中在10k-25k之间,在40k以上的很少,低于5K的也占一定比例,最高的薪资达到了75k以上,对于一个数据分析师,拿到10k以上的几率比较大,从总体薪资上看,该职位工资还是很诱人的。
"应届生"及"经验不限"薪资分布情况
    # 应届生 经验不限 数据
    yingjie = sqldata[sqldata['workYear'].str.contains("应届|不限")]
    yingjie.hist(figsize=(10,5),bins = 30, edgecolor='k', grid = False, )
    plt.xlabel('薪资(千/月)', size=12)
    plt.ylabel('频数', size=12)
    plt.title('应届生及经验不限-薪资分布', size=17)
    plt.xticks(range(0,90,5), size=12)
    plt.yticks(size=12)
    plt.show()
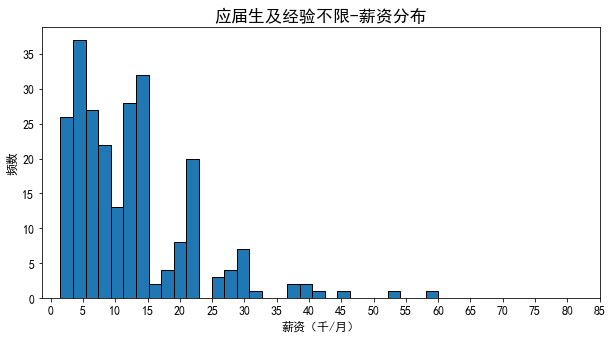
- 应届生以及经验不限的,薪资主要分布在3k-15k之间,30k以上很少
工作经验对薪资影响
    # 工作经验均值
    jobMean = sqldata.groupby('workYear').mean().reset_index()
    jobCount = sqldata.groupby('workYear').count()['city'].reset_index()
    # jobCount['percent'] = jobCount['city']/sqldata.count()['city']
    jobCount.rename(columns={'city' : 'count'},inplace=True)
    jobCount
    # 根据薪资排序
    jobMean.sort_values('salary',inplace=True)
    jobMean
    # 箱线图各年限薪资
    nianxianBoxData = [
    	np.array(sqldata[sqldata['workYear'] == "应届毕业生"]['salary']),
    	np.array(sqldata[sqldata['workYear'] == "1年以下"]['salary']),
        np.array(sqldata[sqldata['workYear'] == "1-3年"]['salary']),
        np.array(sqldata[sqldata['workYear'] == "不限" ]['salary']),
        np.array(sqldata[sqldata['workYear'] == "3-5年" ]['salary']),
        np.array(sqldata[sqldata['workYear'] == "5-10年"]['salary']),
        np.array(sqldata[sqldata['workYear'] == "10年以上"]['salary'])
    ]
    fig = plt.figure(figsize=(18,6))
    ax1 = plt.subplot(121)
    ax3 = plt.subplot(122)
    sizes = jobCount['count']
    labels = jobCount['workYear']

    ax1.pie(sizes,labels=labels,
           autopct='%1.1f%%',
           shadow=False,pctdistance =0.8,
           explode=None,
           textprops={'fontsize': 13, 'color': 'w'},
           startangle=83
          )
    ax3.boxplot(
    	nianxianBoxData,
    	boxprops = {'color':'blue'},
    	flierprops = {'markerfacecolor':'red','color':'black','markersize':4}
    )
    ax3.set_xticklabels(
    	['应届毕业生','1年以下','1-3年','不限','3-5年','5-10年','10年以上']
    )
    ax1.set_title("工作年限频数分布",fontsize=17)
    ax3.set_title("各年限的薪资分布",fontsize=17)
    ax1.legend(loc='best')
    ax3.set_xlabel('年限', size=12);
    ax3.set_ylabel('薪资(千/月)', size=12);
    ax1.axis('equal')
    plt.show()
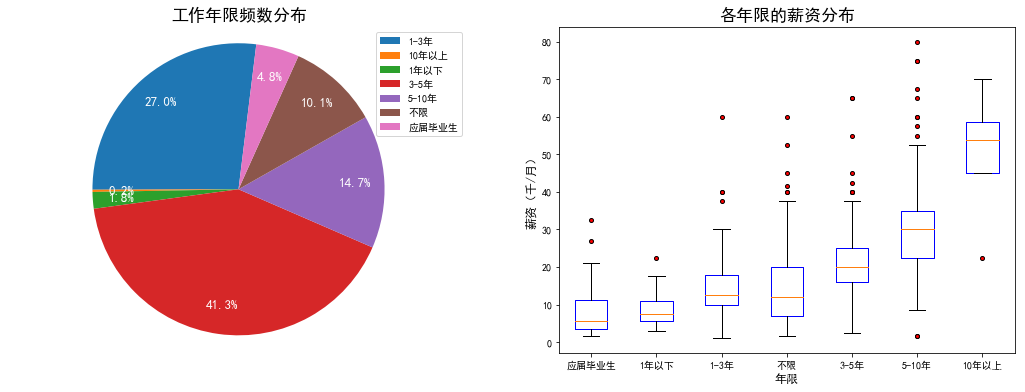
- 随着工作经验的增加,工资有稳定增长趋势
- 大部分岗位要求有工作经验的,主要集中在3-5年,其次是1-3年的
- 应届生平均工资最低,平均在7.8k,最高的是10年以上,达到5w的工资。
- 应届生的普遍工资是在均值以上的,也就是说大部分在7.8k以上,个别高的薪资可达到3w+
- 在5年以下经验的薪资大多数都给到平均薪资以上,5年往上的经验在平均薪资以下居多,5-10年经验的在各个薪资范围内都有岗位,薪资最高的也是在5-10年
学历对薪资影响
    workyear = sqldata.groupby('education').count()['city'].reset_index()
    workyear.rename(columns={'city' : 'count'},inplace=True)
    workyear

    size3 = workyear['count']
    labels3 = workyear['education']
    # 学历箱线图各年限薪资数据
    xueliBoxData = [
    	np.array(sqldata[sqldata['education'] == "大专"]['salary']),
        np.array(sqldata[sqldata['education'] == "不限"]['salary']),
        np.array(sqldata[sqldata['education'] == "本科"]['salary']),
        np.array(sqldata[sqldata['education'] == "硕士"]['salary']),
        np.array(sqldata[sqldata['education'] == "博士"]['salary'])
    ]
    # 作图
    fig = plt.figure(figsize=(18,6))
    ax1 = plt.subplot(121)
    ax2 = plt.subplot(122)
    ax1.pie(size3,labels=labels3,
    	autopct='%1.1f%%',
        shadow=False,pctdistance =0.8,
        explode=None,
        textprops={'fontsize': 13, 'color': 'w'},
        startangle=180
    )
    ax2.boxplot(xueliBoxData,
    	boxprops = {'color':'blue'},
    	flierprops = {'markerfacecolor':'red','color':'black','markersize':4}
    )
    ax2.set_xticklabels(['大专','不限','本科','硕士','博士'])
    ax2.set_title("各年限的薪资分布",fontsize=17)
    ax2.set_xlabel('学历', size=12);
    ax2.set_ylabel('薪资(千/月)', size=12);
    ax1.legend(loc='best')
    ax1.set_title("学历频数分布",fontsize=17)
    ax1.axis('equal')
    plt.show()
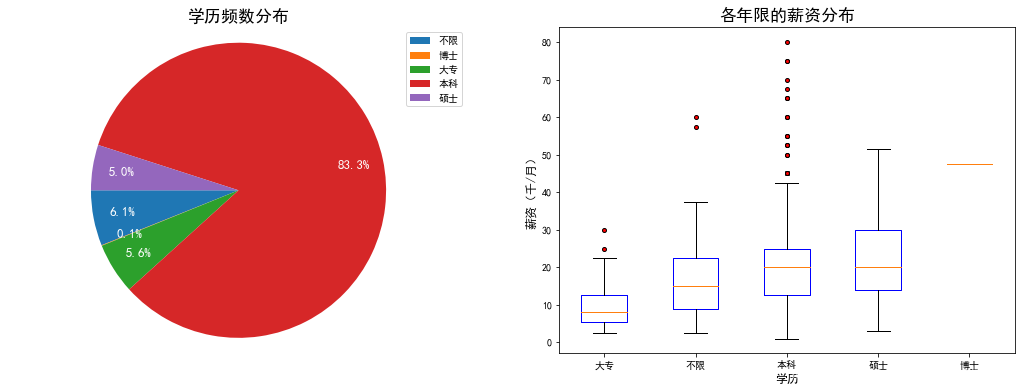
- 绝大部分招聘学历在"本科"以上,博士的招聘信息最少
- 专科要求的招聘相对集中在9k,相对其他学历来说,提升空间较低,本科要求的招聘信息在各个薪资区间都有,且中位数与硕士持平,博士要求的招聘信息少,但是薪资给的高出其他学历很多。起薪也是跟学历的高低呈正相关
相同经验下,学历对薪资的影响
    effectdata = [
    	sqldata[sqldata['workYear'] == "不限"].groupby('education').mean().rename(columns={'salary' : '不限'}),
        sqldata[sqldata['workYear'] == "应届毕业生"].groupby('education').mean().rename(columns={'salary' : '应届毕业生'}),
        sqldata[sqldata['workYear'] == "1年以下"].groupby('education').mean().rename(columns={'salary' : '1年以下'}),
        sqldata[sqldata['workYear'] == "1-3年"].groupby('education').mean().rename(columns={'salary' : '1-3年'}),
        sqldata[sqldata['workYear'] == "3-5年"].groupby('education').mean().rename(columns={'salary' : '3-5年'}),
        sqldata[sqldata['workYear'] == "5-10年"].groupby('education').mean().rename(columns={'salary' : '5-10年'}),
        sqldata[sqldata['workYear'] == "10年以上"].groupby('education').mean().rename(columns={'salary' : '10年以上'}),
    ]
    effect = pd.concat(effectdata,axis=1,sort=True)
    doctor = effect.loc[['博士']]
    effect.drop('博士',inplace=True)
    effect = effect.append(doctor)
    effect
    # 柱状图
    effect.T.plot.bar(figsize=(16,10),width=0.7)
    plt.xticks(rotation=0)
    plt.xlabel('年限', size=12)
    plt.ylabel('薪资(千/月)', size=12)
    plt.title("相同经验下,学历对薪资的影响",fontsize=17)
    plt.show()
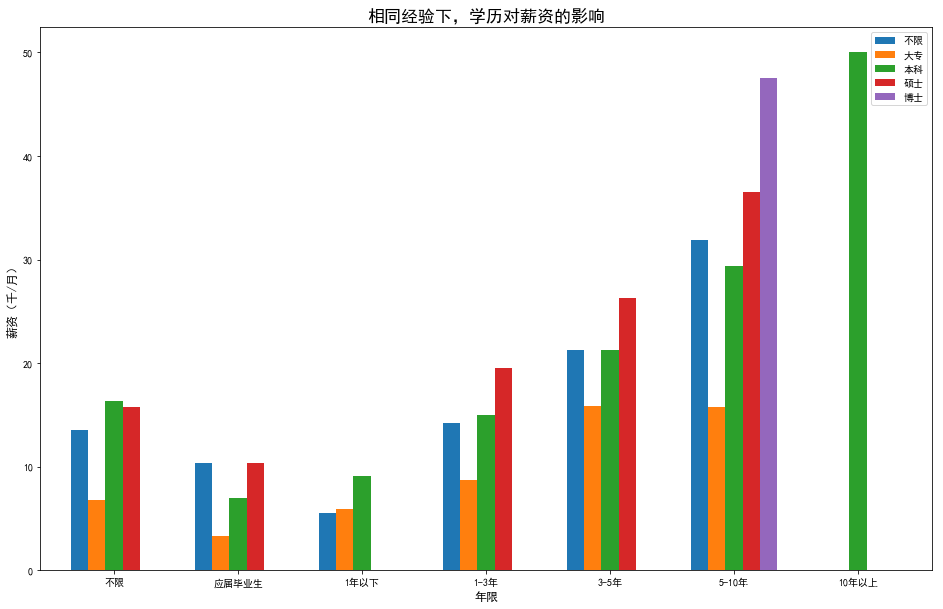
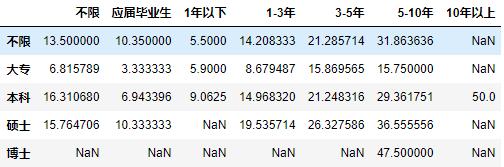
- 整体呈增长的趋势,工作年限越高,工资越高,应届生的薪资,从总体来看还是最低的
- 大专学历,在3-5年和5-10年平均薪资相同,在5-10年可能是专科学历的一个瓶颈期,这个经验的学历卡的比较严重
- 没有看到1年以下硕士以上学历的招聘,10年以上经验只招本科以上学历;对于10年以上工作经验的,技能已经很强了
- 从学历上来看,可明显看出,在同样工作经验下,学历高的要比学历低的薪资要高
- 对于不限学历的,在3-10年经验下,与本科学历持平甚至高出本科学历的薪资,可见,部分企业还是很看重员工的技能的,技能足够还是可以拿到与本科学历持平的工资
北京本科应届生及不限经验的平均工资统计
    beijingnum = sqldata[(sqldata['city']== '北京')&(sqldata['education']== '本科')&(sqldata['workYear'].str.contains("应届|不限"))]['salary']
    plt.figure(figsize=(10,5))
    plt.hist(beijingnum)
    plt.xlabel('薪资(千/月)', size=12);
    plt.ylabel('频数', size=12);
    plt.title('北京应届生及不限经验的招聘信息平均工资统计', size=17)
    plt.show()
beijingnum.describe().reset_index()
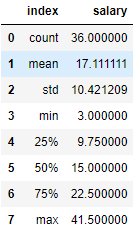
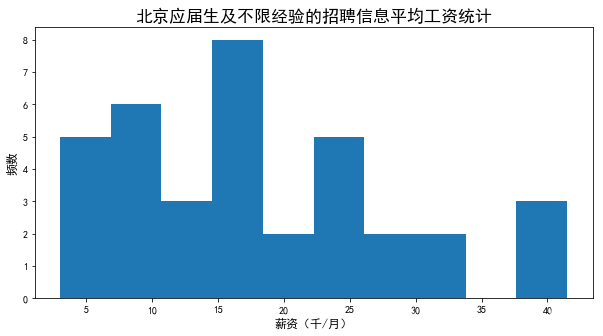
- 筛选后数据较少,薪资在各个区间都占有一定比例,企业可能是根据不同的需求而给出不同的薪资,平均在17k,中位数在15k,如果能力优秀,技能达标,当然应届生也能拿到一个很好的工资,此数据也可能有一部分公司是因为忘记了打上工作年限标签。
技能标签词云统计
分割文本
    positionLable = sqldata['positionLable']
    sp = positionLable.str.split(',').tolist()
    wordlist = [i for item in sp for i in item]
    wordlist

    def isAllZh(s):
        if len(s) == 1:
            return False
        for c in s:
            if not('\u4e00' <= c <= '\u9fa5'):
                return False
        return True
    word_count = {}
    for word in wordlist:
    #     if isAllZh(word):
        word_count[word] = word_count.get(word, 0) + 1
    items = list(word_count.items())
    # print(items)
    chinese_words = []
    items.sort(key=lambda x: x[1], reverse=True)
    for i in range(50):
        word, count = items[i]
        for j in range(count):
            chinese_words.append(word)
        print("{0:<10}{1:>5}".format(word, count))
词云分析
    string = ' '.join(chinese_words)
    w = WordCloud(collocations=False,
                  width=2000,height=1000,
                  font_path='simhei.ttf',
                  background_color='white',
                  stopwords=['数据分析'],
                  max_words=50,
                  max_font_size=400,
                  min_font_size=40
                 )
    w.generate_from_text(string)
    plt.imshow(w)
    plt.axis('off')
    plt.figure()

- 对技能标签进行处理分析得出上图,可见招聘公司较为看重数据库的应用,数据挖掘,数据运营,电商、金融行业,可视化的实现等技能
总结
- “数据分析"这一岗位,主要集中在"北京”,“上海”,“深圳”,“广州”,"杭州"五大一线城市,北京与上海岗位最多
- 从各大一线城市统计,应届生薪资相对最低,招聘数量也居少,算上“经验不限”的,平均可拿到近8k的工资(这里数据有一部分公司未打年限标签,写的经验不限,实际上会有要求),可见对于薪资方面这一行业相比于其他传统行业较好
- 总体上,工作经验与薪资水平呈正相关,1-3年经验的薪资一半多人超过了1万,3-5年工作经验的,大多都在1.5万以上,而5年以上经验的,中值达到了3万以上
- 企业要求3-5年经验的最多,其次是1-3年的,要求1年以下以及10年以上的很少
- 从学历看,大部分企业要求学历达到本科以上,本科与硕士的下限工资几乎相同,但大专学历的下限相比与本科硕士低近6k的工资,博士相对与其他,工资高出很多,但需求较少
- 在5-10年可能是专科学历的一个瓶颈期,工资较3-5年并没有明显提升
- 根据企业打的技能标签,大多数企业主要希望招聘者有以下技能:数据库的应用,数据处理,数据运营,数据挖掘算法,数据可视化,业务层面,对电商,金融行业的理解
- 对于详细的技能、工作要求以及公司规模等维度,日后再做详细分析


 浙公网安备 33010602011771号