

折线图的详细配置
折线用于反应事物发展趋势和分布状况,下面来介绍几种不同的折线图
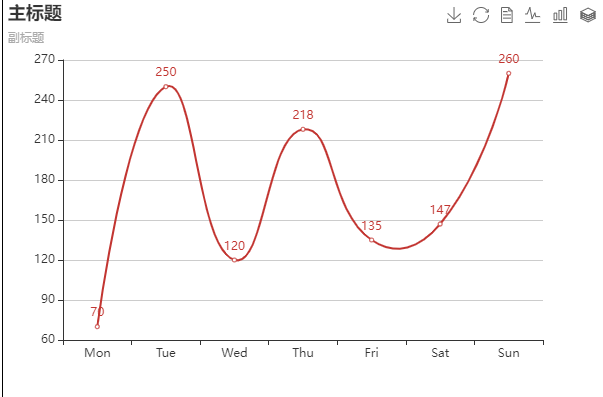
标准折线图
var option = {
            title: { //设置标题
                text: '主标题',
                subtext: '副标题',
            },
            legend: {//设置图例
                type:'',//scroll设置为滚动图例,默认为plain
                orient: 'horizontal',//图例对齐方式为水平对齐,垂直对其:'vertical'
                data: []
            },
            tooltip: {//提示框组件
                trigger: '',//设置提示框触发方式。'item',移动到数值上才会触发。'axis',移动到数值附近后自动提示并且有条贯穿数值的竖线
          formatter: "{a}<br/>{b}:{c}"//提示框显示内容
            },
            toolbox: {//工具箱
                feature: {
                    saveAsImage: {},//保存图片
                    restore: {},//配置还原
                    dataView: {},//数据视图
                    magicType: {//数据类型切换
                        type: ['line', 'bar', 'stack']
                    }

                }
            },
            xAxis: {
                type: 'category',
                data: ['Mon', 'Tue', 'Wed', 'Thu', 'Fri', 'Sat','Sun'],
            },
            yAxis: {
                type: 'value',
                scale:'ture'//缩放:脱离0值比例,以最小的数值作为最低值
            },
            series: [
                {
                    //step:'end',//设置折线的样式,绘制阶梯图
                    data: [70, 250, 120, 218, 135, 147, 260],
                    type: 'line',
                    smooth: 'ture',   //线条设为平滑的
                    label:{show:'true'},//显示线条对应点的数值
                }
            ]
        };
堆积面积图和堆积折线图
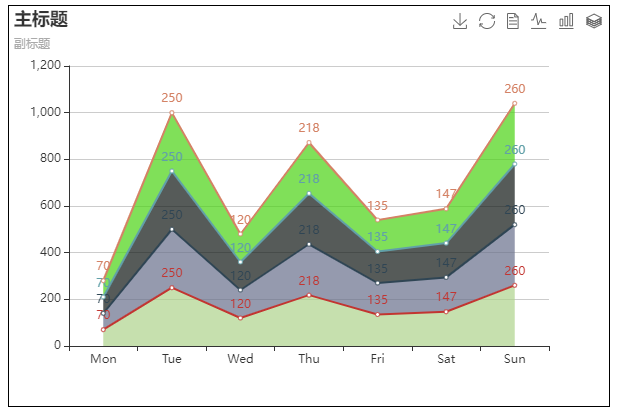
堆积面积图
var option = {
            title: { //设置标题
                text: '主标题',
                subtext: '副标题',
            },
            legend: {//设置图例
                type:'',//scroll设置为滚动图例,默认为plain
                orient: 'horizontal',//图例对齐方式为水平对齐,垂直对其:'vertical'
                data: []
            },
            tooltip: {//提示框组件
                trigger: 'axis',//设置提示框触发方式。'item',移动到数值上才会触发。'axis',移动到数值附近后自动提示并且有条贯穿数值的竖线
                formatter: "{a}<br/>{b}:{c}"//提示框显示内容
            },
            toolbox: {//工具箱
                feature: {
                    saveAsImage: {},//保存图片
                    restore: {},//配置还原
                    dataView: {},//数据视图
                    magicType: {//数据类型切换
                        type: ['line', 'bar', 'stack']
                    }

                }
            },
            xAxis: {
                type: 'category',
                data: ['Mon', 'Tue', 'Wed', 'Thu', 'Fri', 'Sat','Sun'],
            },
            yAxis: {
                type: 'value',
                scale:'ture'//缩放:脱离0值比例,以最小的数值作为最低值
            },
            series: [
                {

                    data: [70, 250, 120, 218, 135, 147, 260],
                    stack:'堆积',
                    type: 'line',
                    label:{show:'true'},//显示线条对应点的数值
                    itemStyle:{
                        normal:{areaStyle:{type:'dfault',color:'rgb(174,211,139)'}}
                    }
                },
                {

                    data: [70, 250, 120, 218, 135, 147, 260],
                    type: 'line',
                    stack:'堆积',
                    label:{show:'true'},//显示线条对应点的数值
                    itemStyle:{
                        normal:{areaStyle:{type:'dfault',color:'rgb(104,111,139)'}}
                    }
                },
                {

                    data: [70, 250, 120, 218, 135, 147, 260],
                    type: 'line',
                    stack:'堆积',
                    label:{show:'true'},//显示线条对应点的数值
                    itemStyle:{
                        normal:{areaStyle:{type:'dfault',color:'rgb(14,21,19)'}}
                    }
                },
                {

                    data: [70, 250, 120, 218, 135, 147, 260],
                    type: 'line',
                    stack:'堆积',
                    label:{show:'true'},//显示线条对应点的数值
                    itemStyle:{
                        normal:{areaStyle:{type:'dfault',color:'rgb(74,211,19)'}}
                    }
                },

            ]
        };
堆积折线图
 var option = {
            title: { //设置标题
                text: '主标题',
                subtext: '副标题',
            },
            legend: {//设置图例
                type:'',//scroll设置为滚动图例,默认为plain
                orient: 'horizontal',//图例对齐方式为水平对齐,垂直对其:'vertical'
                data: []
            },
            tooltip: {//提示框组件
                trigger: 'axis',//设置提示框触发方式。'item',移动到数值上才会触发。'axis',移动到数值附近后自动提示并且有条贯穿数值的竖线
                formatter: "{a}<br/>{b}:{c}"//提示框显示内容
            },
            toolbox: {//工具箱
                feature: {
                    saveAsImage: {},//保存图片
                    restore: {},//配置还原
                    dataView: {},//数据视图
                    magicType: {//数据类型切换
                        type: ['line', 'bar', 'stack']
                    }

                }
            },
            xAxis: {
                type: 'category',
                data: ['Mon', 'Tue', 'Wed', 'Thu', 'Fri', 'Sat','Sun'],
            },
            yAxis: {
                type: 'value',
                scale:'ture'//缩放:脱离0值比例,以最小的数值作为最低值
            },
            series: [
                {

                    data: [70, 250, 120, 218, 135, 147, 260],
                    stack:'堆积',
                    type: 'line',
                    label:{show:'true'},//显示线条对应点的数值
                },
                {

                    data: [70, 250, 120, 218, 135, 147, 260],
                    type: 'line',
                    stack:'堆积',
                    label:{show:'true'},//显示线条对应点的数值
                },
                {

                    data: [70, 250, 120, 218, 135, 147, 260],
                    type: 'line',
                    stack:'堆积',
                    label:{show:'true'},//显示线条对应点的数值
                },
                {

                    data: [70, 250, 120, 218, 135, 147, 260],
                    type: 'line',
                    stack:'堆积',
                    label:{show:'true'},//显示线条对应点的数值
                },

            ]
        };
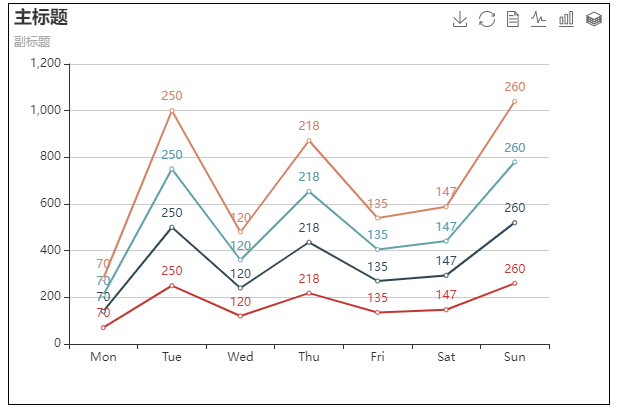
两者之间的区别在与series里面的areaStyle所在的代码把这个注释,堆积面积图就会变成堆积折线图
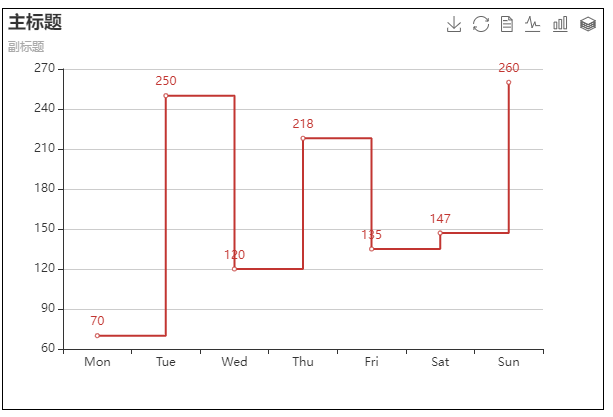
阶梯图
var option = {
            title: { //设置标题
                text: '主标题',
                subtext: '副标题',
            },
            legend: {//设置图例
                type:'',//scroll设置为滚动图例,默认为plain
                orient: 'horizontal',//图例对齐方式为水平对齐,垂直对其:'vertical'
                data: []
            },
            tooltip: {//提示框组件
                trigger: '',//设置提示框触发方式。'item',移动到数值上才会触发。'axis',移动到数值附近后自动提示并且有条贯穿数值的竖线
          formatter: "{a}<br/>{b}:{c}"//提示框显示内容
            },
            toolbox: {//工具箱
                feature: {
                    saveAsImage: {},//保存图片
                    restore: {},//配置还原
                    dataView: {},//数据视图
                    magicType: {//数据类型切换
                        type: ['line', 'bar', 'stack']
                    }

                }
            },
            xAxis: {
                type: 'category',
                data: ['Mon', 'Tue', 'Wed', 'Thu', 'Fri', 'Sat','Sun'],
            },
            yAxis: {
                type: 'value',
                scale:'ture'//缩放:脱离0值比例,以最小的数值作为最低值
            },
            series: [
                {
                    step:'end',//设置折线的样式,绘制阶梯图
                    data: [70, 250, 120, 218, 135, 147, 260],
                    type: 'line',
                    label:{show:'true'},//显示线条对应点的数值
                }
            ]
        };
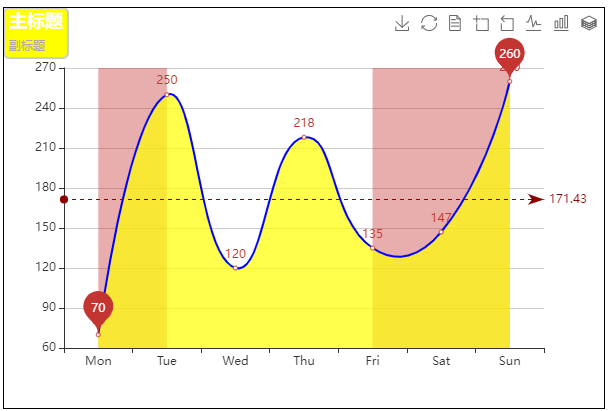
折线图所用配置
var option = {
            title: { //设置标题
                text: '主标题',
                subtext: '副标题',
                textStyle: {//设置主标题样式
                    color: '#fff',//设置字体颜色
                    fontStyle: 'normal',//设置文字字体'normal'、'italic'、'oblique'
                    fontWeight: 'bolder',//设置字体粗细'normal'、'bold'、'bolder'、'lighter'
                },
                itemGap:10,//设置主副标题间距
                borderWidth:2,//设置边框线框
                borderColor:'#ccc',//设置边的颜色
                borderRadius: 5, // 标题边框圆角
                backgroundColor:'yellow',//设置背景颜色
            },
            legend: {//设置图例
                type:'',//scroll设置为滚动图例,默认为plain
                orient: 'horizontal',//图例对齐方式为水平对齐,垂直对其:'vertical'
                data: []
            },
            tooltip: {//提示框组件
                trigger: '',//设置提示框触发方式。'item',移动到数值上才会触发。'axis',移动到数值附近后自动提示并且有条贯穿数值的竖线
          formatter: "{a}<br/>{b}:{c}"//提示框显示内容
            },
            toolbox: {//工具箱
                feature: {
                    saveAsImage: {},//保存图片
                    restore: {},//配置还原
                    dataView: {},//数据视图
                    dataZoom: {},//区域缩放
                    magicType: {//数据类型切换
                        type: ['line', 'bar', 'stack']
                    }

                }
            },
            xAxis: {
                type: 'category',
                data: ['Mon', 'Tue', 'Wed', 'Thu', 'Fri', 'Sat','Sun'],
                boundaryGap:{show:'ture'},//是否紧挨边缘
            },
            yAxis: {
                type: 'value',
                scale:'ture'//缩放:脱离0值比例,以最小的数值作为最低值
            },
            series: [
                {
                    //step:'end',//设置折线的样式,绘制阶梯图
                    data: [70, 250, 120, 218, 135, 147, 260],
                    type: 'line',
                    smooth: 'ture',   //线条设为平滑的
                    label:{show:'true'},//显示线条对应点的数值
                    stack:'总量',//用于设置堆积效果,当有两个折线图时两个图形都设置stack并且数值一样
                    lineStyle: {      //设置线条样式
                        color: 'blue',//线条颜色
                        width:2,      //线条宽度
                    },
                    areaStyle:{  //填充线条下方区域的颜色
                        color:'yellow'
                    },
                    markLine: {       //设置标记线
                        data: [
                            {
                                type: 'average', name: '平均值',
                                itemStyle: {       //设置标记线样式
                                    normal: { borderType: 'dotted', color: 'darkred' }//
                                }
                            }
                        ]
                    },
                    markPoint: {
                        data: [
                            { type: 'max', name: '最大值' }, { type: 'min', name: '最小值' }
                        ]
                    },
                    markArea: {    //标记区域形成柱状区间
                        data: [
                            [
                                {    //开始位置
                                    xAxis: 'Mon'
                                },
                                {    //结束位置
                                    xAxis: 'Tue',
                                }
                            ],
                            [
                                {   //开始位置
                                    xAxis: 'Fri',
                                },
                                {   //结束位置
                                    xAxis: 'Sun'
                                }
                            ]
                        ]
                    },

                }
            ]
        };

 浙公网安备 33010602011771号