

ELK安装笔记
1、jdk安装
2、logstash安装使用
#命令方式
[root@ELK ELK]# tar xf logstash-5.3.2.tar.gz
[root@ELK logstash-5.3.2]# ./logstash-5.3.2/bin/logstash -e "input{stdin{}}output{stdout{codec=>rubydebug}}"
Sending Logstash's logs to /root/src/ELK/logstash-5.3.2/logs which is now configured via log4j2.properties
[2017-05-09T21:45:46,608][INFO ][logstash.setting.writabledirectory] Creating directory {:setting=>"path.queue", :path=>"/root/src/ELK/logstash-5.3.2/data/queue"}
[2017-05-09T21:45:46,627][INFO ][logstash.agent           ] No persistent UUID file found. Generating new UUID {:uuid=>"b9addbdf-c719-42a9-aa6b-22a757ae0c61", :path=>"/root/src/ELK/logstash-5.3.2/data/uuid"}
[2017-05-09T21:45:46,793][INFO ][logstash.pipeline        ] Starting pipeline {"id"=>"main", "pipeline.workers"=>4, "pipeline.batch.size"=>125, "pipeline.batch.delay"=>5, "pipeline.max_inflight"=>500}
[2017-05-09T21:45:46,816][INFO ][logstash.pipeline        ] Pipeline main started
The stdin plugin is now waiting for input:
[2017-05-09T21:45:46,903][INFO ][logstash.agent           ] Successfully started Logstash API endpoint {:port=>9600}
hello world
{
    "@timestamp" => 2017-05-09T13:46:38.710Z,
      "@version" => "1",
          "host" => "ELK",
       "message" => "hello world"
}
#配置文件
[root@ELK ELK]# mkdir conf
[root@ELK ELK]# vim conf/test.conf
input {
stdin{}
}
output {
stdout {
codec => rubydebug{}
}
}
[root@ELK ELK]# ./logstash-5.3.2/bin/logstash -f conf/test.conf
Sending Logstash's logs to /root/src/ELK/logstash-5.3.2/logs which is now configured via log4j2.properties
[2017-05-09T21:59:31,733][INFO ][logstash.pipeline ] Starting pipeline {"id"=>"main", "pipeline.workers"=>4, "pipeline.batch.size"=>125, "pipeline.batch.delay"=>5, "pipeline.max_inflight"=>500}
[2017-05-09T21:59:31,778][INFO ][logstash.pipeline ] Pipeline main started
The stdin plugin is now waiting for input:
[2017-05-09T21:59:31,828][INFO ][logstash.agent ] Successfully started Logstash API endpoint {:port=>9600}
hello world
{
"@timestamp" => 2017-05-09T13:59:42.881Z,
"@version" => "1",
"host" => "ELK",
"message" => "hello world"
}
#后台运行
#======================================================
#方式1
nohup ./logstash-5.3.2/bin/logstash -f conf/test.conf &
tail -f nohup.out
#方式2
yum install -y screen
screen
./logstash-5.3.2/bin/logstash -f conf/test.conf
ctrl+A+D
screen -ls
screen -r pid
#方式3
通过supervisord管理
#file插件
[root@ELK ELK]# vim conf/test.conf
input {
file {
path => ["/usr/local/nginx/logs/access.log"]
type => "nginx"
start_position => "beginning" //beginning表示从文件开头读取,end表示从文件末尾读取
}
}
output {
stdout {
codec => rubydebug{}
}
}
[root@ELK ELK]# ./logstash-5.3.2/bin/logstash -f conf/test.conf
Sending Logstash's logs to /root/src/ELK/logstash-5.3.2/logs which is now configured via log4j2.properties
[2017-05-10T20:27:53,080][INFO ][logstash.pipeline ] Starting pipeline {"id"=>"main", "pipeline.workers"=>4, "pipeline.batch.size"=>125, "pipeline.batch.delay"=>5, "pipeline.max_inflight"=>500}
[2017-05-10T20:27:53,179][INFO ][logstash.pipeline ] Pipeline main started
[2017-05-10T20:27:53,226][INFO ][logstash.agent ] Successfully started Logstash API endpoint {:port=>9600}
{
"path" => "/usr/local/nginx/logs/access.log",
"@timestamp" => 2017-05-10T12:27:57.235Z,
"@version" => "1",
"host" => "ELK",
"message" => "192.168.1.22 - - [10/May/2017:20:27:57 +0800] \"GET / HTTP/1.1\" 304 0 \"-\" \"Mozilla/5.0 (Windows NT 10.0; WOW64; rv:53.0) Gecko/20100101 Firefox/53.0\"",
"type" => "nginx"
}
#多行插件
[root@ELK ELK]# vim conf/test.conf
input {
stdin {
codec => multiline {
pattern => "^\["
negate => true
what => "previous"
}
}
}
output {
stdout {
codec => rubydebug{}
}
}
[root@ELK ELK]# ./logstash-5.3.2/bin/logstash -f conf/test.conf
Sending Logstash's logs to /root/src/ELK/logstash-5.3.2/logs which is now configured via log4j2.properties
[2017-05-10T20:55:15,045][INFO ][logstash.pipeline ] Starting pipeline {"id"=>"main", "pipeline.workers"=>4, "pipeline.batch.size"=>125, "pipeline.batch.delay"=>5, "pipeline.max_inflight"=>500}
[2017-05-10T20:55:15,069][INFO ][logstash.pipeline ] Pipeline main started
The stdin plugin is now waiting for input:
[2017-05-10T20:55:15,126][INFO ][logstash.agent ] Successfully started Logstash API endpoint {:port=>9600}
[ hello world
[ hello logstash
{
"@timestamp" => 2017-05-10T12:55:45.068Z,
"@version" => "1",
"host" => "ELK",
"message" => "[ hello world"
}
hello nihao
end
[ stop
{
"@timestamp" => 2017-05-10T12:56:00.774Z,
"@version" => "1",
"host" => "ELK",
"message" => "[ hello logstash\nhello nihao\nend",
"tags" => [
[0] "multiline"
]
}
[test
{
"@timestamp" => 2017-05-10T12:56:05.070Z,
"@version" => "1",
"host" => "ELK",
"message" => "[ stop"
}
#grok & kv插件
官方提供的grok表达式
https://github.com/logstash-plugins/logstash-patterns-core/tree/master/patterns
grok在线调试
http://grokdebug.herokuapp.com/
配置文件示例:
![]()
直接调用grok表达式: %{IPV4:client} (%{USERNAME:ident}|-) (%{USERNAME:auth}|-) \[%{HTTPDATE:timestamp}\]


自定义正则:(?<client>\d{3}.\d{3}.\d{1}.\d{2})

kv {
source => "request" //要处理的字串
field_split => "&" //分隔符
value_split => "=" //键值对使用=对应
remove_field => [ "aw" ] //要删除的字段
}
#json & geoip插件
nginx 日志配置
log_format json '{ "@timestamp": "$time_local", '
'"@fields": { '
'"remote_addr": "$remote_addr", '
'"remote_user": "$remote_user", '
'"body_bytes_sent": "$body_bytes_sent", '
'"request_time": "$request_time", '
'"status": "$status", '
'"request": "$request", '
'"request_method": "$request_method", '
'"http_referrer": "$http_referer", '
'"body_bytes_sent":"$body_bytes_sent", '
'"http_x_forwarded_for": "$http_x_forwarded_for", '
'"http_user_agent": "$http_user_agent" } }';
access_log logs/access.log json;
logstash配置文件
input {
file {
path => ["/usr/local/nginx/logs/access.log"]
type => "nginx"
start_position => "end"
codec => json
}
}
filter {
geoip {
source => "client"
fields => ["ip","city_name","country_name","location"]
}
}
output {
stdout {
codec => rubydebug{}
}
}
#elasticsearch安装
[root@ELK ELK]# tar xf elasticsearch-5.3.2.tar.gz
[root@ELK ELK]# cd elasticsearch-5.3.2/
[root@ELK elasticsearch-5.3.2]# ./bin/elasticsearch
[2017-05-14T11:28:21,635][WARN ][o.e.b.ElasticsearchUncaughtExceptionHandler] [] uncaught exception in thread [main]
org.elasticsearch.bootstrap.StartupException: java.lang.RuntimeException: can not run elasticsearch as root
at org.elasticsearch.bootstrap.Elasticsearch.init(Elasticsearch.java:127) ~[elasticsearch-5.3.2.jar:5.3.2]
at org.elasticsearch.bootstrap.Elasticsearch.execute(Elasticsearch.java:114) ~[elasticsearch-5.3.2.jar:5.3.2]
at org.elasticsearch.cli.EnvironmentAwareCommand.execute(EnvironmentAwareCommand.java:58) ~[elasticsearch-5.3.2.jar:5.3.2]
at org.elasticsearch.cli.Command.mainWithoutErrorHandling(Command.java:122) ~[elasticsearch-5.3.2.jar:5.3.2]
at org.elasticsearch.cli.Command.main(Command.java:88) ~[elasticsearch-5.3.2.jar:5.3.2]
at org.elasticsearch.bootstrap.Elasticsearch.main(Elasticsearch.java:91) ~[elasticsearch-5.3.2.jar:5.3.2]
at org.elasticsearch.bootstrap.Elasticsearch.main(Elasticsearch.java:84) ~[elasticsearch-5.3.2.jar:5.3.2]
Caused by: java.lang.RuntimeException: can not run elasticsearch as root
at org.elasticsearch.bootstrap.Bootstrap.initializeNatives(Bootstrap.java:106) ~[elasticsearch-5.3.2.jar:5.3.2]
at org.elasticsearch.bootstrap.Bootstrap.setup(Bootstrap.java:204) ~[elasticsearch-5.3.2.jar:5.3.2]
at org.elasticsearch.bootstrap.Bootstrap.init(Bootstrap.java:360) ~[elasticsearch-5.3.2.jar:5.3.2]
at org.elasticsearch.bootstrap.Elasticsearch.init(Elasticsearch.java:123) ~[elasticsearch-5.3.2.jar:5.3.2]
... 6 more
[root@ELK elasticsearch-5.3.2]#cd ..
[root@ELK ELK]# useradd elk
[root@ELK ELK]# chown -R elk.elk elasticsearch-5.3.2
[root@ELK ELK]# su - elk
[elk@ELK ~]$ cd /ELK/elasticsearch-5.3.2
[elk@ELK elasticsearch-5.3.2]$ ./bin/elasticsearch
[2017-05-14T11:37:38,166][INFO ][o.e.n.Node ] [] initializing ...
[2017-05-14T11:37:39,905][INFO ][o.e.e.NodeEnvironment ] [eHbK7Fh] using [1] data paths, mounts [[/ (rootfs)]], net usable_space [32.1gb], net total_space [37.4gb], spins? [unknown], types [rootfs]
[2017-05-14T11:37:39,907][INFO ][o.e.e.NodeEnvironment ] [eHbK7Fh] heap size [1.9gb], compressed ordinary object pointers [true]
[2017-05-14T11:37:39,913][INFO ][o.e.n.Node ] node name [eHbK7Fh] derived from node ID [eHbK7FhJTPyu9_1GNbXzmA]; set [node.name] to override
[2017-05-14T11:37:39,918][INFO ][o.e.n.Node ] version[5.3.2], pid[7121], build[3068195/2017-04-24T16:15:59.481Z], OS[Linux/3.10.0-327.el7.x86_64/amd64], JVM[Oracle Corporation/Java HotSpot(TM) 64-Bit Server VM/1.8.0_131/25.131-b11]
[2017-05-14T11:37:52,245][INFO ][o.e.p.PluginsService ] [eHbK7Fh] loaded module [aggs-matrix-stats]
[2017-05-14T11:37:52,266][INFO ][o.e.p.PluginsService ] [eHbK7Fh] loaded module [ingest-common]
[2017-05-14T11:37:52,267][INFO ][o.e.p.PluginsService ] [eHbK7Fh] loaded module [lang-expression]
[2017-05-14T11:37:52,267][INFO ][o.e.p.PluginsService ] [eHbK7Fh] loaded module [lang-groovy]
[2017-05-14T11:37:52,267][INFO ][o.e.p.PluginsService ] [eHbK7Fh] loaded module [lang-mustache]
[2017-05-14T11:37:52,267][INFO ][o.e.p.PluginsService ] [eHbK7Fh] loaded module [lang-painless]
[2017-05-14T11:37:52,268][INFO ][o.e.p.PluginsService ] [eHbK7Fh] loaded module [percolator]
[2017-05-14T11:37:52,268][INFO ][o.e.p.PluginsService ] [eHbK7Fh] loaded module [reindex]
[2017-05-14T11:37:52,269][INFO ][o.e.p.PluginsService ] [eHbK7Fh] loaded module [transport-netty3]
[2017-05-14T11:37:52,269][INFO ][o.e.p.PluginsService ] [eHbK7Fh] loaded module [transport-netty4]
[2017-05-14T11:37:52,271][INFO ][o.e.p.PluginsService ] [eHbK7Fh] no plugins loaded
[2017-05-14T11:38:21,270][INFO ][o.e.n.Node ] initialized
[2017-05-14T11:38:21,272][INFO ][o.e.n.Node ] [eHbK7Fh] starting ...
[2017-05-14T11:38:23,936][INFO ][o.e.t.TransportService ] [eHbK7Fh] publish_address {127.0.0.1:9300}, bound_addresses {[::1]:9300}, {127.0.0.1:9300}
[2017-05-14T11:38:23,962][WARN ][o.e.b.BootstrapChecks ] [eHbK7Fh] max file descriptors [4096] for elasticsearch process is too low, increase to at least [65536]
[2017-05-14T11:38:23,962][WARN ][o.e.b.BootstrapChecks ] [eHbK7Fh] max virtual memory areas vm.max_map_count [65530] is too low, increase to at least [262144]
[2017-05-14T11:38:27,096][WARN ][o.e.m.j.JvmGcMonitorService] [eHbK7Fh] [gc][5] overhead, spent [582ms] collecting in the last [1s]
[2017-05-14T11:38:28,664][INFO ][o.e.c.s.ClusterService ] [eHbK7Fh] new_master {eHbK7Fh}{eHbK7FhJTPyu9_1GNbXzmA}{U5BQ8QlXSqarCAc4r4aU-A}{127.0.0.1}{127.0.0.1:9300}, reason: zen-disco-elected-as-master ([0] nodes joined)
[2017-05-14T11:38:29,539][INFO ][o.e.h.n.Netty4HttpServerTransport] [eHbK7Fh] publish_address {127.0.0.1:9200}, bound_addresses {[::1]:9200}, {127.0.0.1:9200}
[2017-05-14T11:38:29,556][INFO ][o.e.n.Node ] [eHbK7Fh] started
[2017-05-14T11:38:29,706][INFO ][o.e.g.GatewayService ] [eHbK7Fh] recovered [0] indices into cluster_state
[root@ELK ELK]# netstat -anpt
Active Internet connections (servers and established)
Proto Recv-Q Send-Q Local Address Foreign Address State PID/Program name
tcp 0 0 0.0.0.0:80 0.0.0.0:* LISTEN 5329/nginx: master
tcp 0 0 192.168.122.1:53 0.0.0.0:* LISTEN 2502/dnsmasq
tcp 0 0 0.0.0.0:22 0.0.0.0:* LISTEN 1224/sshd
tcp 0 0 127.0.0.1:631 0.0.0.0:* LISTEN 1227/cupsd
tcp 0 0 127.0.0.1:25 0.0.0.0:* LISTEN 2383/master
tcp 0 0 192.168.1.111:22 192.168.1.22:55363 ESTABLISHED 4739/sshd: root@pts
tcp 0 0 192.168.1.111:22 192.168.1.22:55300 ESTABLISHED 4605/sshd: root@pts
tcp 0 0 192.168.1.111:22 192.168.1.22:50543 ESTABLISHED 2962/sshd: root@pts
tcp6 0 0 127.0.0.1:9200 :::* LISTEN 7121/java
tcp6 0 0 ::1:9200 :::* LISTEN 7121/java
tcp6 0 0 127.0.0.1:9300 :::* LISTEN 7121/java
tcp6 0 0 ::1:9300 :::* LISTEN 7121/java
tcp6 0 0 :::22 :::* LISTEN 1224/sshd
tcp6 0 0 ::1:631 :::* LISTEN 1227/cupsd
#kibana安装
[root@ELK ELK]# tar xf kibana-5.3.2-linux-x86_64.tar.gz
[root@ELK ELK]# cd kibana-5.3.2-linux-x86_64/
[root@ELK kibana-5.3.2-linux-x86_64]# ./bin/kibana
log [03:42:22.544] [info][status][plugin:kibana@5.3.2] Status changed from uninitialized to green - Ready
log [03:42:22.757] [info][status][plugin:elasticsearch@5.3.2] Status changed from uninitialized to yellow - Waiting for Elasticsearch
log [03:42:22.778] [info][status][plugin:console@5.3.2] Status changed from uninitialized to green - Ready
log [03:42:23.999] [info][status][plugin:timelion@5.3.2] Status changed from uninitialized to green - Ready
log [03:42:24.058] [info][listening] Server running at http://localhost:5601
log [03:42:24.061] [info][status][ui settings] Status changed from uninitialized to yellow - Elasticsearch plugin is yellow
log [03:42:30.414] [info][status][plugin:elasticsearch@5.3.2] Status changed from yellow to yellow - No existing Kibana index found
log [03:42:32.770] [info][status][plugin:elasticsearch@5.3.2] Status changed from yellow to green - Kibana index ready
log [03:42:32.771] [info][status][ui settings] Status changed from yellow to green - Ready
#elk组合配置
elasticsearch
[root@ELK elasticsearch-5.3.2]# vim config/elasticsearch.yml
network.host: 192.168.1.111
logstash
[root@ELK ELK]# vim conf/test.conf
input {
file {
path => ["/usr/local/nginx/logs/access.log"]
type => "nginx"
start_position => "end"
codec => json
}
}
filter {
geoip {
source => "remote_addr"
#fields => ["ip","city_name","country_name","location"]
}
}
output {
#stdout {
# codec => rubydebug{}
#}
elasticsearch {
hosts => ["192.168.1.111:9200"]
index => "logstash-%{+YYYY.MM.dd}"
}
}
kibana
[root@ELK kibana-5.3.2-linux-x86_64]# vim config/kibana.yml
server.host: "192.168.1.111"
elasticsearch.url: "http://192.168.1.111:9200"
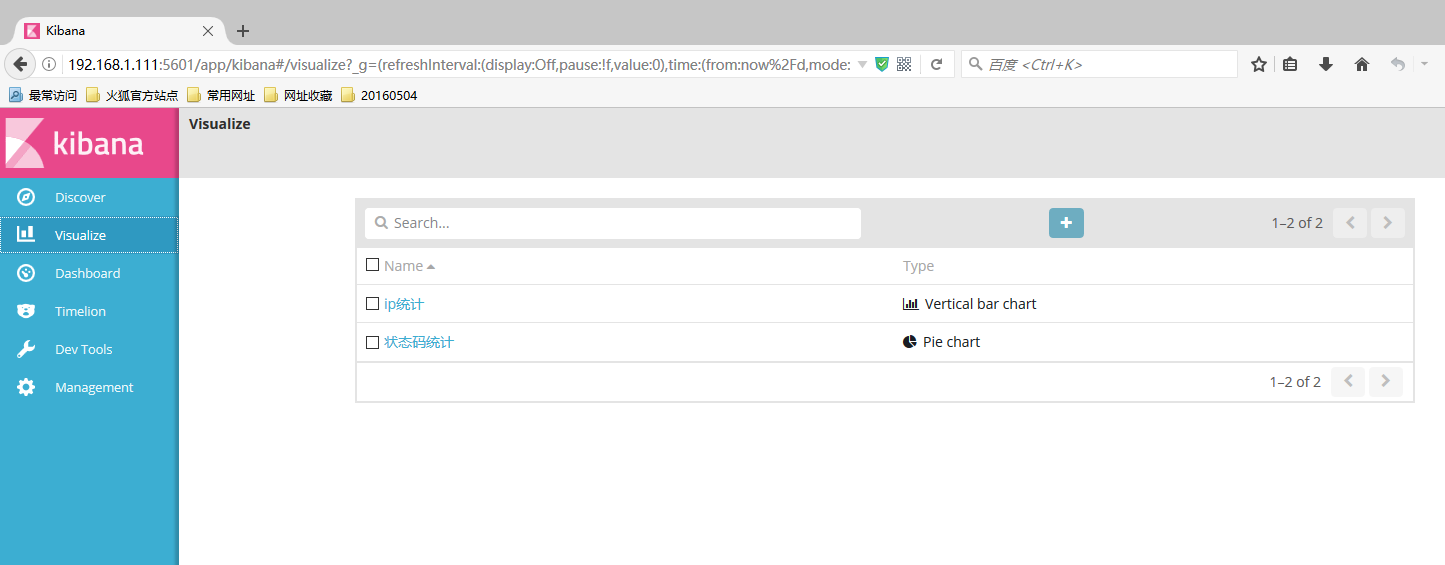
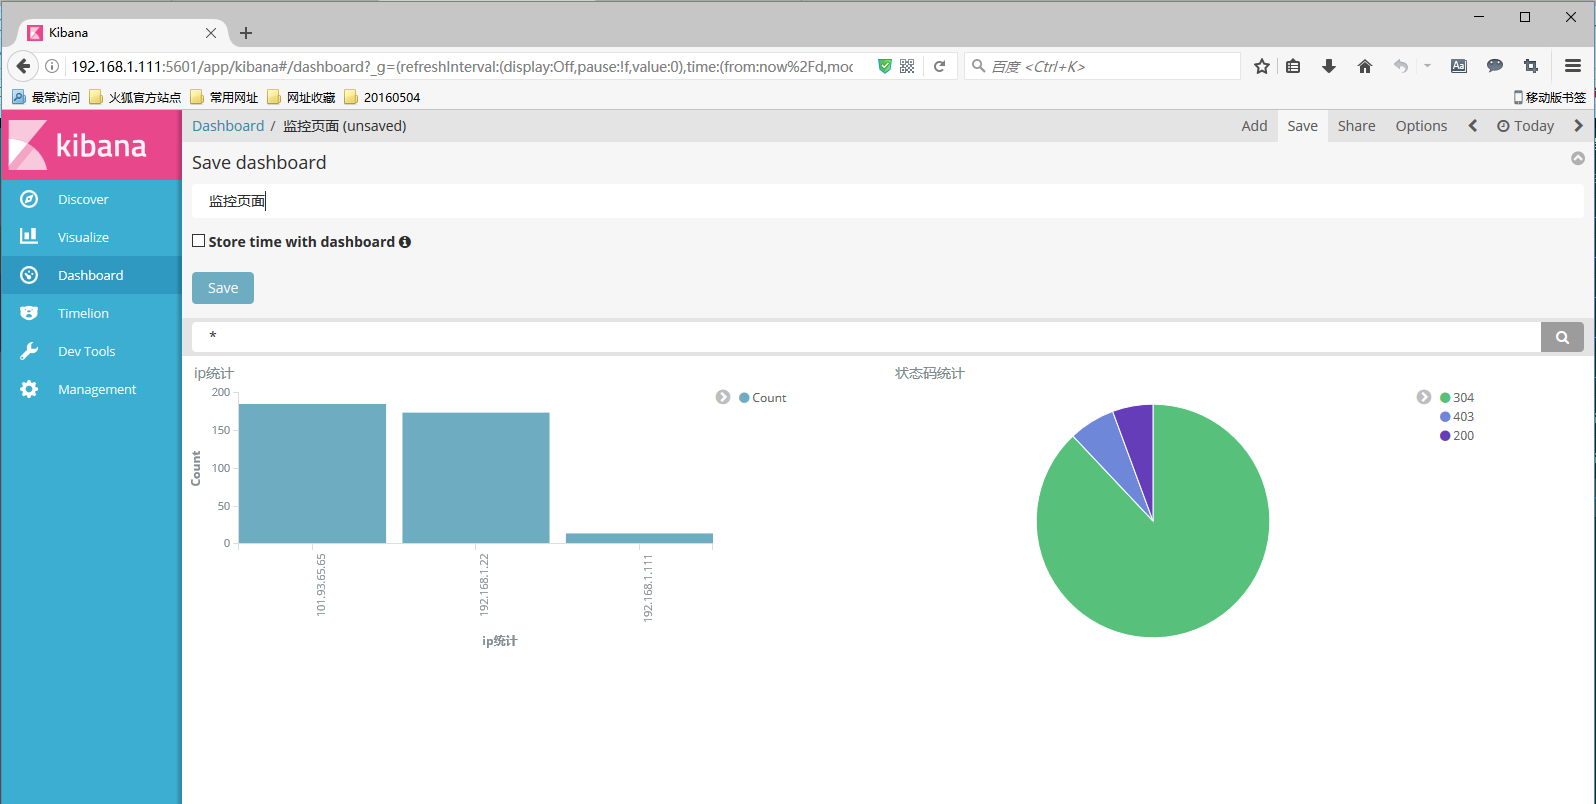
ip排名前5图表


状态码统计


统计响应时间
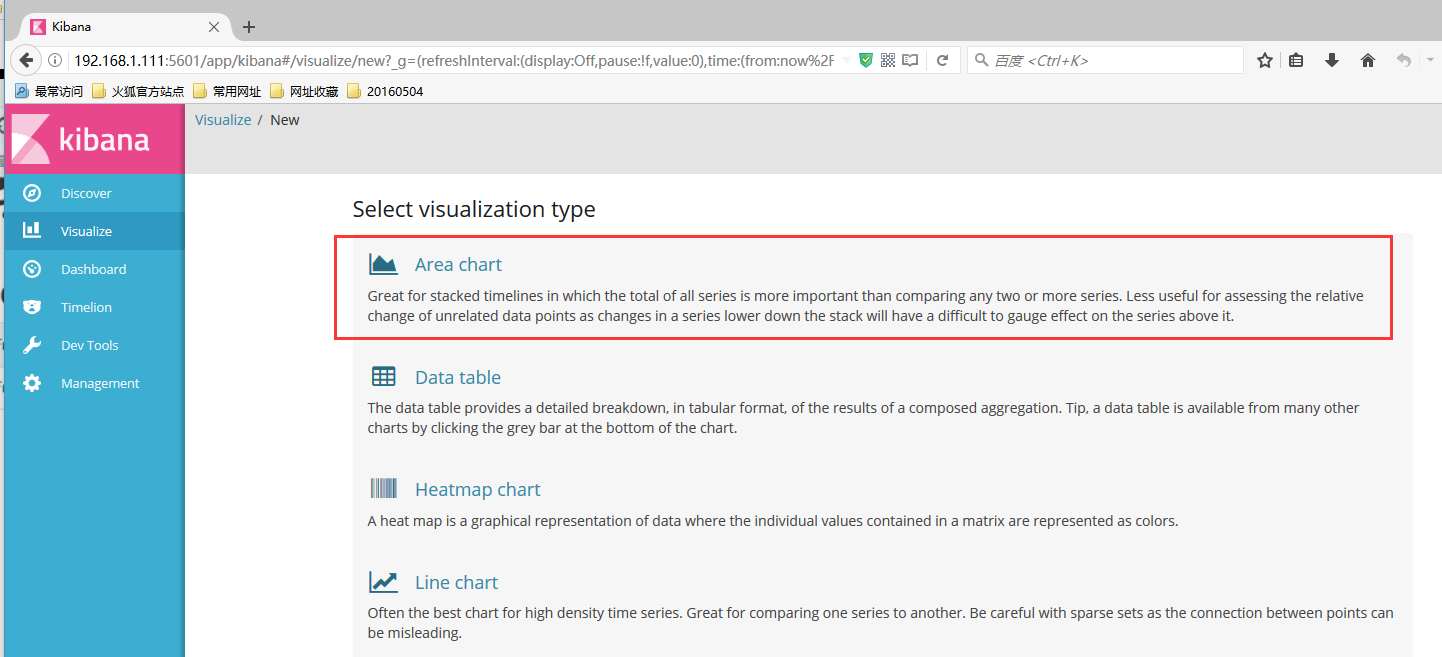

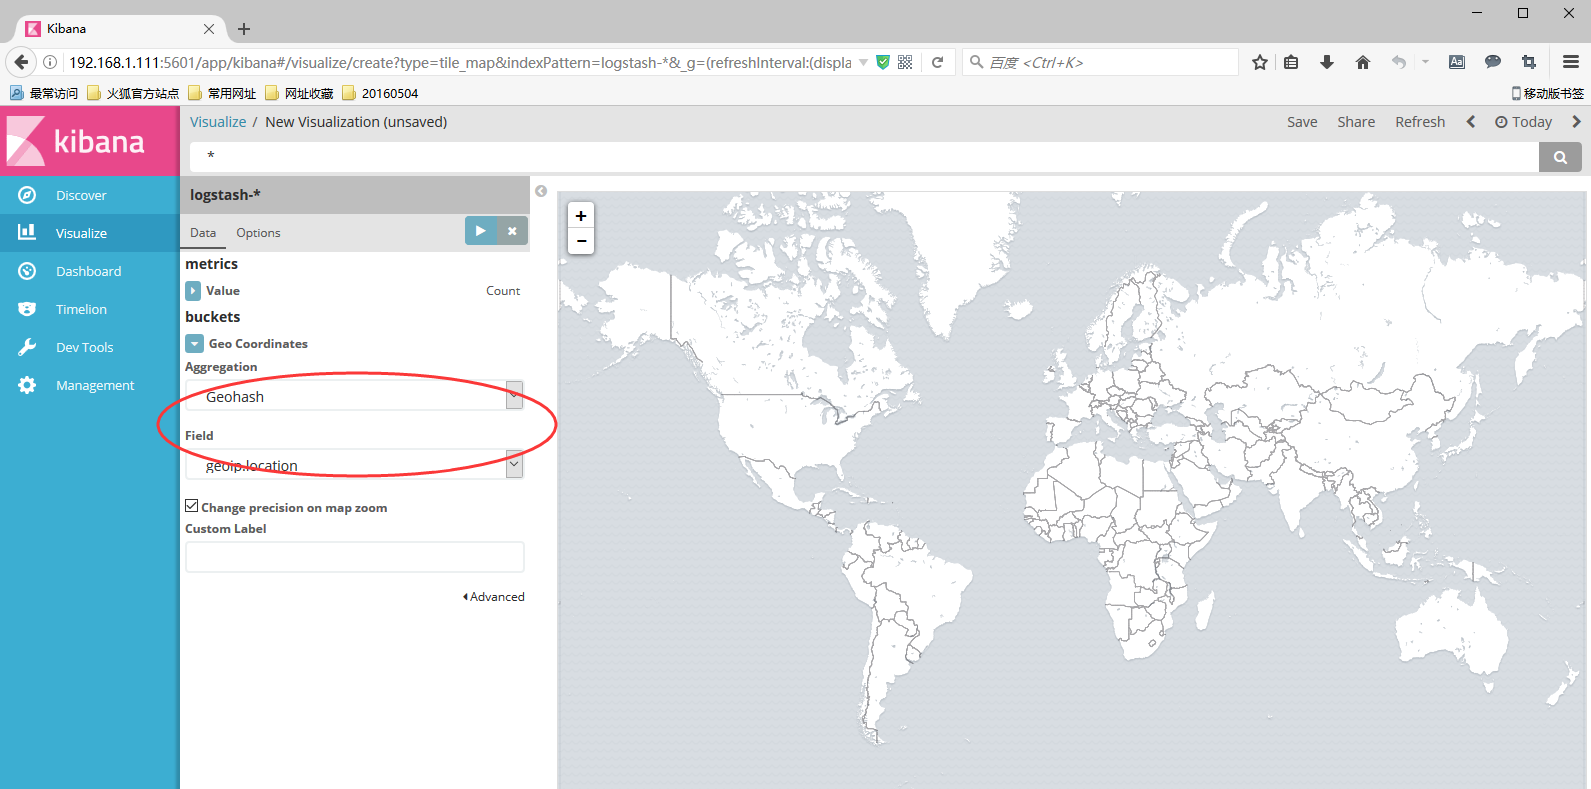
地图

仪表盘

 浙公网安备 33010602011771号