

一、介绍
Prometheus是最初在SoundCloud上构建的开源系统监视和警报工具包 。
- Prometheus的体系结构及其某些生态系统组件:

二、安装 Prometheus server
下载:https://prometheus.io/download/
1.执行下面的命令下载并解压:
$ wget https://github.com/prometheus/prometheus/releases/download/v2.22.0/prometheus-2.22.0.linux-amd64.tar.gz

$ tar xvfz prometheus-2.22.0.linux-amd64.tar.gz
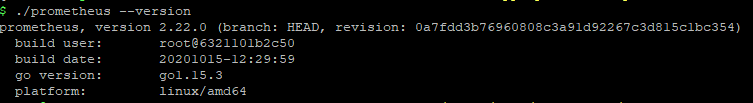
2.然后切换到解压目录,检查 Prometheus 版本:
$ cd prometheus-2.22.0.linux-amd64

$ ./prometheus --version
3.运行 Prometheus server:
nohup ./prometheus --config.file=prometheus.yml >/dev/log 2>&1 &
4.配置
Prometheus 有一个配置文件,通过参数 --config.file 来指定,配置文件格式为 YAML。
Prometheus 默认的配置文件分为四大块:
global 块:Prometheus 的全局配置,比如 scrape_interval 表示 Prometheus 多久抓取一次数据,evaluation_interval 表示多久检测一次告警规则;
alerting 块: Alertmanager 的配置;
rule_files 块:告警规则;
scrape_config 块:这里定义了 Prometheus 要抓取的目标,我们可以看到默认已经配置了一个名称为 prometheus 的 job,这是因为 Prometheus 在启动的时候也会通过 HTTP 接口暴露自身的指标数据,这就相当于 Prometheus 自己监控自己,虽然这在真正使用 Prometheus 时没啥用处,但是我们可以通过这个例子来学习如何使用 Prometheus;可以访问 http://localhost:9090/metrics 查看 Prometheus 暴露了哪些指标;
三、学习 PromQL
Prometheus 提供的一种特殊表达式来查询监控数据,这个表达式被称为 PromQL(Prometheus Query Language)。通过 PromQL 不仅可以在 Graph 页面查询数据,而且还可以通过 Prometheus 提供的 HTTP API 来查询。查询的监控数据有列表和曲线图两种展现形式。
1 数据模型
Prometheus 的数据模型,由一条 Prometheus 数据由一个指标名称(metric)和 N 个标签(label,N >= 0)组成的,比如下面这个例子:
promhttp_metric_handler_requests_total{code="200",instance="192.168.0.107:9090",job="prometheus"} 106
这条数据的指标名称为 promhttp_metric_handler_requests_total,并且包含三个标签 code、instance 和 job,这条记录的值为 106。Prometheus 是一个时序数据库,相同指标相同标签的数据构成一条时间序列。如果以传统数据库的概念来理解时序数据库,可以把指标名当作表名,标签是字段,timestamp 是主键,还有一个 float64 类型的字段表示值(Prometheus 里面所有值都是按 float64 存储)。
虽然 Prometheus 里存储的数据都是 float64 的一个数值,但如果我们按类型来分,可以把 Prometheus 的数据分成四大类:
Counter 用于计数,例如:请求次数、任务完成数、错误发生次数,这个值会一直增加,不会减少。
Gauge 就是一般的数值,可大可小,例如:温度变化、内存使用变化。
Histogram 是直方图,或称为柱状图,常用于跟踪事件发生的规模,例如:请求耗时、响应大小。它特别之处是可以对记录的内容进行分组,提供 count 和 sum 的功能。Summary 和 Histogram 十分相似,也用于跟踪事件发生的规模,不同之处是,它提供了一个 quantiles 的功能,可以按百分比划分跟踪的结果。例如:quantile 取值 0.95,表示取采样值里面的 95% 数据。
2.选择器
(1)Instant vector selectors(即时向量选择器)
即时矢量选择器允许在给定的时间戳(即时)上选择一组时间序列和每个样本的单个采样值:以最简单的形式,仅指定度量名称。这将导致一个即时向量,其中包含具有该度量名称的所有时间序列的元素
本示例选择所有具有http_requests_total度量标准名称的时间序列:
http_requests_total
通过在花括号({})中添加逗号分隔的标签匹配器列表,可以进一步过滤这些时间序列。
本示例仅选择那些具有http_requests_total 度量标准名称的时间序列,同时将其job标签设置为,prometheus并将其 group标签设置为canary:

http_requests_total{job="prometheus",group="canary"}
也可以否定地匹配标签值,或将标签值与正则表达式匹配。存在以下标签匹配运算符:
=:选择与提供的字符串完全相同的标签。
!=:选择不等于提供的字符串的标签。
=~:选择与提供的字符串进行正则表达式匹配的标签。
!~:选择与提供的字符串不进行正则表达式匹配的标签。
(2)Range vector selectors,范围向量选择器
范围向量文字的工作方式与即时向量文字相同,不同之处在于它们从当前即时中选择了一系列样本。语法上,将持续时间附加在[]向量选择器末尾的方括号()中,以指定应为每个结果范围向量元素提取多远的时间值。
在此示例中,我们选择所有时间序列在过去5分钟内记录的所有值,这些时间序列的度量标准名称http_requests_total和job标签设置为prometheus:
http_requests_total{job="prometheus"}[5m]
四、安装 Grafana
1、从官网上下载对应操作系统的安装包,服务是是centos的
wget https://dl.grafana.com/oss/release/grafana-7.2.2.linux-amd64.tar.gz
2、解压安装包
tar -zxvf grafana-7.2.2.linux-amd64.tar.gz
3、解压后文件夹改名
mv grafana-7.2.2 grafana
4、添加启动服务
./grafana/bin/grafana-server -homepath ./grafana
5、验证,进入浏览器输入:IP地址:3000
五、使用 Exporter 收集指标
Prometheus 是使用 Pull 的方式来获取指标数据的,要让 Prometheus 从目标处获得数据,首先必须在目标上安装指标收集的程序,并暴露出 HTTP 接口供 Prometheus 查询,这个指标收集程序被称为 Exporter,不同的指标需要不同的 Exporter 来收集,
收集服务器指标
node_exporter这个 exporter 用于收集 *NIX 内核的系统,如果你的服务器是 Windows,可以使用 WMI exporter。
$ wget https://github.com/prometheus/node_exporter/releases/download/v1.0.1/node_exporter-1.0.1.linux-amd64.tar.gz
$ tar node_exporter-1.0.1.linux-amd64.tar.gz
$ cd node_exporter-1.0.1.linux-amd64
$ ./node_exporter
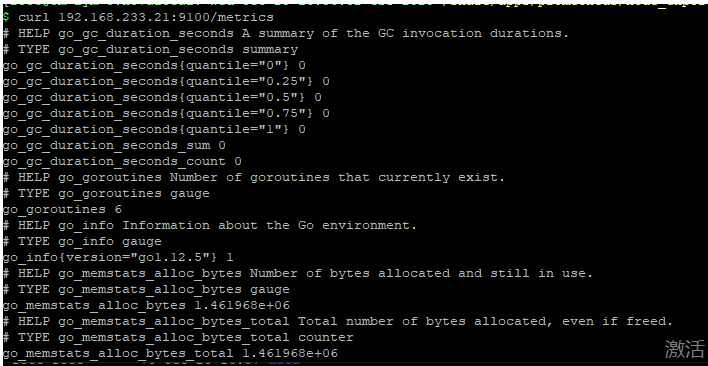
node_exporter 启动之后,我们访问下 /metrics 接口看看是否能正常获取服务器指标:
$ curl http://localhost:9100/metrics
修改 Prometheus 的配置文件,将服务器加到 scrape_configs 中:
scrape_configs:
  - job_name: 'prometheus'
    static_configs:
      - targets: ['localhost:9090']
  - job_name: 'server'
    static_configs:
      - targets: ['192.168.222.22:9100']
修改配置后,需要重启 Prometheus 服务,或者发送 HUP 信号也可以让 Prometheus 重新加载配置:
$ killall -HUP prometheus
在 Prometheus Web UI 的 Status -> Targets 中,可以看到新加的服务器:

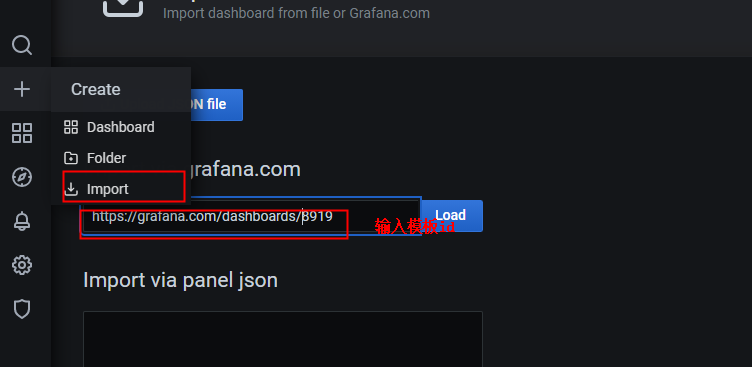
如果想在 Grafana 中查看服务器的指标,可以在 Grafana 的 Dashboards 页面 搜索 node exporter,有很多的面板模板可以直接使用
打开 Grafana 的 Import dashboard 页面,输入面板的 URL(https://grafana.com/dashboards/8919)或者 ID(8919)即可
六、告警和通知
Prometheus 的告警功能被分成两部分:一个是告警规则的配置和检测,并将告警发送给 Alertmanager,另一个是 Alertmanager,它负责管理这些告警,去除重复数据,分组,并路由到对应的接收方式,发出报警。常见的接收方式有:Email、PagerDuty、HipChat、Slack、OpsGenie、WebHook 等。
1.配置告警规则
- 先在 rule_files 块中添加一个告警规则文件:
rule_files:
  - "alert.rules"
2.参考官方文档,创建一个告警文件
vi alert.rules:
groups:
- name: example
  rules:

  # Alert for any instance that is unreachable for >5 minutes.
  - alert: InstanceDown
    expr: up == 0
    for: 5m
    labels:
      severity: page
    annotations:
      summary: "Instance {{ $labels.instance }} down"
      description: "{{ $labels.instance }} of job {{ $labels.job }} has been down for more than 5 minutes."

  # Alert for any instance that has a median request latency >1s.
  - alert: APIHighRequestLatency
    expr: api_http_request_latencies_second{quantile="0.5"} > 1
    for: 10m
    annotations:
      summary: "High request latency on {{ $labels.instance }}"
      description: "{{ $labels.instance }} has a median request latency above 1s (current value: {{ $value }}s)"
2.使用 Alertmanager 发送告警通知
- 下载并安装 Alertmanager
$ wget https://github.com/prometheus/alertmanager/releases/download/v0.21.0/alertmanager-0.21.0.linux-amd64.tar.gz
$ tar xvfz alertmanager-0.21.0.linux-amd64.tar.gz
$ cd alertmanager-0.21.0.linux-amd64
$ ./alertmanager

nohup ./alertmanager >/dev/null 2>&1 &
- Prometheus 的配置文件 prometheus.yml,添加下面几行:
alerting:
  alertmanagers:
  - scheme: http
    static_configs:
    - targets:
      - "192.168.222.21=2:9093"
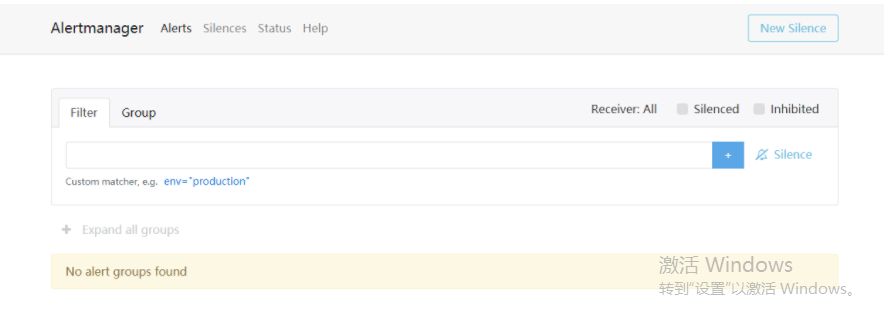
这个配置告诉 Prometheus,当发生告警时,将告警信息发送到 Alertmanager,Alertmanager 的地址为 http://192.168.233.21:9093。也可以使用命名行的方式指定 Alertmanager:
$ ./prometheus -alertmanager.url=http://192.168.222.22:9093
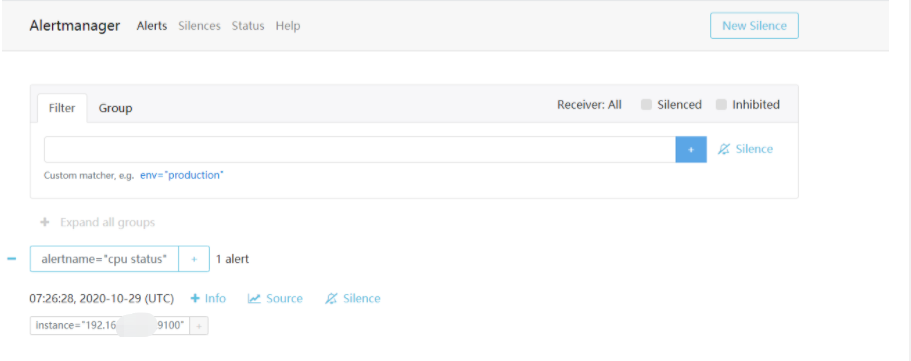
这个时候再访问 Alertmanager,可以看到 Alertmanager 已经接收到告警了:
使用Alertmanager 发告警信息发送给我们,我们打开默认的配置文件 alertmanager.yml
global:
  resolve_timeout: 5m

route:
  group_by: ['alertname']
  group_wait: 10s
  group_interval: 10s
  repeat_interval: 1h
  receiver: 'web.hook'
receivers:
- name: 'web.hook'
  webhook_configs:
  - url: 'http://127.0.0.1:5001/'
inhibit_rules:
  - source_match:
      severity: 'critical'
    target_match:
      severity: 'warning'
    equal: ['alertname', 'dev', 'instance']
参考 官方的配置手册 了解各个配置项的功能,其中 global 块表示一些全局配置;route 块表示通知路由,可以根据不同的标签将告警通知发送给不同的 receiver,这里没有配置 routes 项,表示所有的告警都发送给下面定义的 web.hook 这个 receiver
(1)邮箱告警
打开alertmanager配置文件 alertmanager.yml
global:
  resolve_timeout: 5m
  smtp_from: '11111111@qq.com'
  smtp_smarthost: 'smtp.qq.com:465'
  smtp_auth_username: '11111111@qq.com'
  smtp_auth_password: '授权码'
  smtp_require_tls: false
  smtp_hello: 'qq.com'
route:
  group_by: ['alertname']
  group_wait: 5s
  group_interval: 5s
  repeat_interval: 5m
  receiver: 'email'
receivers:
- name: 'email'
  email_configs:
  - to: '11111111@qq.com'
    send_resolved: true
inhibit_rules:
  - source_match:
      severity: 'critical'
    target_match:
      severity: 'warning'
    equal: ['alertname', 'dev', 'instance']
(2)钉钉告警
使用钉钉告警的话,还需要钉钉插件支持,所以我们先来安装一下插件,我们直接下载二进制包。启动的默认端口为8060。
下载地址:https://github.com/timonwong/prometheus-webhook-dingtalk/releases/
wget https://github.com/timonwong/prometheus-webhook-dingtalk/releases/download/v1.4.0/prometheus-webhook-dingtalk-1.4.0.linux-amd64.tar.gz

tar -xvf prometheus-webhook-dingtalk-1.4.0.linux-amd64.tar.gz
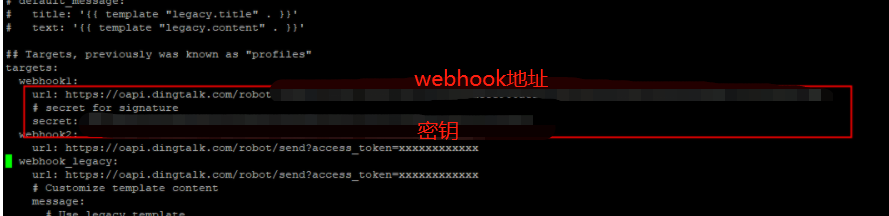
配置config.yml
后台启动:
nohup ./prometheus-webhook-dingtalk --config.file=./config.yml >/dev/null2>&1 &
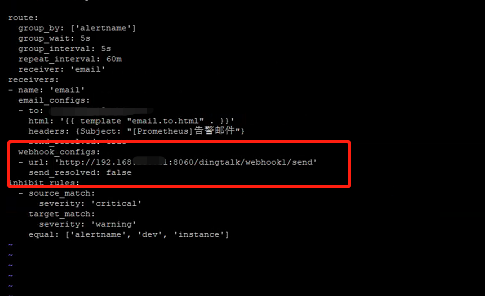
打开alertmanager配置文件 alertmanager.yml增加内容
webhook_configs:
  - url: 'http://192.168.222.22:8060/dingtalk/webhook1/send'
    send_resolved: false

 浙公网安备 33010602011771号