Linux 查看进程消耗内存情况总结
在Linux中,有很多命令或工具用来查看内存使用情况,今天我们来简单讨论一下如何查看进程消耗、占用的内存情况,Linux的内存管理和相关概念要比Windows复杂一些。在此之前,我们需要了解一下Linux系统下面有关内存的专用名词和专业术语概念:
物理内存和虚拟内存
物理内存:就是系统硬件提供的内存大小,是真正的内存,一般叫做内存条。也叫随机存取存储器(random access memory,RAM)又称作“随机存储器”,是与CPU直接交换数据的内部存储器,也叫主存(内存)。
虚拟内存:相对于物理内存,在Linux下还有一个虚拟内存的概念,虚拟内存就是为了满足物理内存的不足而提出的策略,它是利用磁盘空间虚拟出的一块逻辑内存,用作虚拟内存的磁盘空间被称为交换空间(Swap Space)。Linux会在物理内存不足时,使用虚拟内存,内核会把暂时不用的内存块信息写到虚拟内存,这样物理内存就得到了释放,这块儿内存就可以用于其他目的,而需要用到这些内容的时候,这些信息就会被重新从虚拟内存读入物理内存。
Linux的buffers与cached
在Linux系统中经常发现空闲的内存很少,似乎所有的内存都被消耗殆尽了,表面上看是内存不够用了,很多新手看到内存被“消耗殆尽”非常紧张,其实这个是因为Linux系统将空闲的内存用来做磁盘文件数据的缓存。这个导致你的系统看起来处于内存非常紧急的状况。但是实际上不是这样。这个区别于Windows的内存管理。Linux会利用空闲的内存来做cached & buffers。
buffers是指用来给块设备做的缓冲大小(块设备的读写缓冲区),它只记录文件系统的metadata以及 tracking in-flight pages.
cached是作为page cache的内存, 文件系统的cache。你读写文件的时候,Linux内核为了提高读写性能与速度,会将文件在内存中进行缓存,这部分内存就是Cache Memory(缓存内存)。即使你的程序运行结束后,Cache Memory也不会自动释放。这就会导致你在Linux系统中程序频繁读写文件后,你会发现可用物理内存会很少。其实缓存内存(Cache Memory)在你需要使用内存的时候会自动释放,所以你不必担心没有内存可用
Linux共享内存
共享内存是进程间通信中最简单的方式之一。共享内存允许两个或更多进程访问同一块内存,就如同 malloc() 函数向不同进程返回了指向同一个物理内存区域的指针。当一个进程改变了这块地址中的内容的时候,其它进程都会察觉到这个。其实所谓共享内存,就是多个进程间共同地使用同一段物理内存空间,它是通过将同一段物理内存映射到不同进程的虚拟空间来实现的。由于映射到不同进程的虚拟空间中,不同进程可以直接使用,不需要像消息队列那样进行复制,所以共享内存的效率很高。共享内存可以通过mmap()映射普通文件机制来实现,也可以System V共享内存机制来实现,System V是通过映射特殊文件系统shm中的文件实现进程间的共享内存通信,也就是说每个共享内存区域对应特殊文件系统shm中的一个文件。
另外,我们还必须了解RSS、PSS、USS等相关概念:
VSS – Virtual SetSize 虚拟耗用内存(包含共享库占用的内存) RSS – Resident SetSize 实际使用物理内存(包含共享库占用的内存) PSS – Proportional SetSize 实际使用的物理内存(比例分配共享库占用的内存) USS – UniqueSetSize 进程独自占用的物理内存(不包含共享库占用的内存)
RSS(Resident set size),使用top命令可以查询到,是最常用的内存指标,表示进程占用的物理内存大小。但是,将各进程的RSS值相加,通常会超出整个系统的内存消耗,这是因为RSS中包含了各进程间共享的内存。
PSS(Proportional set size)所有使用某共享库的程序均分该共享库占用的内存时,每个进程占用的内存。显然所有进程的PSS之和就是系统的内存使用量。它会更准确一些,它将共享内存的大小进行平均后,再分摊到各进程上去。
USS(Unique set size )进程独自占用的内存,它是PSS中自己的部分,它只计算了进程独自占用的内存大小,不包含任何共享的部分。
所以下面介绍的命令,有些查看进程的虚拟内存使用,有些是查看进程的RSS或实际物理内存。在讲述的时候,我们会标注这些信息。
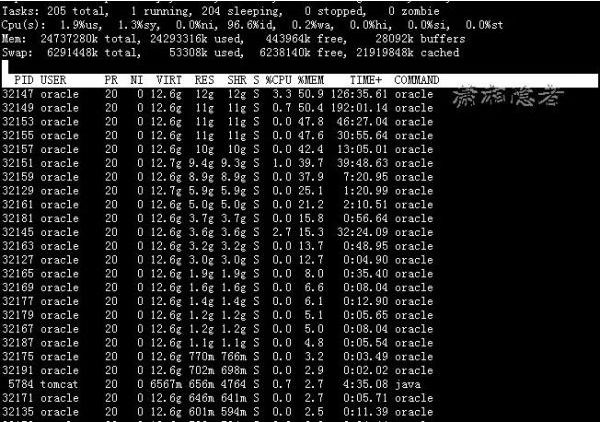
top命令查看
执行top命令后,执行SHIFT +F ,可以选择按某列排序,例如选择n后,就会按字段%MEM排序

当然也可以使用shift+m 或大写键M 让top命令按字段%MEM来排序,当然你也可以按VIRT(虚拟内存)、SWAP(进程使用的SWAP空间)、RES(实际使用物理内存,当然这里由于涉及共享内存缘故,你看到的实际内存非常大)
%MEM -- Memory usage (RES) A task's currently used share of available physical memory VIRT -- virtual memory The total amount of virtual memory used by the task. It includes all code, data and shared libraries plus pages that have been swapped out. (Note: you can define the STATSIZE=1 environment variable and the VIRT will be calculated from the /proc/#/state VmSize field.) VIRT = SWAP + RES SWAP -- Swapped size (kb) The swapped out portion of a task’s total virtual memory image. RES -- Resident size (kb) RES = CODE + DATA.
是否有人会觉得奇怪,为什么%MEM这一列的值加起来会大于100呢?这个是因为这里计算的时候包含了共享内存的缘故,另外由于共享内存的缘故,你看到进程使用VIRT或RES都非常高。由于大部分的物理内存通常在多个应用程序之间共享,名为实际使用物理内存(RSS,对应top命令里面的RES)的这个标准的内存耗用衡量指标会大大高估内存耗用情况。
ps命令查看
使用ps命令找出占用内存资源最多的20个进程(数量可以任意设置)
# ps aux | head -1;ps aux |grep -v PID |sort -rn -k +4 | head -20
USER       PID %CPU %MEM    VSZ   RSS TTY      STAT START   TIME COMMAND oracle   32147 11.0 51.2 13252080 12666320 ?   Rs   Aug24 163:16 ora_s000_SCM2 oracle   32149 14.2 50.9 13250344 12594264 ?   Ss   Aug24 210:41 ora_s001_SCM2 oracle   32153  4.2 49.6 13250820 12279432 ?   Ss   Aug24  62:27 ora_s003_SCM2 oracle   32155  2.5 48.6 13250268 12040732 ?   Ss   Aug24  38:21 ora_s004_SCM2 oracle   32157  1.2 44.5 13250296 11011708 ?   Ss   Aug24  18:31 ora_s005_SCM2 oracle   32151  2.7 39.7 13350436 9829944 ?    Ss   Aug24  41:18 ora_s002_SCM2 oracle   32159  0.5 38.9 13250704 9625764 ?    Ss   Aug24   8:18 ora_s006_SCM2 oracle   32161  0.2 26.3 13250668 6507244 ?    Ss   Aug24   3:38 ora_s007_SCM2 oracle   32129  0.0 25.5 13299084 6324644 ?    Ss   Aug24   1:25 ora_dbw0_SCM2 oracle   32181  0.0 15.8 13250152 3913260 ?    Ss   Aug24   0:56 ora_s017_SCM2 oracle   32145  2.7 15.3 13255256 3786456 ?    Ss   Aug24  40:11 ora_d000_SCM2 oracle   32127  0.0 15.2 13248996 3762860 ?    Ss   Aug24   0:05 ora_mman_SCM2 oracle   32163  0.0 14.2 13250108 3525160 ?    Ss   Aug24   1:04 ora_s008_SCM2 oracle   32165  0.0  8.1 13250172 2007704 ?    Ss   Aug24   0:37 ora_s009_SCM2 oracle   32169  0.0  6.6 13250060 1656864 ?    Ss   Aug24   0:08 ora_s011_SCM2 oracle   32177  0.0  6.0 13250148 1498760 ?    Ss   Aug24   0:12 ora_s015_SCM2 oracle   32187  0.0  5.1 13250084 1267384 ?    Ss   Aug24   0:06 ora_s020_SCM2 oracle   32179  0.0  5.1 13250584 1280156 ?    Ss   Aug24   0:05 ora_s016_SCM2 oracle   32167  0.0  5.0 13250060 1248668 ?    Ss   Aug24   0:08 ora_s010_SCM2 oracle   32175  0.0  3.4 13250596 857380 ?     Ss   Aug24   0:03 ora_s014_SCM2

#ps -eo pmem,pcpu,rss,vsize,args | sort -k 1 -n -r | less
查看进程占用的实际物理内存(与smem看到实际物理内存大小有出入,这里解释一下:SIZE: 进程使用的地址空间, 如果进程映射了100M的内存, 进程的地址空间将报告为100M内存. 事实上, 这个大小不是一个程序实际使用的内存数. 所以这里看到的内存跟smem看到的大小有出入)
ps -eo size,pid,user,command --sort -size | awk '{ hr=$1/1024 ; printf("%13.2f Mb ",hr) } { for ( x=4 ; x
这个不全 ,下面是全的,好用啊
ps -eo size,pid,user,command --sort -size | \
    awk '{ hr=$1/1024 ; printf("%13.2f Mb ",hr) } { for ( x=4 ; x<=NF ; x++ ) { printf("%s ",$x) } print "" }' |\
    cut -d "" -f2 | cut -d "-" -f1

ps -eo size,pid,user,command --sort -size | awk '{ hr=$1/1024 ; printf("%13.2f Mb ",hr) } { for ( x=4 ; x<=NF ; x++ ) { printf("%s ",$x) } print "" }' | awk '{total=total + $1} END {print total}'

ps aux --sort pmem
It sorts the output by %MEM.
ps aux | awk '{print $2, $4, $11}' | sort -k2r | head -n 15
It sorts using pipes.
top -a
上面都是经典
ps aux | awk '{print $6/1024 " MB\t\t" $11}' | sort -n
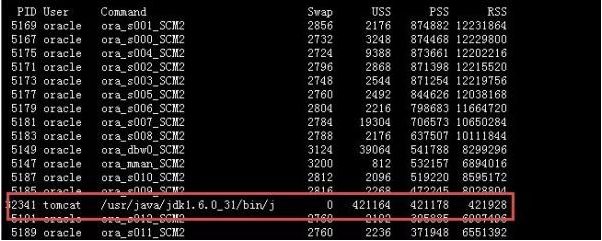
smem命令查看
关于smem命令,这里不做介绍,直接参考链接Linux监控工具介绍系列——smem
#smem -rs pss
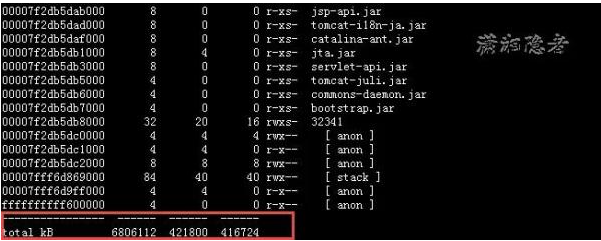
pmap命令查看
# ps -ef | grep tomcat
# pmap 32341

# pmap -x 32341
The -x option can be used to provide information about the memory allocation and mapping types per mapping. The amount of resident, non-shared anonymous, and locked memory is shown for each mapping。
python脚本查看
网上有个python脚本计算程序或进程的内存使用情况,地址位于https://raw.githubusercontent.com/pixelb/ps_mem/master/ps_mem.py
python ps_mem.py

[root@mylnx03 ~]# python ps_mem.py -h Usage: ps_mem [OPTION]... Show program core memory usage   -h, -help                   Show this help   -p [,pid2,...pidN]     Only show memory usage PIDs in the specified list   -s, --split-args            Show and separate by, all command line arguments  -t, --total                 Show only the total value  -d, --discriminate-by-pid   Show by process rather than by program  -S, --swap                  Show swap information  -w                       Measure and show process memory every N seconds [root@mylnx03 ~]# python ps_mem.py  -p 32341  Private  +   Shared  =  RAM used       Program 411.2 MiB + 184.0 KiB = 411.4 MiB       java ---------------------------------                        411.4 MiB =================================


$ ps_mem -S -p $(pgrep firefox)

Private   +   Shared  =  RAM used   Swap used   Program

355.0 MiB +  38.7 MiB = 393.7 MiB    35.9 MiB   firefox
---------------------------------------------
                        393.7 MiB    35.9 MiB
=============================================
#!/bin/ksh
#
# Returns total memory used by process $1 in kb.
#
# See /proc/NNNN/smaps if you want to do something
# more interesting.
#

IFS=$'\n'

for line in $(</proc/$1/smaps)
do
   [[ $line =~ ^Size:\s+(\S+) ]] && ((kb += ${.sh.match[1]}))
done

print $kb
sudo smem | awk '/firefox/{swap += $5; pss += $7;} END {print "swap = "swap/1024" PSS = "pss/1024}'

Or for libvirt;

sudo smem | awk '/libvirt/{swap += $5; pss += $7;} END {print "swap = "swap/1024" PSS = "pss/1024}'

This will give you the total in MB like so;

swap = 0 PSS = 2096.92

swap = 224.75 PSS = 421.455
echo "IP address: "
read ip
echo "Specfiy PID: "
read pid
echo "Interval in seconds: "
read interval

while [ 1 ]
do
    date
    snmpget -v2c -c public $ip HOST-RESOURCES-MIB::hrSWRunPerfCPU.$pid
    snmpget -v2c -c public $ip HOST-RESOURCES-MIB::hrSWRunPerfMem.$pid
    sleep $interval;
done

 浙公网安备 33010602011771号