Echarts-for-React的使用
安装
npm install echarts-for-react --save
引入
import ReactEcharts from "echarts-for-react";
简单代码示例
import React from 'react'
import ReactEcharts from 'echarts-for-react'
class Demon extends React.Component {
state = {option: {}};
render () {
return (
<>
<ReactEcharts option={this.state.option} />
</>
);
}
componentDidMount () {
let option = {
xAxis: {
type: 'category',
data: ['Mon', 'Tue', 'Wed', 'Thu', 'Fri', 'Sat', 'Sun']
},
yAxis: {
type: 'value'
},
series: [
{
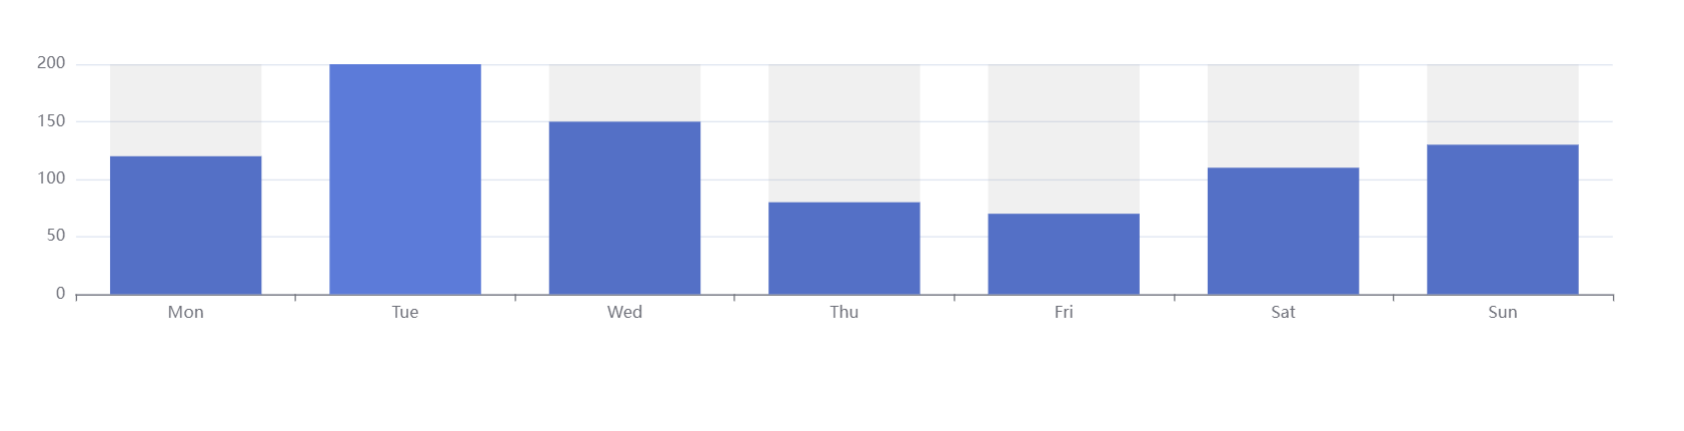
data: [120, 200, 150, 80, 70, 110, 130],
type: 'bar',
showBackground: true,
backgroundStyle: {
color: 'rgba(180, 180, 180, 0.2)'
}
}
]
};
this.setState({option})
}
}
export default Demon;
效果
xAxis 指标坐标系 grid 中的 x 轴
yAxis 指标坐标系 grid 中的 y 轴


 浙公网安备 33010602011771号