
echars 饼状图 轮循 水平翻转
code:
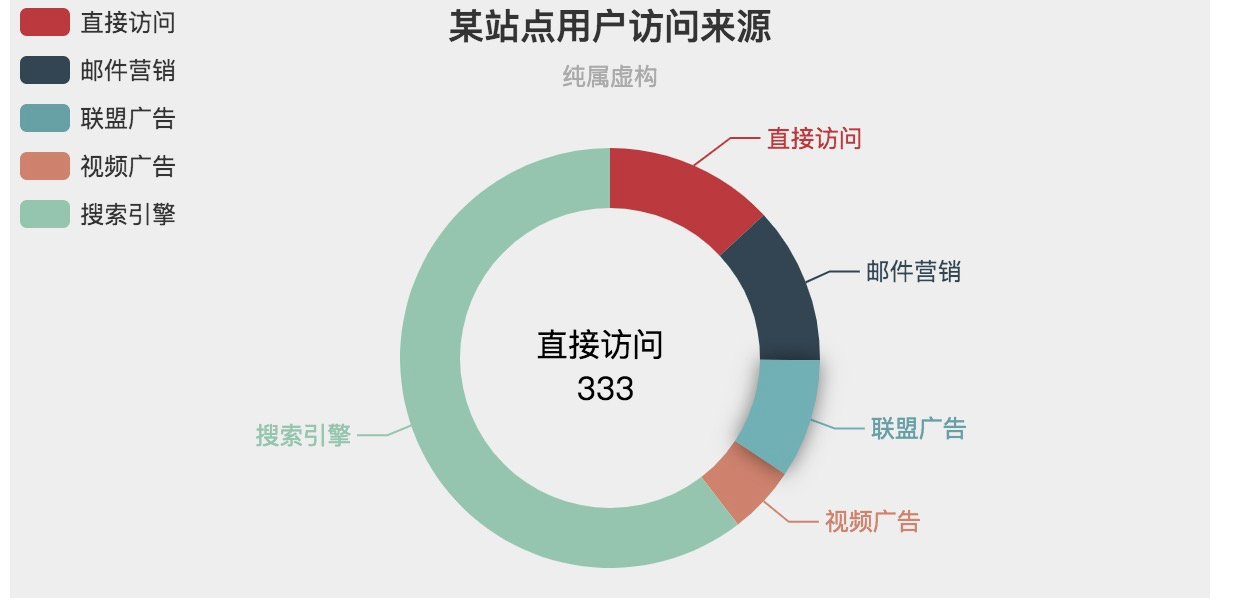
<!DOCTYPE html>
<html lang="en">

<head>
  <meta charset="UTF-8">
  <meta name="viewport" content="width=device-width, initial-scale=1.0">
  <meta http-equiv="X-UA-Compatible" content="ie=edge">
  <title>Echars|饼状图|轮循|水平翻转</title>
</head>

<body>
  <script src="https://cdn.jsdelivr.net/npm/vue"></script>
  <script src="https://echarts.baidu.com/examples/vendors/echarts/echarts.min.js"></script>
  <!-- demo -->
  <div id="demo" style="width: 600px;height:300px;background:#eee"></div>
  <div class="num">
    <span>直接访问</span>
    <br>
    <span>333</span>
  </div>
  <!-- script -->
  <script>
    var yDataList = [{
        value: 335,
        name: '直接访问'
      },
      {
        value: 310,
        name: '邮件营销'
      },
      {
        value: 234,
        name: '联盟广告'
      },
      {
        value: 135,
        name: '视频广告'
      },
      {
        value: 1548,
        name: '搜索引擎'
      }
    ];
    var option = {
      title: {
        text: '某站点用户访问来源',
        subtext: '纯属虚构',
        x: 'center'
      },
      tooltip: {
        trigger: 'item',
        formatter: "{a} <br/>{b} : {c} ({d}%)"
      },
      legend: {
        orient: 'vertical',
        left: 'left',
        data: ['直接访问', '邮件营销', '联盟广告', '视频广告', '搜索引擎']
      },
      series: [{
        name: '访问来源',
        type: 'pie',
        radius: ['50%', '70%'],
        center: ['50%', '60%'],
        data: yDataList,
        itemStyle: {
          emphasis: {
            shadowBlur: 10,
            shadowOffsetX: 0,
            shadowColor: 'rgba(0, 0, 0, 0.5)'
          }
        }
      }]
    };

    var index = -1;
    var timer = null;
    var myChart = echarts.init(document.getElementById('demo'))
    myChart.setOption(option)
    myChart.on("mouseover", (e) => {
      loopStop(e.dataIndex)
    });
    this.myChart.on("mouseout", () => {
      loopStart()
    });
    loopStart()

    function loopStart() {
      clearInterval(timer)
      timer = setInterval(() => {
        myChart.dispatchAction({
          type: "downplay",
          dataIndex: index
        });
        index++
        if (index >= yDataList.length) {
          index = 0
        }
        myChart.dispatchAction({
          type: "highlight",
          dataIndex: index
        });
      }, 2000);
    }

    function loopStop(i) {
      clearInterval(timer)
      myChart.dispatchAction({
        type: "downplay",
        dataIndex: index
      });
      index = i
      myChart.dispatchAction({
        type: "highlight",
        dataIndex: i
      });
    }
  </script>
  <style>
    .num {
      position: absolute;
      left: 271px;
      top: 170px;
      text-align: center;
      animation: rotate 2s linear infinite;
    }
    /* @keyframes circling{
      from{
        transform:rotate(0deg);
      }
      to{
        transform:rotate(360deg);
      }
    } */
    @keyframes rotate {
      0% {
        opacity: 0;
        transform: rotate(0deg);
        transform: rotateY(0deg);
        ;
      }

      20% {
        opacity: 1;
        transform: rotateY(360deg);

      }

      100% {
        opacity: 1;
        transform: rotateY(360deg);
      }
    }
  </style>
</body>

</html>

 浙公网安备 33010602011771号