
mysql性能优化关键点
原文链接:https://w.cnblogs.com/jenvid/p/8491047.html
一 服务器参数调优,有哪些关键点?
1. 应用访问优化
| 优化方法 | 性能提升效果 | 优化成本 | 说明 |
|---|---|---|---|
| 减少数据访问 能不访问就不访问-减少磁盘IO |
1~1000 | 低 | 缓存服务器缓存mysql数据,Redis、memorycache |
| 返回更少的数据 较少网络传输和磁盘IO |
1~100 | 低 | 光折射损耗,请求距离/光速=响应时间 |
| 减少交互次数 较少网络传输 |
1~20 | 低 | 存储过程(缺乏扩展性),但很少使用,因此应用层实现 |
IOPS的一些数据
- SAS的IOPS 100-200,顺序读写吞吐量大,通常放置顺序写的log文件
- SSD的IOPS在5W以上,读比写高一个数量级,适用读多写少的场景,通常放置随机读写的data文件
4种IO调度算法
基本思路:通过合并和排序IO请求队列中的请求大大降低所需的磁盘寻到时间,从而提高整体IO性能
1.Noop No operation
- 最简单的FIFO队列算法
- 仅适当合并用户请求,并不排序请求
2.CFQ Completely Fair Queueing
- 完全公平队列算法,目标是保证磁盘IO带宽的公平分配
- 使用了多个排序队列,确认为64
- 按照IO请求地址进行排序,并不是按照先来后到的顺序排序
- 本质是轮询IO输入队列,选择第一个非空队列,依次调度不同队列的特定个数请求,然后将这些请求移动到调度队列的末尾
- 优先处理与上一个所处理的请求的最近的请求,有可能某些队列的请求永远得不到调度以至被饿死
| 原始队列 | 100 500 101 10 56 1000 |
|---|---|
| NOOP队列 | 100 101 500 10 56 1000 |
| CFQ队列 | 100 101,500 1000,10 56(56可能被饿死) |
3.Deadline
- 在CFQ基础上解决IO请求被饿死的情况
- 除了CFQ的队列(调度、排序队列)之外,新增4个队列
- 1个读IO请求队列,1个写IO请求队列,请求根据起始扇区号排序
- 2个deadline队列,包含相同的读和写请求,根据请求的deadline排序
- 引出队列的目的就是为了解决饿死的问题
- 默认情况,读请求超时是500ms,写请求超时是5s,写不会堵塞读,优先保证读
- 最后期限保证调度程序照顾等待了很长时间的请求,即使在排序队列的末尾
(1)查看系统支持的调度算法
[root@docker02 queue]# dmesg |grep -i scheduler
[    0.796082] io scheduler noop registered
[    0.796084] io scheduler deadline registered (default)
[    0.796103] io scheduler cfq registered
(2)linux系统当前的磁盘IO调度算法:
[root@docker02 queue]# cat /sys/block/sda/queue/scheduler
noop [deadline] cfq
默认是deadline
(3)修改IO调度算法
[root@docker02 queue]# echo noop > /sys/block/sda/queue/scheduler
[root@docker02 queue]# cat scheduler
[noop] deadline cfq
4. Anticipatory
- CFQ和Deadline考虑满足零散IO请求
- 并没有优化连续的IO请求
- 预期算法为了满足随机IO和顺序IO混合场景
https://www.cnblogs.com/zhenjing/archive/2012/06/20/linux_writeback.html
2. 服务器硬件选型
服务器资源无外乎:CPU/MEM/IO/NET
- CPU 根据CPU线程数进而设定mysql的线程数
- 线程数=物理CPU个数 * 核数 * 每核线程数,如2*6*2=24
windows查看核数和每核线程数
cmd
wmic
cpu get *
    Name    NumberOfCores   NumberOfEnabledCore
... 2.20GHz 2               2
#NumberOfCores CPU核数
#NumberOfEnableCore 线程数
#笔记本,1物理CPU2核4线程
linux查看核数和每核线程数
(1)查看CPU型号
[root@docker02 queue]# cat /proc/cpuinfo | grep name | cut -f2 -d: | uniq -c
      4  Intel(R) Xeon(R) CPU E5-2690 v2 @ 3.00GHz
(2)查看物理CPU个数,也就是插槽数
[root@docker02 queue]# cat /proc/cpuinfo|grep "physic"
physical id     : 0
address sizes   : 40 bits physical, 48 bits virtual
physical id     : 0
address sizes   : 40 bits physical, 48 bits virtual
physical id     : 1
address sizes   : 40 bits physical, 48 bits virtual
physical id     : 1
address sizes   : 40 bits physical, 48 bits virtual
[root@docker02 queue]# cat /proc/cpuinfo| grep "physical id"| sort| uniq| wc -l
2
(3)查看CPU核数,每个CPU多少核
[root@docker02 queue]# cat /proc/cpuinfo| grep "cpu cores"| uniq
cpu cores       : 2
(4)查看所有的CPU线程数
[root@docker02 queue]# cat /proc/cpuinfo| grep "processor"| wc -l
4
这里的核数可设置为mysql的线程数: thread_concurrency
3. 操作系统优化
(1)调整内核减少swap使用
查看当前swap使用率
[root@docker02 ~]# sysctl -a |grep swappiness
vm.swappiness = 30
[root@docker02 ~]# cat /proc/sys/vm/swappiness
30
修改swap使用率
[root@docker02 ~]# sysctl vm.swappiness=10
vm.swappiness = 10
[root@docker02 ~]# vi etc/sysctl.conf
- 可以设置成10,当内存剩余10%时才是用swap,尽可能不用swap
- 如果为0,可能发生OOM错误
(2)单实例关闭NUMA,双实例(2/4)打开NUMA
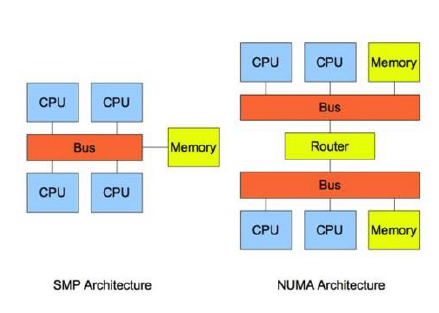
SMP Symmetric Multi Processing 对称多处理
- 所有CPU共享所有资源,如总线bus、memory、IO系统
- 问题:随着CPU的增多,CPU对等访问相同的内存地址会造成冲突,造成CPU资源浪费
NUMA Non-Uniform Memory Access
- 非统一内存访问
- 把几十上百的CPU组合在一个服务器内
- CPU访问本地内存速度将高于远地内存
- 问题:访问远地地址造成CPU时间浪费
https://www.cnblogs.com/yubo/archive/2010/04/23/1718810.html
MPP Massive Parallel Processing
- 由多个SMP服务器通过一定的节点互联网络进行连接,协同工作,完成相同的任务
- 用户角度看起来是一个服务器系统
- 每个节点只访问自己的本地资源-内存、存储
查看NUMA
需要安装numactl工具: yum -y install numactl
1.查看NUMA是否打开
- dmesg判断
[root@docker02 grub2]# dmesg | grep -i numa
[    0.000000] NUMA: Node 0 [mem 0x00000000-0x0009ffff] + [mem 0x00100000-0x0fffffff] -> [mem 0x00000000-0x0fffffff]
[    0.000000] NUMA: Node 0 [mem 0x00000000-0x0fffffff] + [mem 0x10000000-0xbfffffff] -> [mem 0x00000000-0xbfffffff]
[    0.000000] NUMA: Node 0 [mem 0x00000000-0xbfffffff] + [mem 0x100000000-0x13fffffff] -> [mem 0x00000000-0x13fffffff]

[root@docker02 device]# grep -i numa /var/log/dmesg
[    0.000000] NUMA: Node 0 [mem 0x00000000-0x0009ffff] + [mem 0x00100000-0x0fffffff] -> [mem 0x00000000-0x0fffffff]
[    0.000000] NUMA: Node 0 [mem 0x00000000-0x0fffffff] + [mem 0x10000000-0xbfffffff] -> [mem 0x00000000-0xbfffffff]
[    0.000000] NUMA: Node 0 [mem 0x00000000-0xbfffffff] + [mem 0x100000000-0x13fffffff] -> [mem 0x00000000-0x13fffffff]
说明numa为enable
2.查看numa状态numastat
[root@docker02 grub2]# numastat
                           node0
numa_hit                10677303
numa_miss                      0
numa_foreign                   0
interleave_hit             14453
local_node              10677303
other_node                     0
- numa_hit 打算在该节点上分配内存,最后从这个节点分配的次数
- num_miss 打算在该节点上分配内存,最后却从其它节点分配的次数
- num_foregin 打算在其他节点分配内存,最后却从这个节点分配的次数
- interleave_hit 打算采用interleave策略最后从该节点分配的次数
- local_node 该节点上的进程在该节点上分配的次数
- other_node 其它节点进程在该节点上分配的次数
3.查看numa相关信息,node内存大小,每个node中的逻辑CPU
[root@docker02 grub2]# numactl --hardwar
available: 1 nodes (0)
node 0 cpus: 0 1 2 3
node 0 size: 4095 MB
node 0 free: 1769 MB
node distances:
node   0
  0:  10
问题:在esxi上分配的是2 * 2的CPU,这里只能看到1个节点4个CPU,是否意味这4个CPU实际上在一个物理CPU内?
如果每个插槽的内核数 (cpuid.coresPerSocket) 大于 1,且虚拟机中的虚拟内核数大于 8,则虚拟 NUMA 节点大小与虚拟插槽大小相匹配。如果每个插槽的内核数小于或等于 1,则会创建虚拟 NUMA 节点以匹配首个打开虚拟机电源的物理主机的拓扑。
http://pubs.vmware.com/vsphere-51/index.jsp?topic=%2Fcom.vmware.vsphere.resmgmt.doc%2FGUID-17B629DE-75DF-4C23-B831-08107007FBB9.html
[root@docker02 grub2]# lscpu
Architecture:          x86_64
CPU op-mode(s):        32-bit, 64-bit
Byte Order:            Little Endian
CPU(s):                4
On-line CPU(s) list:   0-3
Thread(s) per core:    1
Core(s) per socket:    2
Socket(s):             2
NUMA node(s):          1
Vendor ID:             GenuineIntel
CPU family:            6
Model:                 62
Model name:            Intel(R) Xeon(R) CPU E5-2690 v2 @ 3.00GHz
Stepping:              4
CPU MHz:               3000.000
BogoMIPS:              6000.00
Hypervisor vendor:     VMware
Virtualization type:   full
L1d cache:             32K
L1i cache:             32K
L2 cache:              256K
L3 cache:              25600K
NUMA node0 CPU(s):     0-3
查看每个逻辑CPU的繁忙程度:yum -y install sysstat
[root@docker02 grub2]# mpstat -P ALL
Linux 3.10.0-229.el7.x86_64 (docker02.bluemoon.com.cn)  03/01/2018      _x86_64_        (4 CPU)

01:37:49 PM  CPU    %usr   %nice    %sys %iowait    %irq   %soft  %steal  %guest  %gnice   %idle
01:37:49 PM  all    0.12    0.00    0.11    0.02    0.00    0.00    0.00    0.00    0.00   99.75
01:37:49 PM    0    0.11    0.00    0.10    0.02    0.00    0.00    0.00    0.00    0.00   99.77
01:37:49 PM    1    0.13    0.00    0.11    0.02    0.00    0.00    0.00    0.00    0.00   99.73
01:37:49 PM    2    0.12    0.00    0.10    0.02    0.00    0.00    0.00    0.00    0.00   99.75
01:37:49 PM    3    0.12    0.00    0.11    0.01    0.00    0.01    0.00    0.00    0.00   99.75
4.查看网卡的numa node
[root@docker02 device]# cat /sys/class/net/eth0/device/numa_node
-1
http://blog.csdn.net/shaoyunzhe/article/details/53606584
https://www.cnblogs.com/wjoyxt/p/4804081.html
ESXi设置成2 * 8 CPU时
[root@docker01 ~]# numactl --hardware
available: 2 nodes (0-1)
node 0 cpus: 0 1 2 3 4 5 6 7
node 0 size: 2047 MB
node 0 free: 1405 MB
node 1 cpus: 8 9 10 11 12 13 14 15
node 1 size: 2047 MB
node 1 free: 1642 MB
node distances:
node   0   1
  0:  10  20
  1:  20  10
[root@docker01 ~]# numastat
                           node0           node1
numa_hit                  202582          254284
numa_miss                      0               0
numa_foreign                   0               0
interleave_hit              7283            7172
local_node                200189          245831
other_node                  2393            8453
[root@docker01 ~]# numactl --hardwar
available: 2 nodes (0-1)
node 0 cpus: 0 1 2 3 4 5 6 7
node 0 size: 2047 MB
node 0 free: 1405 MB
node 1 cpus: 8 9 10 11 12 13 14 15
node 1 size: 2047 MB
node 1 free: 1642 MB
node distances:
node   0   1
  0:  10  20
  1:  20  10
[root@docker01 ~]# lscpu
Architecture:          x86_64
CPU op-mode(s):        32-bit, 64-bit
Byte Order:            Little Endian
CPU(s):                16
On-line CPU(s) list:   0-15
Thread(s) per core:    1
Core(s) per socket:    8
Socket(s):             2
NUMA node(s):          2
Vendor ID:             GenuineIntel
CPU family:            6
Model:                 62
Model name:            Intel(R) Xeon(R) CPU E5-2690 v2 @ 3.00GHz
Stepping:              4
CPU MHz:               3000.000
BogoMIPS:              6000.00
Hypervisor vendor:     VMware
Virtualization type:   full
L1d cache:             32K
L1i cache:             32K
L2 cache:              256K
L3 cache:              25600K
NUMA node0 CPU(s):     0-7
NUMA node1 CPU(s):     8-15
关闭NUMA
1.BIOS设置关闭
2.OS内核中设置关闭
[root@docker01 grub2]# vi /boot/grub2/grub.cfg
linux16 /vmlinuz-3.10.0-229.el7.x86_64 root=/dev/mapper/centos-root ro net.ifnames=0 biosdevname=0 rd.lvm.lv=centos/root rd.lvm.lv=centos/swap numa=off rhgb quiet
[root@docker01 ~]# cat /proc/cmdline
BOOT_IMAGE=/vmlinuz-3.10.0-229.el7.x86_64 root=/dev/mapper/centos-root ro net.ifnames=0 biosdevname=0 rd.lvm.lv=centos/root rd.lvm.lv=centos/swap numa=off rhgb quiet

[root@docker01 grub2]# dmesg |grep -i numa
[    0.000000] Command line: BOOT_IMAGE=/vmlinuz-3.10.0-229.el7.x86_64 root=/dev/mapper/centos-root ro net.ifnames=0 biosdevname=0 rd.lvm.lv=centos/root rd.lvm.lv=centos/swap numa=off rhgb quiet
[    0.000000] NUMA turned off
[    0.000000] Kernel command line: BOOT_IMAGE=/vmlinuz-3.10.0-229.el7.x86_64 root=/dev/mapper/centos-root ro net.ifnames=0 biosdevname=0 rd.lvm.lv=centos/root rd.lvm.lv=centos/swap numa=off rhgb quiet
lscpu NUMA节点也变成1个了:
[root@docker01 grub2]# lscpu
Architecture:          x86_64
CPU op-mode(s):        32-bit, 64-bit
Byte Order:            Little Endian
CPU(s):                16
On-line CPU(s) list:   0-15
Thread(s) per core:    1
Core(s) per socket:    8
Socket(s):             2
NUMA node(s):          1
Vendor ID:             GenuineIntel
CPU family:            6
Model:                 62
Model name:            Intel(R) Xeon(R) CPU E5-2690 v2 @ 3.00GHz
Stepping:              4
CPU MHz:               3000.000
BogoMIPS:              6000.00
Hypervisor vendor:     VMware
Virtualization type:   full
L1d cache:             32K
L1i cache:             32K
L2 cache:              256K
L3 cache:              25600K
NUMA node0 CPU(s):     0-15

[root@docker01 grub2]# numactl --hardware
available: 1 nodes (0)
node 0 cpus: 0 1 2 3 4 5 6 7 8 9 10 11 12 13 14 15
node 0 size: 4095 MB
node 0 free: 3111 MB
node distances:
node   0
  0:  10
3.mysql启动时关闭
启动的时候加入 --innodb-numa-interleave
[root@docker01 ~]# mysqld --verbose --help|grep numa
2018-03-01 14:23:29 0 [Note] mysqld (mysqld 5.6.39-log) starting as process 1950 ...
2018-03-01 14:23:29 1950 [Note] Plugin 'FEDERATED' is disabled.
  --innodb-numa-interleave
innodb-numa-interleave                                     FALSE
2018-03-01 14:23:29 1950 [Note] Binlog end
2018-03-01 14:23:29 1950 [Note] Shutting down plugin 'MyISAM'
2018-03-01 14:23:29 1950 [Note] Shutting down plugin 'CSV'
4.网卡优化
(1)多张网卡聚合,提高负载或者冗余
1.配置网卡
[root@docker01 network-scripts]# cat ifcfg-eth0
TYPE=Ethernet
BOOTPROTO=none
NAME=eth0
DEVICE=eth0
MASTER=bond0
SLAVE=yes
ONBOOT=yes
[root@docker01 network-scripts]# cat ifcfg-eth1
TYPE=Ethernet
BOOTPROTO=none
NAME=eth1
DEVICE=eth1
MASTER=bond0
SLAVE=yes
ONBOOT=yes
[root@docker01 network-scripts]# cat ifcfg-bond0
TYPE=Ethernet
BOOTPROTO=no
NAME=bond0
DEVICE=bond0
ONBOOT=yes
IPADDR=172.16.3.153
NETMASK=255.255.255.0
GATEWAY=172.16.3.254
DNS1=172.16.13.13
2.加载模块
[root@docker01 network-scripts]# cat /etc/modprobe.d/mlx4.conf
alias bond0 bonding
options bond0 miimon=100 mode=1
[root@docker01 network-scripts]# modprobe bonding
- mode=0 表示load balancing(round-robin)为负载均衡方式
- mode=1 表示fault-tolerance(active-backup)提供冗余功能
- 如果在ifcfg-bond0里配置了BONDING_OPTS="mode=5 miimon=100",这里可以不配置
3.重启系统init 6
4.查看结果
[root@docker01 network-scripts]# ip a
1: lo: <LOOPBACK,UP,LOWER_UP> mtu 65536 qdisc noqueue state UNKNOWN
    link/loopback 00:00:00:00:00:00 brd 00:00:00:00:00:00
    inet 127.0.0.1/8 scope host lo
       valid_lft forever preferred_lft forever
    inet6 ::1/128 scope host
       valid_lft forever preferred_lft forever
2: eth0: <BROADCAST,MULTICAST,SLAVE,UP,LOWER_UP> mtu 1500 qdisc mq master bond0 state UP qlen 1000
    link/ether 00:50:56:a3:30:bb brd ff:ff:ff:ff:ff:ff
3: eth1: <BROADCAST,MULTICAST,SLAVE,UP,LOWER_UP> mtu 1500 qdisc mq master bond0 state UP qlen 1000
    link/ether 00:50:56:a3:30:bb brd ff:ff:ff:ff:ff:ff
4: bond0: <BROADCAST,MULTICAST,MASTER,UP,LOWER_UP> mtu 1500 qdisc noqueue state UP
    link/ether 00:50:56:a3:30:bb brd ff:ff:ff:ff:ff:ff
    inet 172.16.3.153/24 brd 172.16.3.255 scope global bond0
       valid_lft forever preferred_lft forever
    inet6 fe80::250:56ff:fea3:30bb/64 scope link
       valid_lft forever preferred_lft forever
eth0 eth1 bond0三张网卡MAC地址一样
[root@docker01 network-scripts]# cat /proc/net/bonding/bond0
Ethernet Channel Bonding Driver: v3.7.1 (April 27, 2011)

Bonding Mode: fault-tolerance (active-backup)
Primary Slave: None
Currently Active Slave: eth0
MII Status: up
MII Polling Interval (ms): 100
Up Delay (ms): 0
Down Delay (ms): 0

Slave Interface: eth0
MII Status: up
Speed: 10000 Mbps
Duplex: full
Link Failure Count: 0
Permanent HW addr: 00:50:56:a3:30:bb
Slave queue ID: 0

Slave Interface: eth1
MII Status: up
Speed: 10000 Mbps
Duplex: full
Link Failure Count: 0
Permanent HW addr: 00:50:56:a3:8a:c2
Slave queue ID: 0
(2)调整网络参数
1.查看网络的各种连接状态
netstat -n | awk '/^tcp/ {++S[$NF]} END {for(a in S) print a, S[a]}'
2.查看网络网络流量
[root@docker02 device]# sar -n DEV
Linux 3.10.0-229.el7.x86_64 (docker02)  03/01/2018      _x86_64_        (4 CPU)

01:30:01 PM     IFACE   rxpck/s   txpck/s    rxkB/s    txkB/s   rxcmp/s   txcmp/s  rxmcst/s
01:40:01 PM      eth0      4.96      3.11      0.34      0.22      0.00      0.00      0.00
01:40:01 PM        lo      5.96      5.96      0.34      0.34      0.00      0.00      0.00
01:50:01 PM      eth0      5.20      3.25      0.37      0.25      0.00      0.00      0.00
01:50:01 PM        lo      5.96      5.96      0.34      0.34      0.00      0.00      0.00
02:00:01 PM      eth0      1.72      0.12      0.11      0.01      0.00      0.00      0.00
02:00:01 PM        lo      6.04      6.04      0.34      0.34      0.00      0.00      0.00
02:10:01 PM      eth0      2.06      0.08      0.13      0.00      0.00      0.00      0.00
02:10:01 PM        lo      5.96      5.96      0.34      0.34      0.00      0.00      0.00
02:20:01 PM      eth0      2.47      0.07      0.15      0.00      0.00      0.00      0.00
02:20:01 PM        lo      5.95      5.95      0.34      0.34      0.00      0.00      0.00
02:30:01 PM      eth0      2.66      0.68      0.20      0.30      0.00      0.00      0.00
02:30:01 PM        lo      6.13      6.13      0.35      0.35      0.00      0.00      0.00
02:40:01 PM      eth0      1.90      0.07      0.13      0.00      0.00      0.00      0.00
02:40:01 PM        lo      5.95      5.95      0.34      0.34      0.00      0.00      0.00
02:50:01 PM      eth0      1.92      0.08      0.12      0.00      0.00      0.00      0.00
02:50:01 PM        lo      5.96      5.96      0.34      0.34      0.00      0.00      0.00
03:00:01 PM      eth0      1.74      0.07      0.11      0.00      0.00      0.00      0.00
03:00:01 PM        lo      6.00      6.00      0.34      0.34      0.00      0.00      0.00
Average:         eth0      2.74      0.84      0.19      0.09      0.00      0.00      0.00
Average:           lo      5.99      5.99      0.34      0.34      0.00      0.00      0.00
3.查看网络双工模式
[root@docker02 device]# ethtool eth0
Settings for eth0:
        Supported ports: [ TP ]
        Supported link modes:   1000baseT/Full
                                10000baseT/Full
        Supported pause frame use: No
        Supports auto-negotiation: No
        Advertised link modes:  Not reported
        Advertised pause frame use: No
        Advertised auto-negotiation: No
        Speed: 10000Mb/s
        Duplex: Full
        Port: Twisted Pair
        PHYAD: 0
        Transceiver: internal
        Auto-negotiation: off
        MDI-X: Unknown
        Supports Wake-on: uag
        Wake-on: d
        Link detected: yes
4.增加MTU大小,默认1500
[root@docker02 device]# ifconfig eth0 mtu 9000 up
[root@docker02 device]# ifconfig eth0
eth0: flags=4163<UP,BROADCAST,RUNNING,MULTICAST>  mtu 9000
5.增加网络缓存
- /proc/sys/net/ipv4/tcp_mem 系统全局参数,所有TCP的buffer配置,单位为内存页(4k),超过上限时可能丢弃报文
[root@docker02 device]# sysctl -a |grep tcp_mem
net.ipv4.tcp_mem = 92451        123271  184902
- /proc/sys/net/ipv4/tcp_rmen 第一个值为TCP接收buffer的最少字节数,第二个值是默认值,会被rmem_default覆盖,第三个值是接收buffer的最大字节数,会被rmem_max覆盖
[root@docker02 device]# sysctl -a |grep tcp_rmem
net.ipv4.tcp_rmem = 4096        87380   6291456
- /proc/sys/net/ipv4/tcp_wmem 上面是接收,这里是发送字节数
[root@docker02 device]# sysctl -a |grep tcp_wmem
net.ipv4.tcp_wmem = 4096        16384   4194304
- /proc/sys/net/core/wmem_default TCP数据发送窗口默认字节数
[root@docker02 device]# sysctl -a |grep wmem_default
net.core.wmem_default = 212992
- /proc/sys/net/core/wmem_max: TCP数据发送窗口最大字节数
[root@docker02 device]# sysctl -a |grep wmem_max
net.core.wmem_max = 212992
- /proc/sys/net/core/rmem_default: TCP数据接收窗口默认字节数
[root@docker02 device]# sysctl -a |grep rmem_default
net.core.rmem_default = 212992
- /proc/sys/net/core/rmem_max: TCP数据接收窗口最大字节数
[root@docker02 device]# sysctl -a |grep rmem_max
net.core.rmem_max = 212992
6.调整文件系统挂载选项
使用XFS或者EXT4的文件系统格式
(1)mount -o noatime
- 性能提升5% 10% nobarrier
- 不更新文件系统的访问时间记录
       noatime
              Do not update inode access times on this filesystem (e.g., for  faster
              access on the news spool to speed up news servers).
(2)mount -o nobarrier
- 数据仅写到磁盘缓冲区就返回IO响应
       barrier|nobarrier
              Enables/disables the use of block layer write barriers for writes into
              the  journal and for data integrity operations.  This allows for drive
              level write caching to be enabled, for devices that support write bar‐
              riers.
4. 数据库优化
二 MySQL性能调优有哪些关键点/经验?
1.实例优化
- innodb_buffer_pool_size 类似SGA,决定了总的IO能力上限,一般设置为物理内存的60%-80%,内存时间和SSD时间响应相差1000倍
- innodb_thread_concurrency 线程并发数量,一般为CPU的线程总数,如果为0则由innodb自动控制
- query_cache_type = 0 缓存结果集
- query_cache_size = 0 缓存大小 这两个一般不用,直接通过nosql缓存服务器实现
- max_user_connections 最大应用连接数,如果为300,则10个应用就是300,每个连接都需要消耗内存,每个会话占用内存最小是512k,最大是16M
- interactive_timeout 交互超时时间,比如mysql mysqldump默认8小时,可设置为120s
- wait_timeout 应用超时时间,比如通过连接池连接,jdbc,默认8小时,可设置为120s
- innodb_io_capacity 设置为IOPS的75%左右,innodb后台进程每秒处理的IO操作数据页
- innodb_flush_log_at_trx_commit = 1
- 0 the log buffer is written out to the log file once per second and the flush to disk operation is performed on the log file, but nothing is done at a transaction commit. 每秒刷到磁盘,不受事务提交影响
- 1 the log buffer is written out to the log file at each transaction commit and the flush to disk operation is performed on the log file. 每事务刷新到磁盘
- 2 the log buffer is written out to the file at each commit, but the flush to disk operation is not performed on it. 每事务刷新到IO缓存,存在丢失风险
- sync_binlog = 1 1个提交就写到binlog,flush日志到磁盘
- innodb_log_file_size 日志文件大小,ssd设置4-8G,sas设置1-2G
- innodb_log_files_in_group 日志文件个数
- innodb_flush_method O_DIRECT,跳过IO缓存,直接落盘
- innodb_max_dirty_pages_pct 50%,将innodb_buffer_pool_size刷到磁盘
- innodb_flush_neighbors 刷新相邻块,如果是SSD关闭,SAS打开
- tx_isolation 事务隔离级别,用RC提高并发
2.内存分配
(1)All thread buffer所有会话线程级别内存分配总和
tatol memory size=max_threads(当前活跃连接数) * (
read_buffer_size        + #顺序读缓冲,提高顺序读效率
read_rnd_buffer_size    + #随机读缓冲,提高随机读效率
sort_buffer_size        + #排序缓冲,提高排序效率
join_buffer_size        + #表连接缓冲,提高表连接效率
binlog_cache_size       + #二进制日志缓冲,提高二进制日志写入效率
tmp_table_size          + #内存临时表,提高临时表存储效率
thread_stack            + #线程堆栈,暂时寄存SQL语句或者存储过程
thread_cache_size       + #线程缓冲池,避免多次反复打开线程开销
net_buffer_length       + #线程池连接缓冲以及读取结果缓冲
bulk_insert_buffer_size + #MyISAM表批量写入数据缓冲
)
(2)global buffer全局内存分配总和
global buffer size=
innodb_buffer_pool_size         + # innodb高速缓冲,行数据、索引缓冲、事务锁、自适应哈希
innodb_additional_mem_pool_size + #innodb数据字典额外内存,缓存所有表数据字典
innodb_log_buffer_size          + #innodb redo日志缓冲,提高redo日志写入效率
key_buffer_size                 + #MyISAM表索引高速缓冲,提高MyISAM表索引读写效率
query_cache_size                + #高速查询韩村,缓存大汛结果,提高反复查询返回效率
table_cache                     + #表空间文件描述缓存,提高数据表打开效率
table_definition_cache          + #表定义文件描述符缓存,就是缓存表结构,提高数据表打开效率
3.innodb_flush_method
4.编写高效SQL
- 1.减少多表join,尽量用单表查询,需要应用做配合
- 2.select获取准确的字段,不需要不获取
- 3.innodb避免使用count(*)
- (1)实时统计要求高的可以使用缓存服务器memcache、redis
- (2)要求低的可以使用单独统计表,定时更新
- 4.避免多余的排序
- (1)使用group by时,默认升序排序
- (2)不需要排序时,可以使用order by null
- 5.全模糊查询无法使用index,也不需要一开始就使用%
like '%keyvalue%'或者like '%keyvalue -
- 木板原理
- 6.使用in代替or
-
- SQL语句中的in包含的值不应该过多,尽量少于1000个
- 7.禁止隐式转换
- (1)数值类型禁止加引号
- (2)字符串类型必须加引号
- 8.禁止使用反向查询
- 例如
not in、!=、not like
- 例如
- 9.select for update语法,重点review流程
- 10.尽量少or
- (1)当where字句中存在多个条件以
or并存的时候,mysql优化器并没有很好的解决其执行计划优化问题 - (2)再加上mysql特有的sql和storage存储分层架构方式,造成了其性能比较低下
- (3)更多用的是
union all或者是union的方式来替代or会得到更好的效果
- (1)当where字句中存在多个条件以
- 11.尽量用
union all代替union- (1)
union需要建多个结果集合并后再进行唯一性过滤操作 - (2)因此会涉及到排序,增加大量的CPU运算,加大资源消耗和延迟
- (3)确认结果集唯一或者结果集重复无关紧要时,尽量用
union all
- (1)
- 12.尽量早过滤
- (1)常见于索引的优化设计中,将过滤性更好的字段放得更靠前
- (2)尽量使用join代替子查询
- 13.禁止在主库上执行后台管理和统计类功能的QUERY,必须要申请统计类在从库执行
select id * 10.2 from t1 where id>0 -> select id from t1 where id >0;
尽量减少在DB上的计算
select id,name from t1 limit 100000,10; -> select id,name from t1 where id>100000 limit 10;
先返回10W条数据再分页10条 直接返回10W后的10条
5.执行计划
6.索引设计
(1)覆盖索引
- 1.查询谓词都能够通过index进行扫描
- 2.排序谓词都能够利用index的有些性
- 3.index包含了查询所需要的所有字段
(2)不能使用索引
- 1.不要给选择率低的字段建索引,通过索引扫描的记录数超过30%,变成全表扫描
- 2.联合索引中,第一个索引列使用范围查询,第一个查询条件不是最左索引列
- 3.like最左以
%开始 - 4.两个独立索引,其中一个用于检索,一个用于排序,索引不是越多越好,尽量合并索引
- 5.表关联字段类型不一样,包含长度不一样
- 6.索引字段条件上使用函数
- 7.不要使用外键索引

 浙公网安备 33010602011771号