


perf性能分析工具
一、介绍
perf用法perf Examples
程序示例
火焰图Linux C/C++性能优化分析工具Perf使用教程-哔哩哔哩
perf是一个性能分析工具。可以知道哪些函数调用次数多导致性能消耗大。
二、安装
2.1 安装
perf工具跟内核版本强相关,需要安装linux-tools-common。安装步骤:
apt-get update
apt-get install linux-tools-common
apt-get install linux-tools-generic linux-cloud-tools-generic
2.2 运行可执行文件
可以直接使用安装的路径运行
# /usr/lib/linux-tools/5.15.0-152-generic/perf --version
perf version 5.15.185
也可以设置软链接。不同内核版本目录5.15.0-152-generic会有所区别。
ln -s /usr/lib/linux-tools/5.15.0-152-generic/perf /usr/bin/perf
注:如果/usr/bin/下本来就有perf文件则会报错,说明已经安装过。
// 报错提示
# perf --version
WARNING: perf not found for kernel 5.15.0-60

  You may need to install the following packages for this specific kernel:
    linux-tools-5.15.0-60-generic
    linux-cloud-tools-5.15.0-60-generic

  You may also want to install one of the following packages to keep up to date:
    linux-tools-generic
    linux-cloud-tools-generic
三、使用方法
初学时可以找个简单的程序理解perf的用法。我用附录中的演示程序为例讲解perf的使用方法。
3.1 查询需要监控的进程ID
perf是监控进程号的,所以先用ps命令查询得到进程ID。
# ps -ef | grep process_print
root       14712    7403 99 14:54 ?        01:52:17 ./process_print
3.2 perf监控进程
perf record -p 14712 -g
收集一段时间可以Ctrl+C退出监控。
3.3 perf生成报告
perf report -g

# ls
perf.data
3.3.1 将perf数据生成生成文本
方法2:转成文本可以直接看函数的占比。
// 生成perf数据txt
perf report -i perf.data > perf.txt

# ls
perf.data  perf.txt
3.3.2 将perf数据生成生成火焰图
- 火焰图环境安装
生成火焰图只需要一些脚本将数据绘图。这些脚本下载
git clone https://github.com/brendangregg/FlameGraph.git

# ls
FlameGraph  perf.data
- 将perf数据绘制成火焰图
perf script -i perf.data > perf.unfold
FlameGraph/stackcollapse-perf.pl perf.unfold > perf.folded
FlameGraph/flamegraph.pl perf.folded > perf.svg

# ls
FlameGraph  perf.data  perf.folded  perf.svg  perf.unfold
四、分析数据
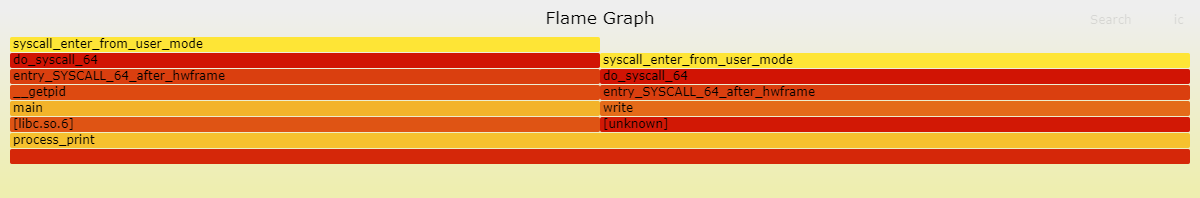
最终我们得到perf的火焰图后我们可以对数据进行分析。火焰图中函数宽度就是耗时,高度表示调用层级越多。
perf.svg
perf原理
https://developer.aliyun.com/article/65255
【Linux Perf 底层数据收集机制概述(码题诗科技)-哔哩哔哩】
perf工具指定跟踪的进程,看系统调用次数。
附录
1 演示程序
#include <stdio.h>
#include <unistd.h>
#include <sys/types.h>
#include <sys/wait.h>

void func1( void )
{
    printf("process (PID:%d) printing...\n", getpid());
    return;
}

int main() {
    pid_t pid = fork();

    if (pid < 0) {
        perror("fork failed");
        return 1;
    } else {
        while(1) {
            func1();
            sleep(2);
        }
    }
    return 0;
}
编译
gcc process_print.c -o process_print
./process_print
2 perf.txt数据
# To display the perf.data header info, please use --header/--header-only options.
#
#
# Total Lost Samples: 0
#
# Samples: 2  of event 'cpu-clock:pppH'
# Event count (approx.): 500000
#
# Children      Self  Command        Shared Object      Symbol
# ........  ........  .............  .................  ..................................
#
   100.00%   100.00%  process_print  [kernel.kallsyms]  [k] syscall_enter_from_user_mode
            |
            |--50.00%--0x7fe87c38bd90
            |          main
            |          __getpid
            |          entry_SYSCALL_64_after_hwframe
            |          do_syscall_64
            |          syscall_enter_from_user_mode
            |
             --50.00%--0x3339313a44495028
                       write
                       entry_SYSCALL_64_after_hwframe
                       do_syscall_64
                       syscall_enter_from_user_mode

   100.00%     0.00%  process_print  [kernel.kallsyms]  [k] entry_SYSCALL_64_after_hwframe
            |
            ---entry_SYSCALL_64_after_hwframe
               do_syscall_64
               syscall_enter_from_user_mode

   100.00%     0.00%  process_print  [kernel.kallsyms]  [k] do_syscall_64
            |
            ---do_syscall_64
               syscall_enter_from_user_mode

    50.00%     0.00%  process_print  libc.so.6          [.] 0x00007fe87c38bd90
            |
            ---0x7fe87c38bd90
               main
               __getpid
               entry_SYSCALL_64_after_hwframe
               do_syscall_64
               syscall_enter_from_user_mode

    50.00%     0.00%  process_print  process_print      [.] main
            |
            ---main
               __getpid
               entry_SYSCALL_64_after_hwframe
               do_syscall_64
               syscall_enter_from_user_mode

    50.00%     0.00%  process_print  [unknown]          [k] 0x3339313a44495028
            |
            ---0x3339313a44495028
               write
               entry_SYSCALL_64_after_hwframe
               do_syscall_64
               syscall_enter_from_user_mode

    50.00%     0.00%  process_print  libc.so.6          [.] __getpid
            |
            ---__getpid
               entry_SYSCALL_64_after_hwframe
               do_syscall_64
               syscall_enter_from_user_mode

    50.00%     0.00%  process_print  libc.so.6          [.] write
            |
            ---write
               entry_SYSCALL_64_after_hwframe
               do_syscall_64
               syscall_enter_from_user_mode


#
# (Cannot load tips.txt file, please install perf!)
#

 浙公网安备 33010602011771号