Prometheus学习笔记(4)什么是pushgateway???
一、pushgateway介绍
pushgateway是另一种数据采集的方式,采用被动推送来获取监控数据的prometheus插件,它可以单独运行在任何节点上,并不一定要运行在被监控的客户端。而后通过用户自定义编写的脚本把需要监控的数据发送给pushgateway,pushgateway再将数据推送给prometheus server。
二、pushgateway的安装运行和配置
2.1、pushgateway安装
官方下载地址:https://prometheus.io/download/#pushgateway
pushgateway和prometheus、node_exporter一样,直接下载,解压后直接运行即可。pushgateway启动后,默认监听9091端口,如下一顿操作:
# 下载
[root@prometheus ~]# wget https://github.com/prometheus/pushgateway/releases/download/v1.0.0/pushgateway-1.0.0.linux-amd64.tar.gz

# 解压
[root@prometheus ~]# tar -zxf pushgateway-1.0.0.linux-amd64.tar.gz -C /usr/local/
[root@prometheus ~]# mv /usr/local/pushgateway-1.0.0.linux-amd64 /usr/local/pushgateway-1.0.0
[root@prometheus ~]# ln -sv /usr/local/pushgateway-1.0.0 /usr/local/pushgateway
‘/usr/local/pushgateway’ -> ‘/usr/local/pushgateway-1.0.0’

# 运行
[root@prometheus ~]# cd /usr/local/pushgateway
[root@prometheus pushgateway]# ll
total 16136
-rw-r--r-- 1 3434 3434    11357 Oct 16 04:10 LICENSE
-rw-r--r-- 1 3434 3434      487 Oct 16 04:10 NOTICE
-rwxr-xr-x 1 3434 3434 16505766 Oct 16 03:58 pushgateway
[root@prometheus pushgateway]# ./pushgateway &
[1] 28453
[root@prometheus pushgateway]# level=info ts=2019-12-11T05:44:40.631Z caller=main.go:81 msg="starting pushgateway" version="(version=1.0.0, branch=HEAD, revision=cc61f46971f5eb7a5be64e80c2ee03857ddbb41a)"
level=info ts=2019-12-11T05:44:40.631Z caller=main.go:82 build_context="(go=go1.13.1, user=root@58be538fc30e, date=20191015-19:58:18)"
level=info ts=2019-12-11T05:44:40.697Z caller=main.go:142 listen_address=:9091

[root@prometheus pushgateway]# netstat -tulnp |grep 9091
tcp6       0      0 :::9091                 :::*                    LISTEN      28453/./pushgateway
再通过编写systemd的管理脚本对pushgateway进行管理:
[root@prometheus ~]# vim /usr/lib/systemd/system/pushgateway.service
[Unit]
Description=pushgateway
Documentation=https://prometheus.io/docs/introduction/overview
After=network-online.target remote-fs.target nss-lookup.target
Wants=network-online.target

[Service]
Type=simple
PIDFile==/var/run/pushgateway.pid
ExecStart=/usr/local/pushgateway/pushgateway
ExecReload=/bin/kill -s HUP $MAINPID
ExecStop=/bin/kill -s TERM $MAINPID

[Install]
WantedBy=multi-user.target
[root@prometheus ~]# systemctl daemon-reload
[root@prometheus ~]# ps -ef |grep push
root     28453 27712  0 13:44 pts/1    00:00:12 ./pushgateway
root     30549 30468  0 17:56 pts/3    00:00:00 grep --color=auto push
[root@prometheus ~]# kill 28453
[root@prometheus ~]# ps -ef |grep push
root     30551 30468  0 17:56 pts/3    00:00:00 grep --color=auto push
[root@prometheus ~]# systemctl start pushgateway
[root@prometheus ~]# ps -ef |grep push
root     30558     1  5 17:56 ?        00:00:00 /usr/local/pushgateway/pushgateway
root     30565 30468  0 17:56 pts/3    00:00:00 grep --color=auto push
[root@prometheus ~]# netstat -tulnp |grep 9091
tcp6       0      0 :::9091                 :::*                    LISTEN      30558/pushgateway
启动后,可以通过web界面进行访问pushgateway,192.168.0.143:9091,也可以通过命令行测试发送监控数据到pushgateway,如下:
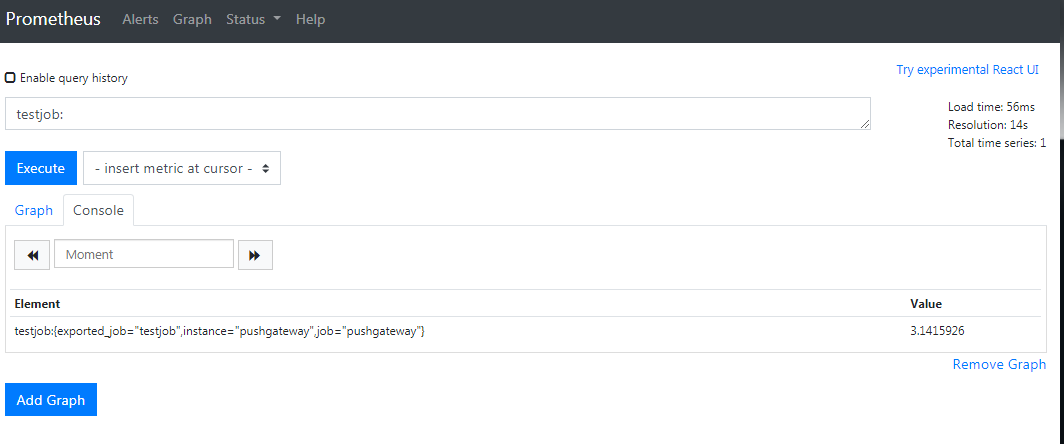
[root@node02 ~]# echo "testjob 3.1415926" |curl --data-binary @- http://192.168.0.143:9091/metrics/job/testjob

这里的数据,仅仅只是发送到了pushgateway,还需要在prometheus server上进行配置收集。这里需要注意的是最后是将key & value推送给pushgateway,curl --data-binary是将HTTP POST请求中的数据发送给HTTP服务器(pushgateway),和用户提交THML表单时浏览器的行为是外安全一样的,HTTP POST请求中的数据为纯二进制数据。
2.2、pushgateway配置
在prometheus.yml配置文件中,单独定义一个job,然后将target指向pushgateway运行所在主机的主机名或ip和运行端口即可。如下:
...
  - job_name: 'pushgateway'
    scrape_interval: 5s
    static_configs:
    - targets: ['192.168.0.143:9091']
      labels:
        instance: pushgateway
配置完成后,重启prometheus,再在prometheus的web端查询数据,即可获得刚才的测试数据,如图:
三、自定义脚本发送pushgateway
pushgateway本身没有任何抓取监控数据的功能,它只是被动的等待数据推送过来,下面在来搞搞抓取TCP_ESTABLISHED的瞬时数量,如下脚本:
[root@node02 ~]# cd /usr/local/node_exporter
[root@node02 node_exporter]# cat tcp_establish.sh
#!/bin/bash
instance_name=$(hostname) #本机主机名变量,用于后面的标签
if [ $instance_name == "localhost" ];then
    echo "Must change the hostname."
    exit 1
fi
label="count_tcp_established"  #定义一个新的key
count_tcp_established=$(netstat -an |grep -i ESTABLISHED |wc -l)
echo "$label $count_tcp_established" | curl --data-binary @- http://192.168.0.143:9091/metrics/job/pushgateway/instance/$instance_name

# 增加可执行权限后,多执行几次
[root@node02 node_exporter]# chmod +x tcp_establish.sh
[root@node02 node_exporter]# sh tcp_establish.sh
执行完成后,在pushgateway 的web端以及prometheus server的web端查询数据图,如下:
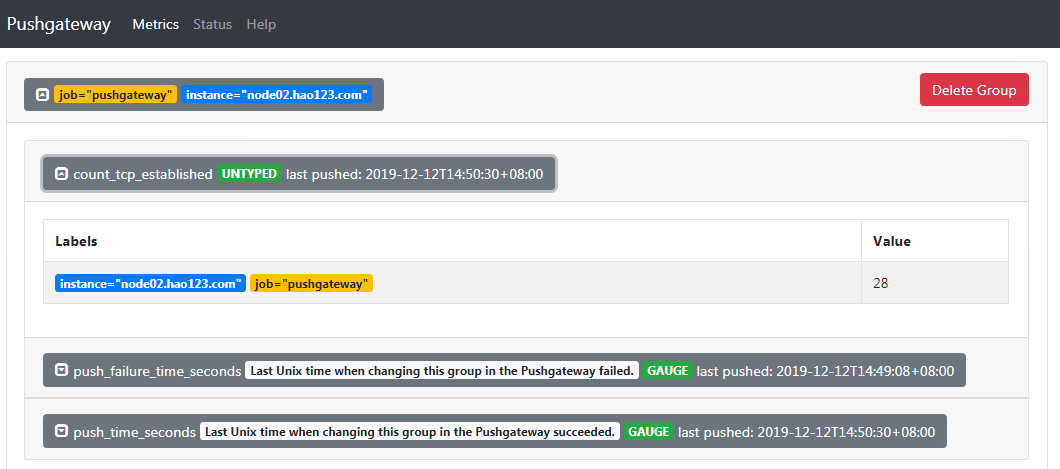

这里需要了解的是最后收集数据pushgateway的组成,主要是通过linux的命令行去获取数据,并通过echo的方式建立key value数据推送到pushgateway。http://192.168.0.143:9091/metrics/job/pushgateway/instance/$instance_name,这条连接主要分为三个部分:
-
http://192.168.0.143:9091/metrics/job/pushgateway:这是URL的主location,发送到哪个URL
-
job/pushgateway:表示是推送到哪个prometheus定义的job里面,上面我们定义的job_name为pushgateway
-
instance/$instance_name:表示推送后显示的主机名称是什么,从上面pushgateway图也可以看出
需要周期不断地收集该指标数据,当然免不了使用crontab,脚本配合crontab即可发挥强大功效。下面可以配置每5s收集一次该指标数据,又得写个脚本了,如下:
[root@node02 node_exporter]# vim tcp_establish.sh
#!/bin/bash
#每5秒钟刷新一次
step=5
for (( i = 0; i < 60; i=(i+step) )); do
    /bin/sh /usr/local/node_exporter/tcp_establish.sh
    sleep $step
done
[root@node02 node_exporter]# crontab -e
* * * * * /bin/sh /usr/local/node_exporter/crontab_tcp.sh
四、使用pushgateway的优缺点
这里也有官方的英文解释说明:https://prometheus.io/docs/practices/pushing/ ,总体来说主要下面2点:
-
(1)pushgateway是一个单点的瓶颈,如果有多个脚本同时发送给一个pushgateway的进程,如果该进程挂掉的话,那么监控数据也就木有了。
-
(2)pushgateway不能对发送过来的数据进行智能化判断,如果脚本中间采集有问题,那么pushgateway是会照单全收的发送给prometheus server

 浙公网安备 33010602011771号