Kubernetes学习之路(二十四)之Prometheus监控
1、Prometheus概述
除了前面的资源指标(如CPU、内存)以外,用户或管理员需要了解更多的指标数据,比如Kubernetes指标、容器指标、节点资源指标以及应用程序指标等等。自定义指标API允许请求任意的指标,其指标API的实现要指定相应的后端监视系统。而Prometheus是第一个开发了相应适配器的监控系统。这个适用于Prometheus的Kubernetes Customm Metrics Adapter是属于Github上的k8s-prometheus-adapter项目提供的。其原理图如下:
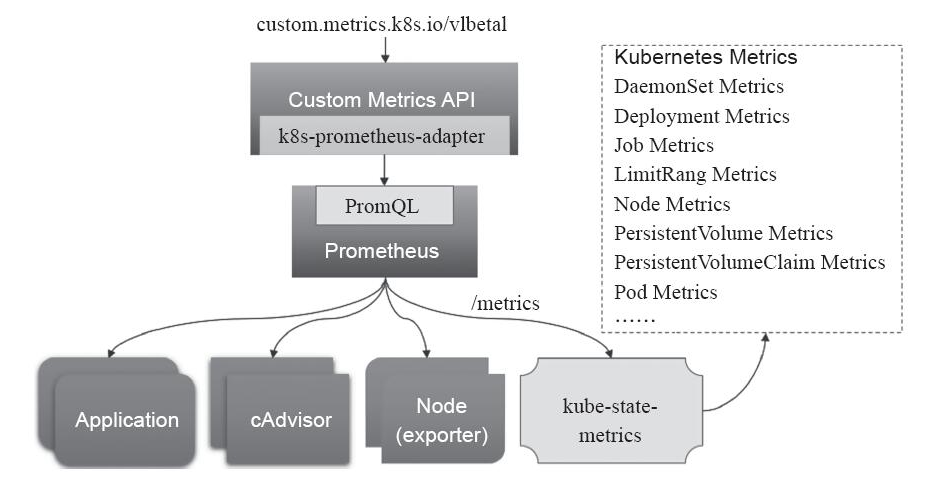
要知道的是prometheus本身就是一监控系统,也分为server端和agent端,server端从被监控主机获取数据,而agent端需要部署一个node_exporter,主要用于数据采集和暴露节点的数据,那么 在获取Pod级别或者是mysql等多种应用的数据,也是需要部署相关的exporter。我们可以通过PromQL的方式对数据进行查询,但是由于本身prometheus属于第三方的 解决方案,原生的k8s系统并不能对Prometheus的自定义指标进行解析,就需要借助于k8s-prometheus-adapter将这些指标数据查询接口转换为标准的Kubernetes自定义指标。
Prometheus是一个开源的服务监控系统和时序数据库,其提供了通用的数据模型和快捷数据采集、存储和查询接口。它的核心组件Prometheus服务器定期从静态配置的监控目标或者基于服务发现自动配置的目标中进行拉取数据,新拉取到啊的 数据大于配置的内存缓存区时,数据就会持久化到存储设备当中。Prometheus组件架构图如下:

如上图,每个被监控的主机都可以通过专用的exporter程序提供输出监控数据的接口,并等待Prometheus服务器周期性的进行数据抓取。如果存在告警规则,则抓取到数据之后会根据规则进行计算,满足告警条件则会生成告警,并发送到Alertmanager完成告警的汇总和分发。当被监控的目标有主动推送数据的需求时,可以以Pushgateway组件进行接收并临时存储数据,然后等待Prometheus服务器完成数据的采集。
任何被监控的目标都需要事先纳入到监控系统中才能进行时序数据采集、存储、告警和展示,监控目标可以通过配置信息以静态形式指定,也可以让Prometheus通过服务发现的机制进行动态管理。下面是组件的一些解析:
- 监控代理程序:如node_exporter:收集主机的指标数据,如平均负载、CPU、内存、磁盘、网络等等多个维度的指标数据。
- kubelet(cAdvisor):收集容器指标数据,也是K8S的核心指标收集,每个容器的相关指标数据包括:CPU使用率、限额、文件系统读写限额、内存使用率和限额、网络报文发送、接收、丢弃速率等等。
- API Server:收集API Server的性能指标数据,包括控制队列的性能、请求速率和延迟时长等等
- etcd:收集etcd存储集群的相关指标数据
- kube-state-metrics:该组件可以派生出k8s相关的多个指标数据,主要是资源类型相关的计数器和元数据信息,包括制定类型的对象总数、资源限额、容器状态以及Pod资源标签系列等。
Prometheus 能够 直接 把 Kubernetes API Server 作为 服务 发现 系统 使用 进而 动态 发现 和 监控 集群 中的 所有 可被 监控 的 对象。 这里 需要 特别 说明 的 是, Pod 资源 需要 添加 下列 注解 信息 才 能被 Prometheus 系统 自动 发现 并 抓取 其 内建 的 指标 数据。
- 1) prometheus. io/ scrape: 用于 标识 是否 需要 被 采集 指标 数据, 布尔 型 值, true 或 false。
- 2) prometheus. io/ path: 抓取 指标 数据 时 使用 的 URL 路径, 一般 为/ metrics。
- 3) prometheus. io/ port: 抓取 指标 数据 时 使 用的 套 接 字 端口, 如 8080。
另外, 仅 期望 Prometheus 为 后端 生成 自定义 指标 时 仅 部署 Prometheus 服务器 即可, 它 甚至 也不 需要 数据 持久 功能。 但 若要 配置 完整 功能 的 监控 系统, 管理员 还需 要在 每个 主机 上 部署 node_ exporter、 按 需 部署 其他 特有 类型 的 exporter 以及 Alertmanager。
2、Prometheus部署
由于官方的YAML部署方式需要使用到PVC,这里使用马哥提供的学习类型的部署,具体生产还是需要根据官方的建议进行。本次部署的YAML
2.1、创建名称空间prom
[root@k8s-master ~]# git clone https://github.com/iKubernetes/k8s-prom.git && cd k8s-prom
[root@k8s-master k8s-prom]# kubectl apply -f namespace.yaml
namespace/prom created
2.2、部署node_exporter
[root@k8s-master k8s-prom]# kubectl apply -f node_exporter/
daemonset.apps/prometheus-node-exporter created
service/prometheus-node-exporter created

[root@k8s-master k8s-prom]# kubectl get pods -n prom
NAME                             READY     STATUS    RESTARTS   AGE
prometheus-node-exporter-6srrq   1/1       Running   0          32s
prometheus-node-exporter-fftmc   1/1       Running   0          32s
prometheus-node-exporter-qlr8d   1/1       Running   0          32s
2.3、部署prometheus-server
[root@k8s-master k8s-prom]# kubectl apply -f prometheus/
configmap/prometheus-config unchanged
deployment.apps/prometheus-server configured
clusterrole.rbac.authorization.k8s.io/prometheus configured
serviceaccount/prometheus unchanged
clusterrolebinding.rbac.authorization.k8s.io/prometheus configured
service/prometheus unchanged


[root@k8s-master k8s-prom]# kubectl get all -n prom
NAME                                    READY     STATUS    RESTARTS   AGE
pod/prometheus-node-exporter-6srrq      1/1       Running   0          11m
pod/prometheus-node-exporter-fftmc      1/1       Running   0          11m
pod/prometheus-node-exporter-qlr8d      1/1       Running   0          11m
pod/prometheus-server-66cbd4c6b-j9lqr   1/1       Running   0          4m

NAME                               TYPE        CLUSTER-IP    EXTERNAL-IP   PORT(S)          AGE
service/prometheus                 NodePort    10.96.65.72   <none>        9090:30090/TCP   10m
service/prometheus-node-exporter   ClusterIP   None          <none>        9100/TCP         11m

NAME                                      DESIRED   CURRENT   READY     UP-TO-DATE   AVAILABLE   NODE SELECTOR   AGE
daemonset.apps/prometheus-node-exporter   3         3         3         3            3           <none>          11m

NAME                                DESIRED   CURRENT   UP-TO-DATE   AVAILABLE   AGE
deployment.apps/prometheus-server   1         1         1            1           10m

NAME                                           DESIRED   CURRENT   READY     AGE
replicaset.apps/prometheus-server-65f5d59585   0         0         0         10m
replicaset.apps/prometheus-server-66cbd4c6b    1         1         1         4m
2.4、部署kube-sate-metrics
[root@k8s-master k8s-prom]# kubectl apply -f kube-state-metrics/
deployment.apps/kube-state-metrics created
serviceaccount/kube-state-metrics created
clusterrole.rbac.authorization.k8s.io/kube-state-metrics created
clusterrolebinding.rbac.authorization.k8s.io/kube-state-metrics created
service/kube-state-metrics created

[root@k8s-master k8s-prom]# kubectl get pods -n prom -o wide
NAME                                  READY     STATUS    RESTARTS   AGE       IP              NODE
kube-state-metrics-78fc9fc745-g66p8   1/1       Running   0          11m       10.244.1.22     k8s-node01
prometheus-node-exporter-6srrq        1/1       Running   0          31m       192.168.56.11   k8s-master
prometheus-node-exporter-fftmc        1/1       Running   0          31m       192.168.56.12   k8s-node01
prometheus-node-exporter-qlr8d        1/1       Running   0          31m       192.168.56.13   k8s-node02
prometheus-server-66cbd4c6b-j9lqr     1/1       Running   0          24m       10.244.0.4      k8s-master
2.5、制作证书
[root@k8s-master pki]# (umask 077; openssl genrsa -out serving.key 2048)
Generating RSA private key, 2048 bit long modulus
......................+++
....+++
e is 65537 (0x10001)
[root@k8s-master pki]# openssl req -new -key serving.key -out serving.csr -subj "/CN=serving"
[root@k8s-master pki]# openssl x509 -req -in serving.csr -CA ./ca.crt -CAkey ./ca.key -CAcreateserial -out serving.crt -days 3650
Signature ok
subject=/CN=serving
Getting CA Private Key

[root@k8s-master pki]# kubectl create secret generic cm-adapter-serving-certs --from-file=serving.crt=./serving.crt --from-file=serving.key -n prom
secret/cm-adapter-serving-certs created

[root@k8s-master pki]# kubectl get secret -n prom
NAME                             TYPE                                  DATA      AGE
cm-adapter-serving-certs         Opaque                                2         20s
2.6、部署k8s-prometheus-adapter
这里自带的custom-metrics-apiserver-deployment.yaml和custom-metrics-config-map.yaml有点问题,需要下载k8s-prometheus-adapter项目中的这2个文件
[root@k8s-master k8s-prometheus-adapter]# wget https://raw.githubusercontent.com/DirectXMan12/k8s-prometheus-adapter/master/deploy/manifests/custom-metrics-apiserver-deployment.yaml

[root@k8s-master k8s-prometheus-adapter]# vim k8s-prometheus-adapter/custom-metrics-apiserver-deployment.yaml #修改名称空间为prom

[root@k8s-master k8s-prometheus-adapter]# wget https://raw.githubusercontent.com/DirectXMan12/k8s-prometheus-adapter/master/deploy/manifests/custom-metrics-config-map.yaml  #也需要修改名称空间为prom

[root@k8s-master k8s-prom]# kubectl apply -f k8s-prometheus-adapter/
clusterrolebinding.rbac.authorization.k8s.io/custom-metrics:system:auth-delegator created
rolebinding.rbac.authorization.k8s.io/custom-metrics-auth-reader created
deployment.apps/custom-metrics-apiserver created
clusterrolebinding.rbac.authorization.k8s.io/custom-metrics-resource-reader created
serviceaccount/custom-metrics-apiserver created
service/custom-metrics-apiserver created
apiservice.apiregistration.k8s.io/v1beta1.custom.metrics.k8s.io created
clusterrole.rbac.authorization.k8s.io/custom-metrics-server-resources created
clusterrole.rbac.authorization.k8s.io/custom-metrics-resource-reader created
clusterrolebinding.rbac.authorization.k8s.io/hpa-controller-custom-metrics created
configmap/adapter-config created

[root@k8s-master k8s-prom]# kubectl get pods -n prom
NAME                                       READY     STATUS    RESTARTS   AGE
custom-metrics-apiserver-65f545496-l5md9   1/1       Running   0          7m
kube-state-metrics-78fc9fc745-g66p8        1/1       Running   0          40m
prometheus-node-exporter-6srrq             1/1       Running   0          1h
prometheus-node-exporter-fftmc             1/1       Running   0          1h
prometheus-node-exporter-qlr8d             1/1       Running   0          1h
prometheus-server-66cbd4c6b-j9lqr          1/1       Running   0          53m

[root@k8s-master k8s-prom]# kubectl api-versions |grep custom
custom.metrics.k8s.io/v1beta1

[root@k8s-master ~]# kubectl get svc -n  prom
NAME                       TYPE        CLUSTER-IP      EXTERNAL-IP   PORT(S)          AGE
custom-metrics-apiserver   ClusterIP   10.99.14.141    <none>        443/TCP          11h
kube-state-metrics         ClusterIP   10.107.23.237   <none>        8080/TCP         11h
prometheus                 NodePort    10.96.65.72     <none>        9090:30090/TCP   11h
prometheus-node-exporter   ClusterIP   None            <none>        9100/TCP         11h
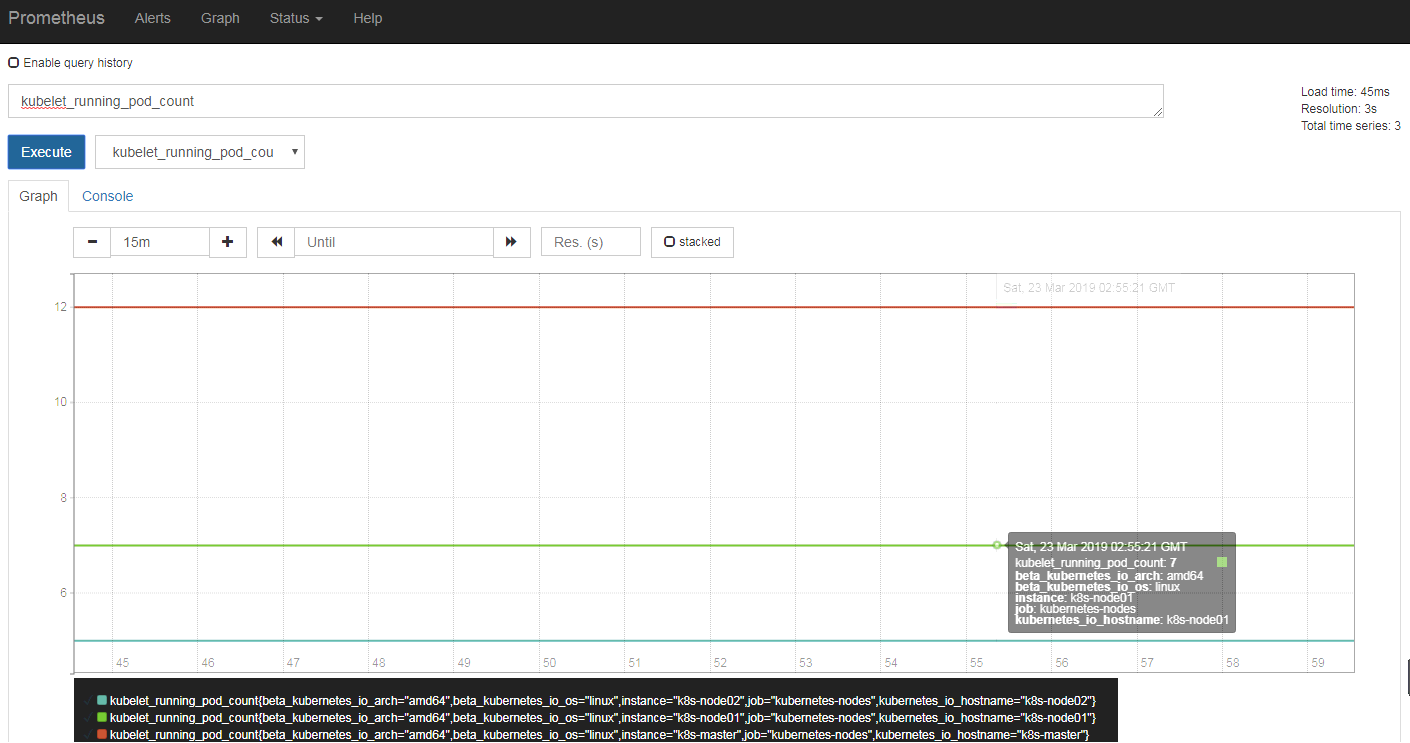
访问192.168.56.11:30090,如下图:选择 需要查看的指标,点击Execute
3、Grafana数据展示
[root@k8s-master k8s-prom]# cat grafana.yaml
apiVersion: apps/v1
kind: Deployment
metadata:
  name: monitoring-grafana
  namespace: prom    #修改名称空间
spec:
  replicas: 1
  selector:
    matchLabels:
      task: monitoring
      k8s-app: grafana
  template:
    metadata:
      labels:
        task: monitoring
        k8s-app: grafana
    spec:
      containers:
      - name: grafana
        image: registry.cn-hangzhou.aliyuncs.com/google_containers/heapster-grafana-amd64:v5.0.4
        ports:
        - containerPort: 3000
          protocol: TCP
        volumeMounts:
        - mountPath: /etc/ssl/certs
          name: ca-certificates
          readOnly: true
        - mountPath: /var
          name: grafana-storage
        env:    #这里使用的是原先的heapster的grafana的配置文件,需要注释掉这个环境变量
        #- name: INFLUXDB_HOST
        #  value: monitoring-influxdb
        - name: GF_SERVER_HTTP_PORT
          value: "3000"
          # The following env variables are required to make Grafana accessible via
          # the kubernetes api-server proxy. On production clusters, we recommend
          # removing these env variables, setup auth for grafana, and expose the grafana
          # service using a LoadBalancer or a public IP.
        - name: GF_AUTH_BASIC_ENABLED
          value: "false"
        - name: GF_AUTH_ANONYMOUS_ENABLED
          value: "true"
        - name: GF_AUTH_ANONYMOUS_ORG_ROLE
          value: Admin
        - name: GF_SERVER_ROOT_URL
          # If you're only using the API Server proxy, set this value instead:
          # value: /api/v1/namespaces/kube-system/services/monitoring-grafana/proxy
          value: /
      volumes:
      - name: ca-certificates
        hostPath:
          path: /etc/ssl/certs
      - name: grafana-storage
        emptyDir: {}
---
apiVersion: v1
kind: Service
metadata:
  labels:
    # For use as a Cluster add-on (https://github.com/kubernetes/kubernetes/tree/master/cluster/addons)
    # If you are NOT using this as an addon, you should comment out this line.
    kubernetes.io/cluster-service: 'true'
    kubernetes.io/name: monitoring-grafana
  name: monitoring-grafana
  namespace: prom
spec:
  # In a production setup, we recommend accessing Grafana through an external Loadbalancer
  # or through a public IP.
  # type: LoadBalancer
  # You could also use NodePort to expose the service at a randomly-generated port
  type: NodePort
  ports:
  - port: 80
    targetPort: 3000
  selector:
    k8s-app: grafana

[root@k8s-master k8s-prom]# kubectl apply -f grafana.yaml
deployment.apps/monitoring-grafana created
service/monitoring-grafana created

[root@k8s-master k8s-prom]# kubectl get pods -n prom
NAME                                       READY     STATUS    RESTARTS   AGE
custom-metrics-apiserver-65f545496-l5md9   1/1       Running   0          16m
kube-state-metrics-78fc9fc745-g66p8        1/1       Running   0          49m
monitoring-grafana-7c94886cd5-dhcqz        1/1       Running   0          36s
prometheus-node-exporter-6srrq             1/1       Running   0          1h
prometheus-node-exporter-fftmc             1/1       Running   0          1h
prometheus-node-exporter-qlr8d             1/1       Running   0          1h
prometheus-server-66cbd4c6b-j9lqr          1/1       Running   0          1h

[root@k8s-master k8s-prom]# kubectl get svc -n prom
NAME                       TYPE        CLUSTER-IP      EXTERNAL-IP   PORT(S)          AGE
custom-metrics-apiserver   ClusterIP   10.99.14.141    <none>        443/TCP          11h
kube-state-metrics         ClusterIP   10.107.23.237   <none>        8080/TCP         11h
monitoring-grafana         NodePort    10.98.174.125   <none>        80:30582/TCP     10h
prometheus                 NodePort    10.96.65.72     <none>        9090:30090/TCP   11h
prometheus-node-exporter   ClusterIP   None            <none>        9100/TCP         11h
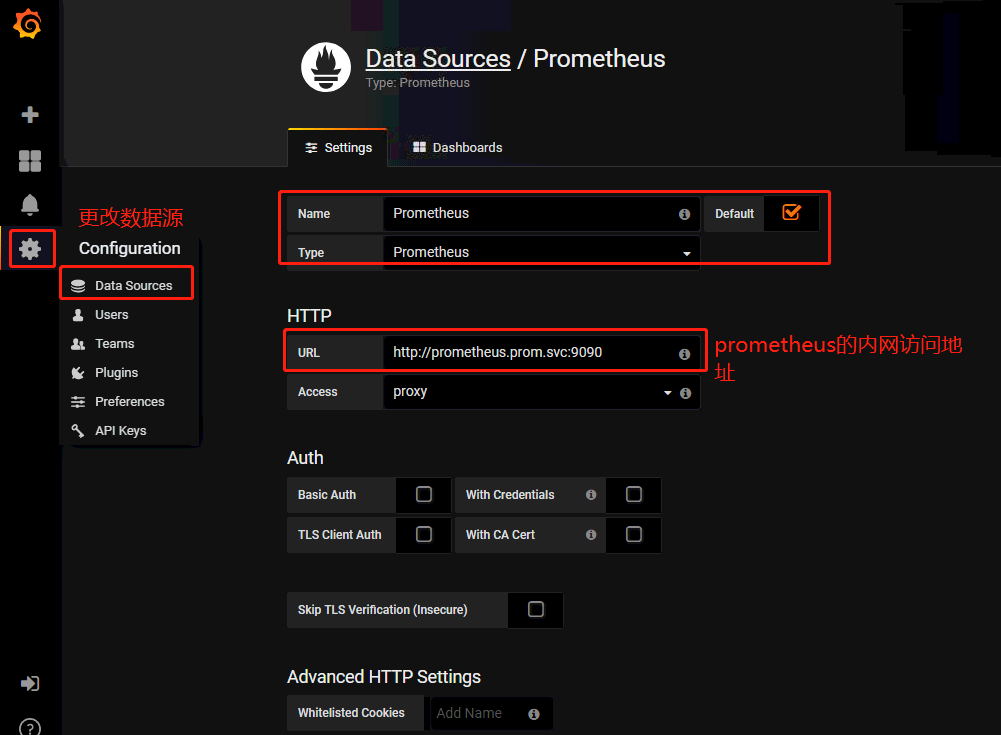
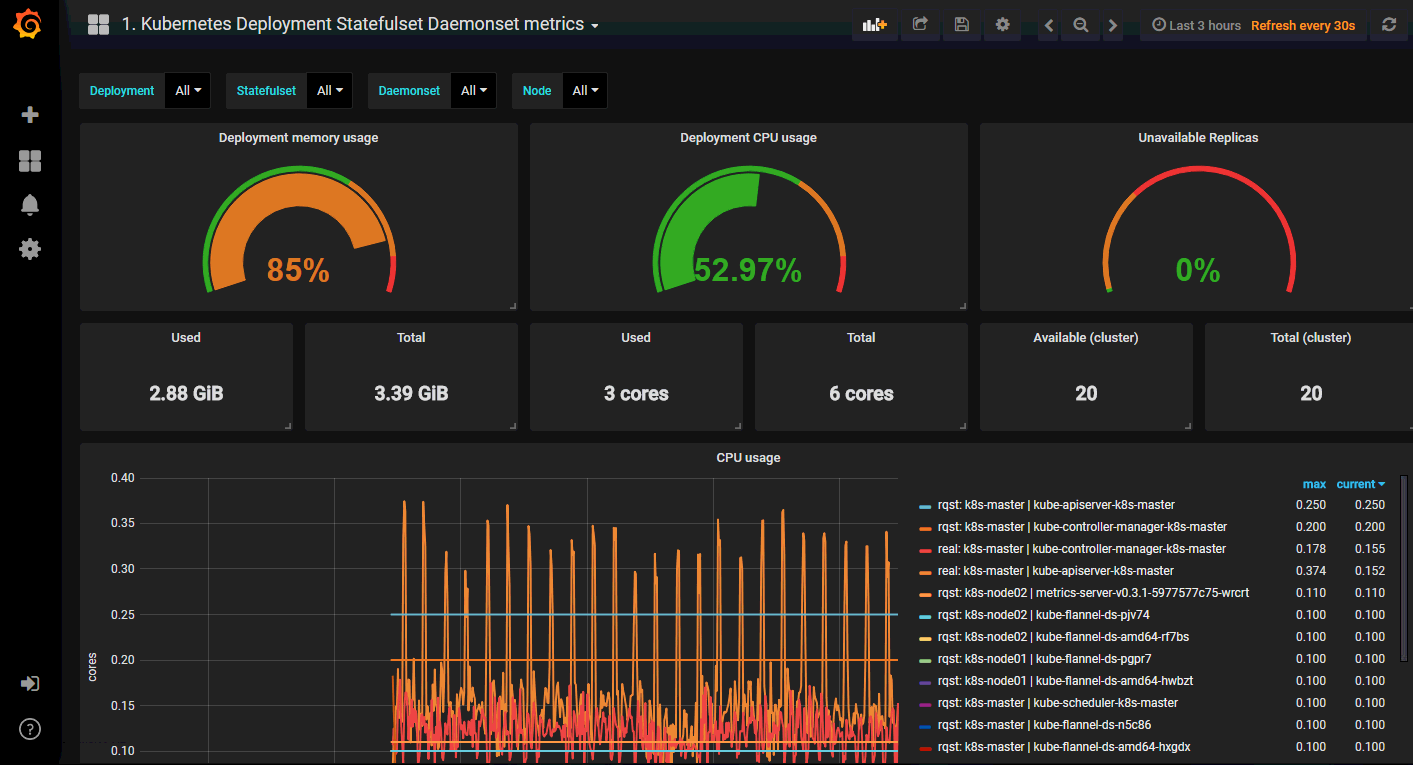
访问grafana的地址:192.168.56.11:30582,默认是没有kubernetes的模板的,可以到grafana.com中去下载相关的kubernetes模板。

 浙公网安备 33010602011771号