

qml与html通信
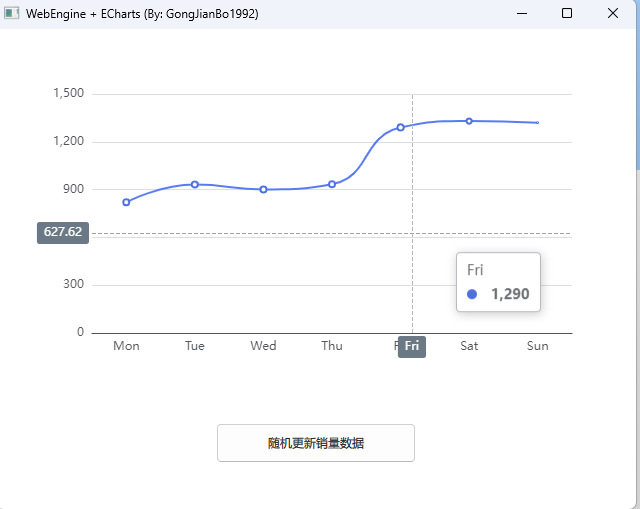
1. 在qml显示html并通讯
main.qml
import QtQuick 2.12
import QtQuick.Window 2.12
import QtWebEngine 1.2
import QtQuick.Controls
Window {
    id:mainWindow
    width: 640
    height: 480
    visible: true
    title: qsTr("WebEngine + ECharts (By: GongJianBo1992)")
    Column {
        anchors.fill: parent
        spacing: 10
        Rectangle {
           height: mainWindow.height * 0.8  // 占 80% 高度
            width: mainWindow.width
            WebEngineView{
                id: webView
                anchors.fill: parent
                //@disable-check M7
                url:"file:///./test.html"
            }
        }
         Button {
            text: "随机更新销量数据"
            width: 200
            height: 40
            anchors.horizontalCenter: parent.horizontalCenter
            onClicked: {
                // 生成随机数据(5个10-100的整数)
                let newData = [];
                for (let i = 0; i < 5; i++) {
                    newData.push(Math.floor(Math.random() * 90 + 10));
                }
                webView.runJavaScript("updateData(" + JSON.stringify(newData) + ")");

            }
        }
    }
}
html
<!DOCTYPE html>
<html>
<head>
    <meta charset="UTF-8">
    <title>ECharts in QML</title>
    <!-- 引入 ECharts -->
    <script src="echarts.min.js"></script>
    <style>
        body { margin: 0; overflow: hidden; }  /* 去除边距和滚动条 */
        #chartContainer { width: 100vw; height: 100vh; }  /* 占满整个视图 */
    </style>
</head>
<body>
    <div id="chartContainer"></div>
    <script>
        // 初始化图表
        const chartDom = document.getElementById('chartContainer');
        const myChart = echarts.init(chartDom);
        let option = {
          xAxis: {
            type: 'category',
            data: ['Mon', 'Tue', 'Wed', 'Thu', 'Fri', 'Sat', 'Sun']
          },
          yAxis: {
            type: 'value'
          },
           dataZoom: {
            type: 'inside',  //放大缩小x轴数值
        },
          tooltip: {
            trigger: 'axis',
            axisPointer: {
              type: 'cross',
              label: {
                backgroundColor: '#6a7985'
              }
            }
          },
          series: [
            {
              data: [820, 932, 901, 934, 1290, 1330, 1320],
              type: 'line',
              smooth: true
            }
          ]
        };
        myChart.setOption(option);

        // 供 QML 调用的更新函数
        function updateData(newData) {
            option.series[0].data = newData;
            myChart.setOption(option);
        }

        // 窗口大小变化时自适应
        window.onresize = () => myChart.resize();
    </script>
</body>
</html>
python
import sys
from PySide6 import  QtWidgets, QtQml
from PySide6.QtGui import QGuiApplication
import PySide6.QtWebEngineCore

if __name__ == "__main__":
    # app = QGuiApplication().instance()
    app = QtWidgets.QApplication(sys.argv)
    engine = QtQml.QQmlApplicationEngine()
    engine.load("main.qml")
    if not engine.rootObjects():
        sys.exit(-1)

    sys.exit(app.exec())

 浙公网安备 33010602011771号