


原文参考:How to customize the tooltips displayed in the chart
图表提示信息可以定制在鼠标悬停在图表上或者点击图表时显示,也可以设置成不显示提示内容,具体代码参考下列设置。
点击图表显示提示信息:
this.UltraChart1.Tooltips.Display= Infragistics.UltraChart.Shared.Styles.TooltipDisplay.MouseClick;
悬停时显示提示信息:
this.UltraChart1.Tooltips.Display= Infragistics.UltraChart.Shared.Styles.TooltipDisplay.MouseMove;
不显示提示信息:
this.UltraChart1.Tooltips.Display= Infragistics.UltraChart.Shared.Styles.TooltipDisplay.Never;
当设置鼠标在图表上悬停时以显示信息提示时,提示内容可以是轴标签值与数据值,或者是设置成行列号与数据值,也可以自定义提示内容。参考以下代码:
显示轴标签值与数据值:
this.UltraChart1.Tooltips.Format = Infragistics.UltraChart.Shared.Styles.TooltipStyle.LabelPlusDataValue;
显示行列号与数据值:
this.UltraChart1.Tooltips.Format = Infragistics.UltraChart.Shared.Styles.TooltipStyle.RowColumnPlusDataValue;
自定义图表提示内容:
this.UltraChart1.Tooltips.Format=Infragistics.UltraChart.Shared.Styles.TooltipStyle.Custom;
this.UltraChart1.Tooltips.FormatString="tooltip";
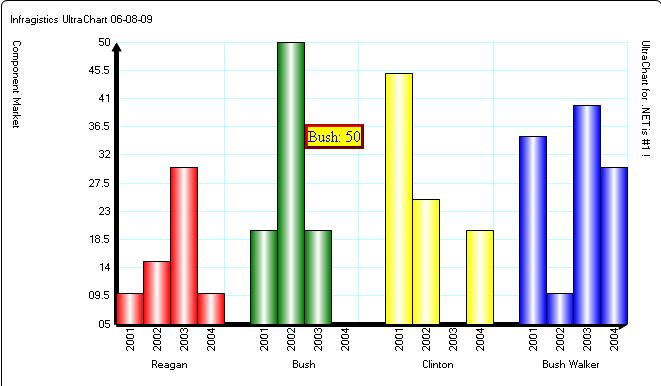
以上我们提到了自定义图表提示信息的若干设置,实际上我们还可以控制提示信息的外观,包括背景色、字体大小、文字颜色等,参考以下代码:
this.UltraChart1.Tooltips.BackColor=System.Drawing.Color.Yellow;
this.UltraChart1.Tooltips.FontColor=System.Drawing.Color.Blue;
this.UltraChart1.Tooltips.BorderColor=System.Drawing.Color.Red;
this.UltraChart1.Tooltips.BorderThickness=3;
最终生成效果参见图1

 浙公网安备 33010602011771号