CentOS8.2安装Java 14.0.2
Java是一种安全,稳定且广为人知的通用编程语言和计算技术平台,具有许多相互关联的功能。
要运行基于Java的应用程序,必须在服务器上安装Java。您通常需要Java Runtime Environment(JRE),这是用于在Linux机器上运行Java应用程序的软件组件的集合。
如果要开发Java的软件应用程序,则需要安装Oracle Java开发工具包(JDK),该工具包带有一个完整的JRE软件包,其中包含用于开发,调试和监视Java应用程序的工具,它是Oracle支持的Java SE(标准版)版本。
注意:如果您正在寻找开放源代码和免费的JDK版本,请安装OpenJDK,它在GPL许可下提供与Oracle JDK相同的功能和性能。
在撰写本文时,OpenJDK 11是要使用默认存储库中的以下命令安装的Java的当前LTS版本:
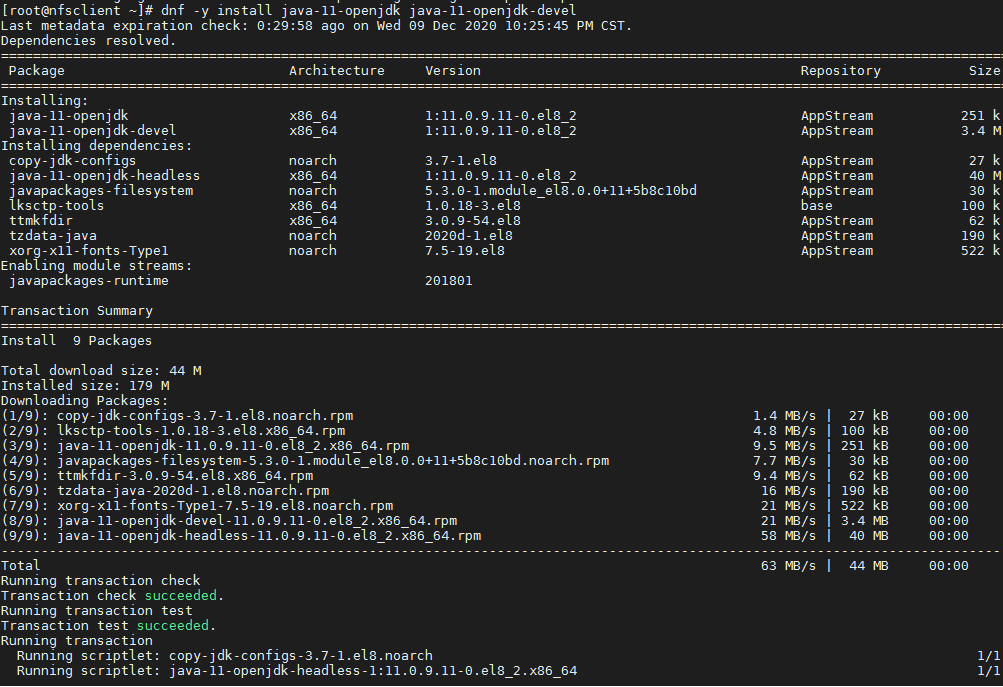
[1] 安装[java-11-openjdk]包,
如果需要编译器,也要安装[java-11-openjdk-devel]包。
[root@nfsclient ~]# dnf -y install java-11-openjdk java-11-openjdk-devel
Last metadata expiration check: 0:29:58 ago on Wed 09 Dec 2020 10:25:45 PM CST.
Dependencies resolved.
==============================================================================================================================
Package Architecture Version Repository Size
==============================================================================================================================
Installing:
java-11-openjdk x86_64 1:11.0.9.11-0.el8_2 AppStream 251 k
java-11-openjdk-devel x86_64 1:11.0.9.11-0.el8_2 AppStream 3.4 M
Installing dependencies:
copy-jdk-configs noarch 3.7-1.el8 AppStream 27 k
java-11-openjdk-headless x86_64 1:11.0.9.11-0.el8_2 AppStream 40 M
javapackages-filesystem noarch 5.3.0-1.module_el8.0.0+11+5b8c10bd AppStream 30 k
lksctp-tools x86_64 1.0.18-3.el8 base 100 k
ttmkfdir x86_64 3.0.9-54.el8 AppStream 62 k
tzdata-java noarch 2020d-1.el8 AppStream 190 k
xorg-x11-fonts-Type1 noarch 7.5-19.el8 AppStream 522 k
Enabling module streams:
javapackages-runtime 201801
Transaction Summary
==============================================================================================================================
[root@nfsclient ~]# java --version
openjdk 11.0.9 2020-10-20 LTS
OpenJDK Runtime Environment 18.9 (build 11.0.9+11-LTS)
OpenJDK 64-Bit Server VM 18.9 (build 11.0.9+11-LTS, mixed mode, sharing)
# verify to create test program
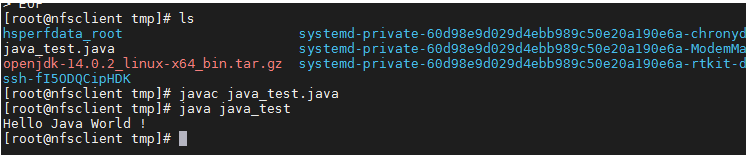
[root@nfsclient ~]# cat >/tmp/java_test.java<<EOF
class java_test {
public static void main(String[] args) {
System.out.println("Hello Java World !");
}
}
EOF
[root@dlp ~]# javac java_test.java
[root@dlp ~]# java java_test
Hello Java World !
如果你从CentOS官方存储库中安装了多个版本的Java,你可以用其他的方法来切换它们。
[root@nfsclient ~]# java --version
openjdk 11.0.5 2019-10-15 LTS
OpenJDK Runtime Environment 18.9 (build 11.0.5+10-LTS)
OpenJDK 64-Bit Server VM 18.9 (build 11.0.5+10-LTS, mixed mode, sharing)
[root@dlp ~]# javac --version
javac 11.0.5
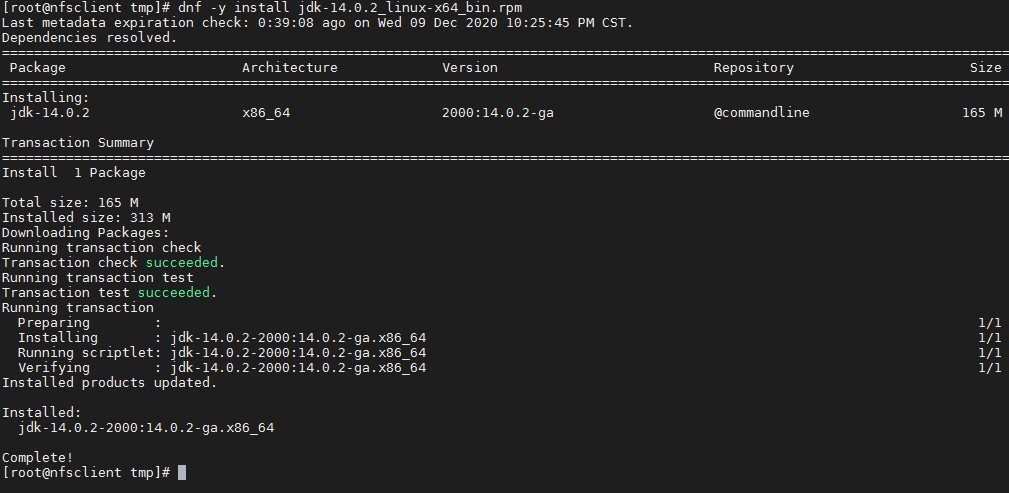
[2]安装 jdk-14.0.2_linux-x64_bin.rpm
[root@nfsclient tmp]# dnf -y install jdk-14.0.2_linux-x64_bin.rpm
[root@nfsclient tmp]# java --version
java 14.0.2 2020-07-14
Java(TM) SE Runtime Environment (build 14.0.2+12-46)
Java HotSpot(TM) 64-Bit Server VM (build 14.0.2+12-46, mixed mode, sharing)
[root@nfsclient tmp]# cat >/etc/profile.d/jdk14.sh <<EOF
export JAVA_HOME=/usr/java/default
export PATH=\$PATH:\$JAVA_HOME/bin
EOF
To use Java Home, source the file.
[root@nfsclient tmp]# source /etc/profile.d/jdk14.sh
测试Java安装。
为了测试我们的Java安装,让我们创建一个简单的html文件。创建一个test.java文件,其内容如下
[root@nfsclient ~]# cat >/tmp/HelloWorld.java<<EOF
public class HelloWorld {
public static void main(String[] args) {
System.out.println(“Hello, world”);
}
}
EOF
[root@nfsclient ~]# cat >/tmp/java_test01.java<<EOF
class java_test {
public static void main(String[] args) {
System.out.println("Hello Java World !");
}
}
EOF
[root@nfsclient ~]#javac java_test01.java
[root@nfsclient ~]# java java_test01
Hello Java World !
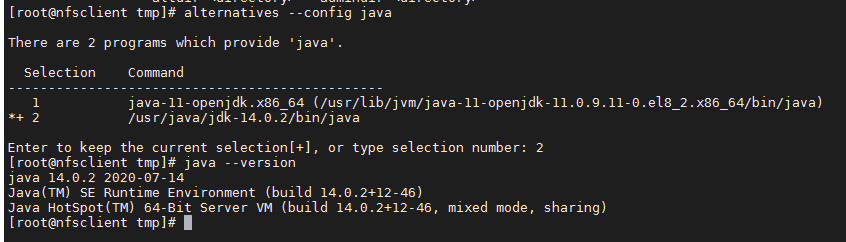
如果你从CentOS官方存储库中安装了多个版本的Java,你可以用其他的方法来切换它们。
[root@nfsclient tmp]# alternatives --config java
There are 2 programs which provide 'java'.
Selection Command
-----------------------------------------------
1 java-11-openjdk.x86_64 (/usr/lib/jvm/java-11-openjdk-11.0.9.11-0.el8_2.x86_64/bin/java)
*+ 2 /usr/java/jdk-14.0.2/bin/java
Enter to keep the current selection[+], or type selection number: 2
[root@nfsclient ~]#alternatives --config javac
[root@nfsclient ~]# alternatives --install /usr/bin/javac javac /usr/java/jdk-14.0.2/bin/javac 100
[root@nfsclient tmp]# alternatives --config javac
There are 2 programs which provide 'javac'.
Selection Command
-----------------------------------------------
1 java-11-openjdk.x86_64 (/usr/lib/jvm/java-11-openjdk-11.0.9.11-0.el8_2.x86_64/bin/javac)
*+ 2 /usr/java/jdk-14.0.2/bin/javac
Enter to keep the current selection[+], or type selection number:
Home » DevOps and Development » How to Install ELK Stack (Elasticsearch, Logstash, and Kibana) on Ubuntu 18.04 / 20.04
Contents
Introduction
The ELK stack is a set of applications for retrieving and managing log files.
It is a collection of three open-source tools, Elasticsearch, Kibana, and Logstash. The stack can be further upgraded with Beats, a lightweight plugin for aggregating data from different data streams.
In this tutorial, learn how to install the ELK software stack on Ubuntu 18.04 / 20.04.
Tutorial on how to install ELK stack on Ubuntu 18.04 / 20.04
Prerequisites
A Linux system running Ubuntu 20.04 or 18.04
Access to a terminal window/command line (Search > Terminal)
A user account with sudo or root privileges
Java version 8 or 11 (required for Logstash)
Step 1: Install Dependencies
Install Java
The ELK stack requires Java 8 to be installed. Some components are compatible with Java 9, but not Logstash.
Note: To check your Java version, enter the following:
java -version
The output you are looking for is 1.8.x_xxx. That would indicate that Java 8 is installed.
If you already have Java 8 installed, skip to Install Nginx.
- If you don’t have Java 8 installed, install it by opening a terminal window and entering the following:
sudo apt-get install openjdk-8-jdk
- If prompted, type y and hit Enter for the process to finish.
Install Java JDK 8 as a prerequisite for the ELK stack.
Install Nginx
Nginx works as a web server and proxy server. It’s used to configure password-controlled access to the Kibana dashboard.
- Install Nginx by entering the following:
sudo apt-get install nginx
- If prompted, type y and hit Enter for the process to finish.
Install Nginx on Ubuntu to set it up as a reverse proxy for Kibana.
Note: For additional tutorials, follow our guides on installing Nginx on Ubuntu and setting up Nginx reverse proxy For Kibana
Step 2: Add Elastic Repository
Elastic repositories enable access to all the open-source software in the ELK stack. To add them, start by importing the GPG key.
- Enter the following into a terminal window to import the PGP key for Elastic:
wget -qO - https://artifacts.elastic.co/GPG-KEY-elasticsearch | sudo apt-key add -
- The system should respond with OK, as seen in the image below.
Add Elasticsearch repository.
- Next, install the apt-transport-https package:
sudo apt-get install apt-transport-https
- Add the Elastic repository to your system’s repository list:
echo "deb https://artifacts.elastic.co/packages/7.x/apt stable main" | sudo tee –a /etc/apt/sources.list.d/elastic-7.x.list
Add elastic repository to your system's repository list.
Step 3: Install Elasticsearch
- Prior to installing Elasticsearch, update the repositories by entering:
sudo apt-get update
- Install Elasticsearch with the following command:
sudo apt-get install elasticsearch
Command to install Elasticsearch via Linux terminal.
Configure Elasticsearch
- Elasticsearch uses a configuration file to control how it behaves. Open the configuration file for editing in a text editor of your choice. We will be using nano:
sudo nano /etc/elasticsearch/elasticsearch.yml
- You should see a configuration file with several different entries and descriptions. Scroll down to find the following entries:
network.host: 192.168.0.1
http.port: 9200
- Uncomment the lines by deleting the hash (#) sign at the beginning of both lines and replace 192.168.0.1 with localhost.
It should read:
network.host: localhost
http.port: 9200
An image of how to configure the Elasticsearch configuration file.
4. Just below, find the Discovery section. We are adding one more line, as we are configuring a single node cluster:
discovery.type: single-node
For further details, see the image below.
Configuring Elasticsearch as a single-node cluster.
5. By default, JVM heap size is set at 1GB. We recommend setting it to no more than half the size of your total memory. Open the following file for editing:
sudo nano /etc/elasticsearch/jvm.options
- Find the lines starting with -Xms and -Xmx. In the example below, the maximum (-Xmx) and minimum (-Xms) size is set to 512MB.
Limiting JVM heap size.
Start Elasticsearch
- Start the Elasticsearch service by running a systemctl command:
sudo systemctl start elasticsearch.service
It may take some time for the system to start the service. There will be no output if successful.
- Enable Elasticsearch to start on boot:
sudo systemctl enable elasticsearch.service
This command enables the Elasticsearch service on boot.
Test Elasticsearch
Use the curl command to test your configuration. Enter the following:
curl -X GET "localhost:9200"
The name of your system should display, and elasticsearch for the cluster name. This indicates that Elasticsearch is functional and is listening on port 9200.
This image indicates that the elasticsearch cluster is active.
Step 4: Install Kibana
It is recommended to install Kibana next. Kibana is a graphical user interface for parsing and interpreting collected log files.
- Run the following command to install Kibana:
sudo apt-get install kibana
- Allow the process to finish. Once finished, it’s time to configure Kibana.
Configure Kibana
- Next, open the kibana.yml configuration file for editing:
sudo nano /etc/kibana/kibana.yml
- Delete the # sign at the beginning of the following lines to activate them:
server.port: 5601
server.host: "your-hostname"
elasticsearch.hosts: ["http://localhost:9200"]
The above-mentioned lines should look as follows:
server.port: 5601
server.host: "localhost"
elasticsearch.hosts: ["http://localhost:9200"]
- Save the file (Ctrl+o) and exit (Ctrl+ x).
Configuring the Kibana configuration file.
Note: This configuration allows traffic from the same system Elasticstack is configured on. You can set the server.host value to the address of a remote server.
Start and Enable Kibana
- Start the Kibana service:
sudo systemctl start kibana
There is no output if the service starts successfully.
- Next, configure Kibana to launch at boot:
sudo systemctl enable kibana
The command to enable the Kibana service on Ubuntu and the expected output.
Allow Traffic on Port 5601
If the UFW firewall is enabled on your Ubuntu system, you need to allow traffic on port 5601 to access the Kibana dashboard.
In a terminal window, run the following command:
sudo ufw allow 5601/tcp
The following output should display:
Allow traffic on Kibana port.
Test Kibana
To access Kibana, open a web browser and browse to the following address:
The Kibana dashboard loads.
The Kibana dashboard welcome screen.
If you receive a “Kibana server not ready yet” error, check if the Elasticsearch and Kibana services are active.
Note: Check out our in-depth Kibana tutorial to learn everything you need to know visualization and data query.
Step 5: Install Logstash
Logstash is a tool that collects data from different sources. The data it collects is parsed by Kibana and stored in Elasticsearch.
Install Logstash by running the following command:
sudo apt-get install logstash
Start and Enable Logstash
- Start the Logstash service:
sudo systemctl start logstash
- Enable the Logstash service:
sudo systemctl enable logstash
- To check the status of the service, run the following command:
sudo systemctl status logstash
Check logstash system status
Configure Logstash
Logstash is a highly customizable part of the ELK stack. Once installed, configure its INPUT, FILTERS, and OUTPUT pipelines according to your own individual use case.
All custom Logstash configuration files are stored in /etc/logstash/conf.d/.
diagram showing How Logstash processes data
Note: Consider the following Logstash configuration examples and adjust the configuration for your needs.
Step 6: Install Filebeat
Filebeat is a lightweight plugin used to collect and ship log files. It is the most commonly used Beats module. One of Filebeat’s major advantages is that it slows down its pace if the Logstash service is overwhelmed with data.
Install Filebeat by running the following command:
sudo apt-get install filebeat
Let the installation complete.
Note: Make sure that the Kibana service is up and running during the installation and configuration procedure.
Configure Filebeat
Filebeat, by default, sends data to Elasticsearch. Filebeat can also be configured to send event data to Logstash.
- To configure this, edit the filebeat.yml configuration file:
sudo nano /etc/filebeat/filebeat.yml
- Under the Elasticsearch output section, comment out the following lines:
output.elasticsearch:
Array of hosts to connect to.
hosts: ["localhost:9200"]
- Under the Logstash output section, remove the hash sign (#) in the following two lines:
output.logstash
hosts: ["localhost:5044"]
It should look like this:
output.logstash
hosts: ["localhost:5044"]
For further details, see the image below.
How to configure the Filebeat configuration file.
4. Next, enable the Filebeat system module, which will examine local system logs:
sudo filebeat modules enable system
The output should read Enabled system.
- Next, load the index template:
sudo filebeat setup --index-management -E output.logstash.enabled=false -E 'output.elasticsearch.hosts=["localhost:9200"]'
The system will do some work, scanning your system and connecting to your Kibana dashboard.
Running the Filebeat setup.
Start and Enable Filebeat
Start and enable the Filebeat service:
sudo systemctl start filebeat
sudo systemctl enable filebeat
Verify Elasticsearch Reception of Data
Finally, verify if Filebeat is shipping log files to Logstash for processing. Once processed, data is sent to Elasticsearch.
curl -XGET http://localhost:9200/_cat/indices?v
example command to check if Filebeat logs are being sent to elasticsearch
Note: For further details on health status indicators, please see Elastic’s Cluster Health documentation.
Conclusion
Now you have a functional ELK stack installed on your Ubuntu system. We recommend defining your requirements and start adjusting ELK for your needs. This powerful monitoring tool can be customized for individual use cases.
Customize data streams with Logstash, use different Beats modules to gather various types of data, and utilize Kibana for easy browsing through log files.
Read our comprehensive Tutorial on ELK Stack to learn more and if you want to experiment with Docker, check out our ELK Stack on Docker guide.
curl -fsSL https://artifacts.elastic.co/GPG-KEY-elasticsearch | sudo apt-key add -
==================================
input { stdin { } }
filter {
grok {
match => { "message" => "%{COMBINEDAPACHELOG}" }
}
date {
match => [ "timestamp" , "dd/MMM/yyyy:HH:mm:ss Z" ]
}
}
output {
elasticsearch { hosts => ["localhost:9200"] }
stdout { codec => rubydebug }
}
bin/logstash -f logstash-filter.conf
=======================================
创建一个名为的配置文件02-beats-input.conf,您将在其中设置 Filebeat 输入
vim /etc/logstash/conf.d/02-beats-input.conf
input {
  beats {
    port => 5044
  }
}
vim /etc/logstash/conf.d/10-syslog-filter.conf
filter {
  if [fileset][module] == "system" {
    if [fileset][name] == "auth" {
      grok {
      	match => { "message" => ["%{SYSLOGTIMESTAMP:[system][auth][timestamp]} %{SYSLOGHOST:[system][auth][hostname]} sshd(?:\[%{POSINT:[system][auth][pid]}\])?: %{DATA:[system][auth][ssh][event]} %{DATA:[system][auth][ssh][method]} for (invalid user )?%{DATA:[system][auth][user]} from %{IPORHOST:[system][auth][ssh][ip]} port %{NUMBER:[system][auth][ssh][port]} ssh2(: %{GREEDYDATA:[system][auth][ssh][signature]})?",
      		"%{SYSLOGTIMESTAMP:[system][auth][timestamp]} %{SYSLOGHOST:[system][auth][hostname]} sshd(?:\[%{POSINT:[system][auth][pid]}\])?: %{DATA:[system][auth][ssh][event]} user %{DATA:[system][auth][user]} from %{IPORHOST:[system][auth][ssh][ip]}",
      		"%{SYSLOGTIMESTAMP:[system][auth][timestamp]} %{SYSLOGHOST:[system][auth][hostname]} sshd(?:\[%{POSINT:[system][auth][pid]}\])?: Did not receive identification string from %{IPORHOST:[system][auth][ssh][dropped_ip]}",
      		"%{SYSLOGTIMESTAMP:[system][auth][timestamp]} %{SYSLOGHOST:[system][auth][hostname]} sudo(?:\[%{POSINT:[system][auth][pid]}\])?: \s*%{DATA:[system][auth][user]} :( %{DATA:[system][auth][sudo][error]} ;)? TTY=%{DATA:[system][auth][sudo][tty]} ; PWD=%{DATA:[system][auth][sudo][pwd]} ; USER=%{DATA:[system][auth][sudo][user]} ; COMMAND=%{GREEDYDATA:[system][auth][sudo][command]}",
      		"%{SYSLOGTIMESTAMP:[system][auth][timestamp]} %{SYSLOGHOST:[system][auth][hostname]} groupadd(?:\[%{POSINT:[system][auth][pid]}\])?: new group: name=%{DATA:system.auth.groupadd.name}, GID=%{NUMBER:system.auth.groupadd.gid}",
      		"%{SYSLOGTIMESTAMP:[system][auth][timestamp]} %{SYSLOGHOST:[system][auth][hostname]} useradd(?:\[%{POSINT:[system][auth][pid]}\])?: new user: name=%{DATA:[system][auth][user][add][name]}, UID=%{NUMBER:[system][auth][user][add][uid]}, GID=%{NUMBER:[system][auth][user][add][gid]}, home=%{DATA:[system][auth][user][add][home]}, shell=%{DATA:[system][auth][user][add][shell]}$",
      		"%{SYSLOGTIMESTAMP:[system][auth][timestamp]} %{SYSLOGHOST:[system][auth][hostname]} %{DATA:[system][auth][program]}(?:\[%{POSINT:[system][auth][pid]}\])?: %{GREEDYMULTILINE:[system][auth][message]}"] }
      	pattern_definitions => {
          "GREEDYMULTILINE"=> "(.|\n)*"
        }
        remove_field => "message"
       }
      date {
        match => [ "[system][auth][timestamp]", "MMM  d HH:mm:ss", "MMM dd HH:mm:ss" ]
      }
      geoip {
        source => "[system][auth][ssh][ip]"
        target => "[system][auth][ssh][geoip]"
      }
    }
    else if [fileset][name] == "syslog" {
      grok {
      	match => { "message" => ["%{SYSLOGTIMESTAMP:[system][syslog][timestamp]} %{SYSLOGHOST:[system][syslog][hostname]} %{DATA:[system][syslog][program]}(?:\[%{POSINT:[system][syslog][pid]}\])?: %{GREEDYMULTILINE:[system][syslog][message]}"] }
        pattern_definitions => { "GREEDYMULTILINE" => "(.|\n)*" }
        remove_field => "message"
        }
      date {
        match => [ "[system][syslog][timestamp]", "MMM  d HH:mm:ss", "MMM dd HH:mm:ss" ]
      }
    }
  }
}
vim /etc/logstash/conf.d/30-elasticsearch-output.conf
output {
  elasticsearch {
    hosts => ["localhost:9200"]
    manage_template => false
    index => "%{[@metadata][beat]}-%{[@metadata][version]}-%{+YYYY.MM.dd}"
  }
}
systemctl start logstash //启动 Logstash 服务
systemctl enable logstash //开机启动 Logstash 服务
systemctl status logstash //查看 Logstash 是否正常

 浙公网安备 33010602011771号