
python matplotlib常用
一、plt.imshow()


plt.imshow()

plt.imshow(z, cmap = plt.cm.gray_r)#其中z为绘制对象
.imshow()
Plotting numpy arrays as images

plt.cm.gray_r
Colormap

加上_r相当于颜色 reverse 。
二、2.x.hist()方法,直方图详解,其中x为指定的某个图
#plt.figure()方法,创建一个图集,里面有2*2=4个图形,并且选择第一个
fig=plt.figure()
ax1=fig.add_subplot(2,2,1)

_=ax1.hist(np.random.randn(100),bins=[-2,-1,1,2],color='red',alpha=0.3)
https://blog.csdn.net/qq_37007384/article/details/102880242
官方库
https://matplotlib.org/api/_as_gen/matplotlib.pyplot.hist.html
三、scatter散点图详解
https://www.jb51.net/article/127806.htm
四、图例函数legend()
(1)设置图列位置

plt.legend(loc='upper center')

0: ‘best'
1: ‘upper right'
2: ‘upper left'
3: ‘lower left'
4: ‘lower right'
5: ‘right'
6: ‘center left'
7: ‘center right'
8: ‘lower center'
9: ‘upper center'
10: ‘center'
(2)设置图例字体大小

fontsize : int or float or {‘xx-small’, ‘x-small’, ‘small’, ‘medium’, ‘large’, ‘x-large’, ‘xx-large’}

(3)设置图例边框及背景

plt.legend(loc='best',frameon=False) #去掉图例边框
plt.legend(loc='best',edgecolor='blue') #设置图例边框颜色
plt.legend(loc='best',facecolor='blue') #设置图例背景颜色,若无边框,参数无效

对于边框还可以采用面向对象方式:

legend = plt.legend(["First", "Second"])
frame = legend.get_frame()
frame.set_facecolor('blue')

(4)设置图例标题

legend = plt.legend(["CH", "US"], title='China VS Us')

(5)设置图例名字及对应关系

legend = plt.legend([p1, p2], ["CH", "US"])
五、添加注释
https://blog.csdn.net/leaf_zizi/article/details/82886755
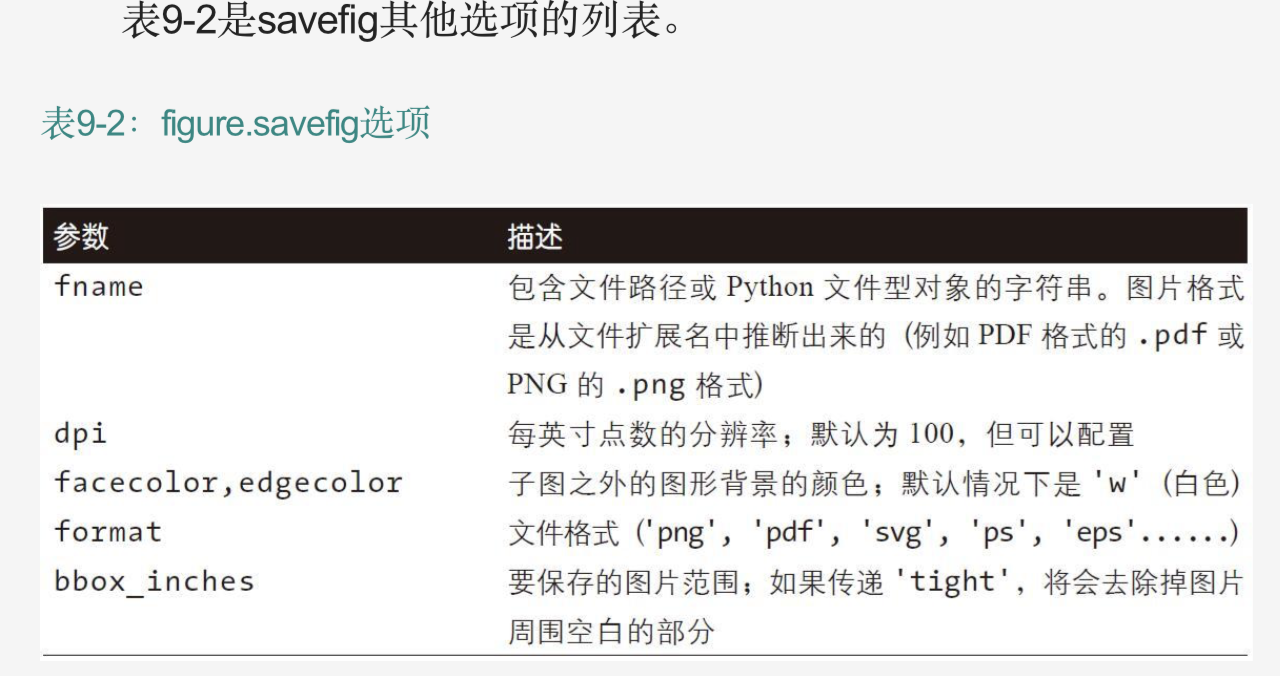
六、保存图片
#保存图片,先用s.plot()画图,然后用plt.savefig('存储路径'),参数dip指分辨率,参数bbox_inches='tight'表示留最小的空白
七、plt.Series()
实例:将series进行绘图
s=pd.Series(np.random.randn(10).cumsum(),index=np.arange(0,100,10))
print(s)
#.plot()函数,画一个series,alpha=0.3,设置图片的不透明度,从0-1,style参数,设置线颜色,类型,标记点,详见博客园
s.plot(label='a',style='r--',alpha=1)

八、seaborn使用
https://blog.csdn.net/artoria_qzh/article/details/102768817

 浙公网安备 33010602011771号