matplotlib画布装饰
x轴,y轴: label和坐标
画布title
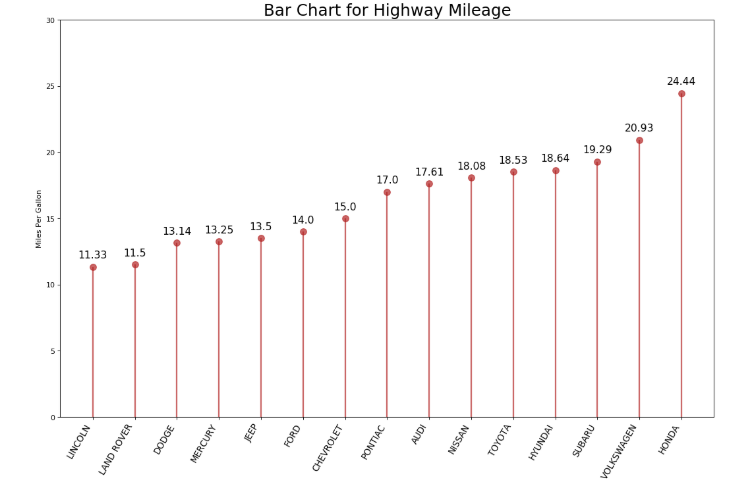
针对此图1:
首先需要 设置画布
fig,ax = plt.subplots(figsize=(16,10)   #画布尺寸
                     ,facecolor='white' #画布颜色
                     ,dpi=80            #画布分辨率
                     )
在画布上画好图之后,再装饰
(1)需要设置画布title
plt.title('Bar Chart for Highway Mileage',   # 子图标题名称
          fontdict = {'size': 22})            # 标题字体尺寸
(2)需要设置x轴的坐标
plt.xticks(df.index,                                 # 横坐标的刻度位置
          df.manufacturer.str.upper(),          # 刻度标尺的内容(先转化为字符串,再转换为大写)
          rotation = 60,                              # 旋转角度
          horizontalalignment = 'right',        # 相对于刻度标尺右移
          fontsize = 12)                              # 字体尺寸
(3)需要设置y轴的坐标和label
ax.set(ylabel='Miles Per Gallon',ylim=(0, 30))
再来看图2:
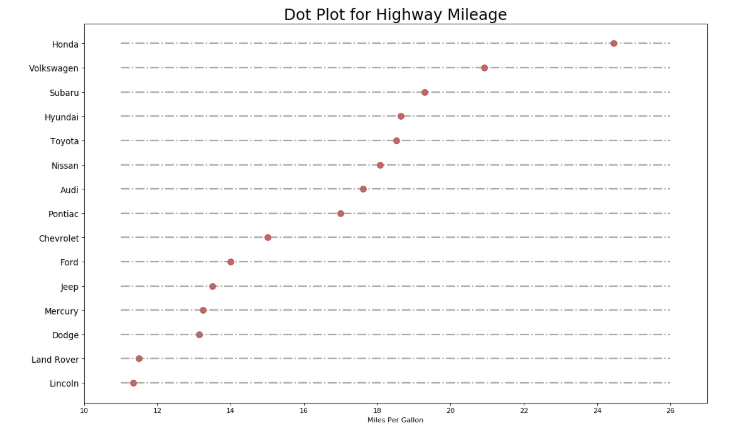
(1)需要设置画布title
plt.title('Bar Chart for Highway Mileage',   # 子图标题名称
          fontdict = {'size': 22})            # 标题字体尺寸
(2)需要设置x轴坐标和label
ax.set(xlabel='Miles Per Gallon',xlim=(10,27))
(3) 需要设置 y轴坐标
plt.yticks(df.index,                            # 横坐标的刻度位置
          df.manufacturer.str.title(),          # 刻度标尺的内容(先转化为字符串,再转换为大写)
         horizontalalignment = 'right',        # 相对于刻度标尺右移
          fontsize = 12        # 相对于刻度标尺右移
          )                        # 字体尺寸
以上均为建立了 画布之后:
fig,ax = plt.subplots(figsize=(16,10)   #画布尺寸
                     ,facecolor='white' #画布颜色
                     ,dpi=80            #画布分辨率
                     )
如果我们直接采用
plt.figure()
上述方法建立画布,之后可以采用plt方法来装饰画布,如图
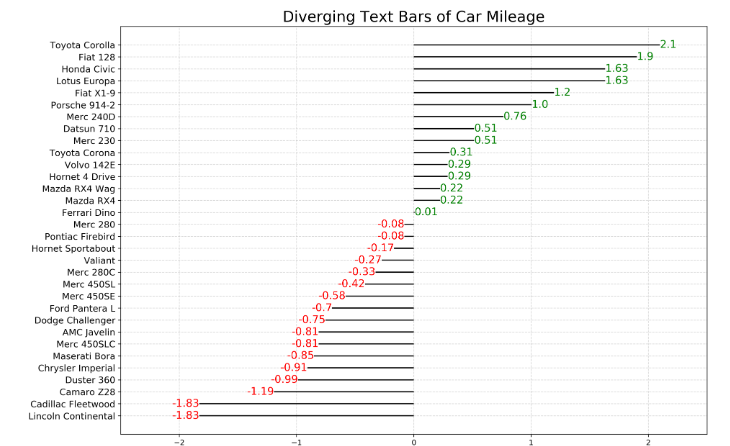
(1)title
plt.title('Diverging Text Bars of Car Mileage',     # 图像标题名称
          fontdict={'size':20})                     # 字体尺寸
(2) x轴
plt.xlim(-2.5, 2.5)
# plt.xlabel("xlabel",fontdict={'size':12})
刻度大小可以通过
plt.xticks(fontsize=22) #坐标系刻度的大小设置
(3)y轴
plt.yticks(df.index,                                # 放置刻度的位置列表
           df.cars,                                 # 放置给定位置列表的标签列表
           fontsize = 12)                           # 字体尺寸
(4)网格线
plt.grid(linestyle = '--',       # 网格线类型
         alpha = 0.5)            # 透明度
如果x,y轴均不需要坐标替换,可以使用
plt.gca().set(xlim = (0.0, 0.12),        # 设置x坐标轴的范围
              ylim = (0, 90000),         # 设置y坐标轴的范围
            xlabel = "Area",             # 设置x坐标的标题
            ylabel = "Population")       # 设置y坐标的标题

 浙公网安备 33010602011771号