爬取恒言小说2020年前50名小说排行
import requests #请求的作用,简单理解就是向网页请求url链接,进而爬取它
from bs4 import BeautifulSoup
#这个BeautifulSoup库是对网页的一个排版美化的作用,给原始网页html换行加缩近使其看着更舒适,学过前端的都很容易理解
import bs4 #在第二个方法中用到了bs4的标签定义函数element
import pandas as pd
from pandas import DataFrame
url="http://top.hengyan.com/dianji/"#
def getHTMLText(url):
try:
r=requests.get(url,timeout=30)#通过get函数获取url信息
r.raise_for_status()#用于产生异常信息
r.encoding=r.apparent_encoding#修改编码,apparent_encoding一般为utf-8
return r.text#成功则返回该链接的网页信息
except:
return ""#否则为异常信息,返回空串
headers = {'User-Agent':'Mozilla/5.0 (Windows NT 6.3; Win64; x64) AppleWebKit/537.36 (KHTML, like Gecko)Chrome/69.0.3497.100 Safari/537.36'}#伪装爬虫
#requests抓取网页信息
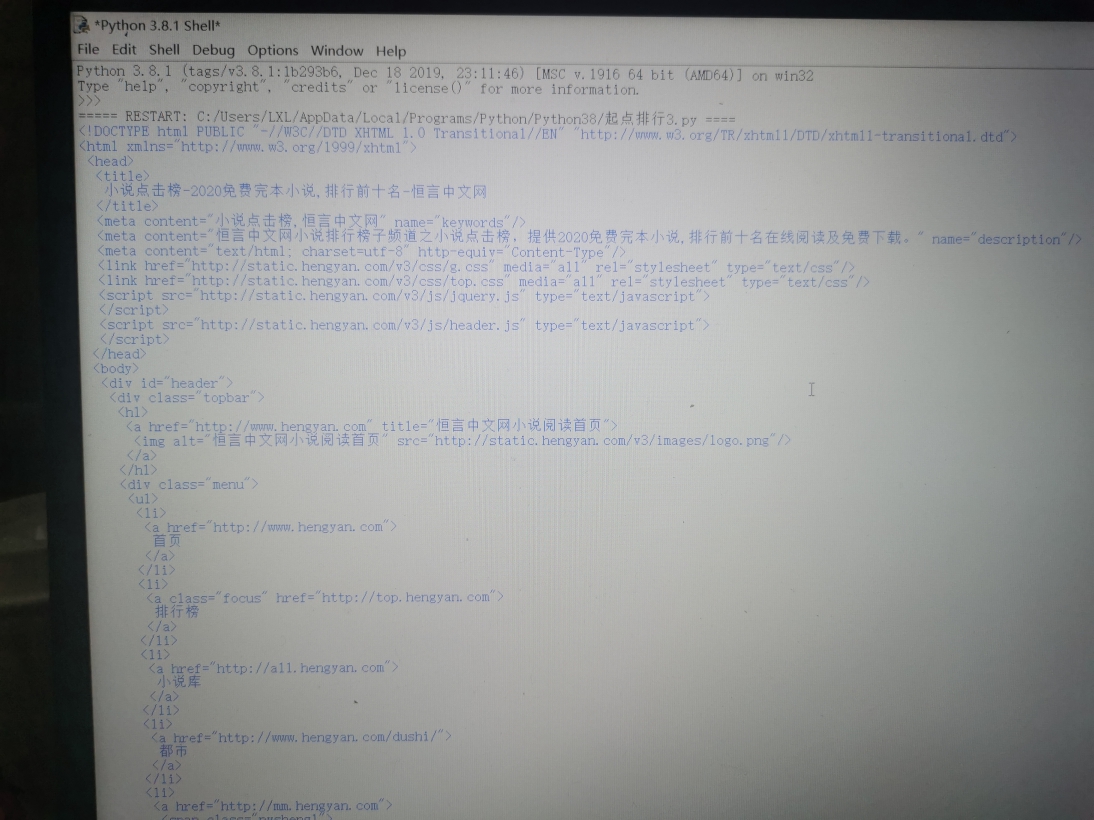
html=getHTMLText(url)
soup=BeautifulSoup(html,'html.parser')
print(soup.prettify())
r=requests.get(url)
r.encoding=r.apparent_encoding
html = r.text
soup = BeautifulSoup(html,'lxml')
num=[]
name=[]
click=[]
for o in soup.find_all('li',class_="num",):
num.append(o.get_text().strip())
for p in soup.find_all(class_="bookname"):
name.append(p.get_text().strip())
for q in soup.find_all(class_="click"):
click.append(q.get_text().strip())
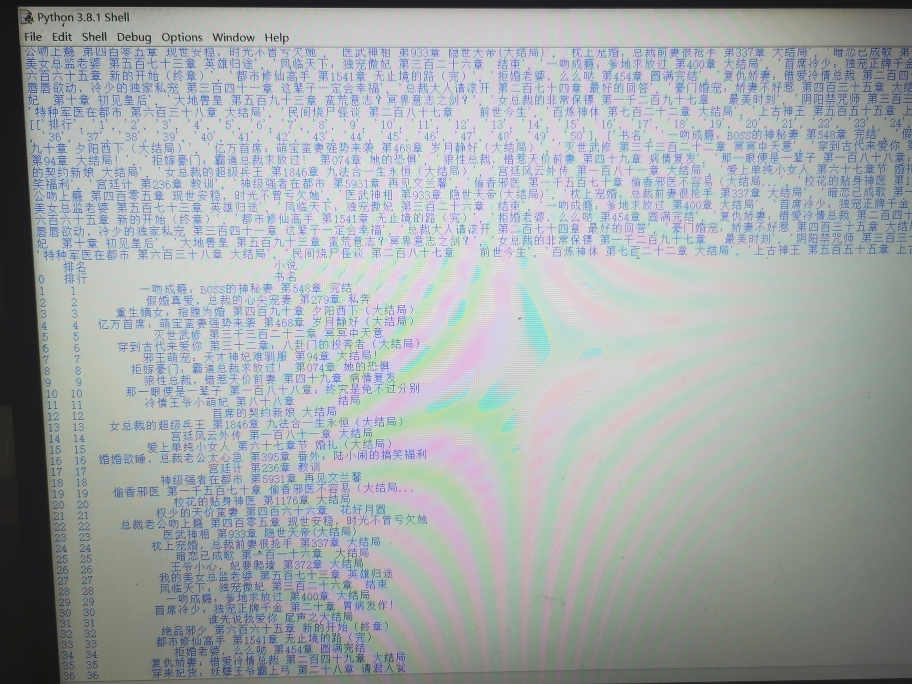
data=[num,name,click]
print(data)
df=pd.DataFrame(data,index=["排名","小说","点击量"])
data=[num,name,click]
#把三个列表收到data变量中
print(data)
df=pd.DataFrame(data,index=["排名","小说","点击量"])
#数据可视化
print(df.T)
df.to_csv('小说排行.csv')
#读取csv文件
df = pd.DataFrame(pd.read_csv('小说排行.csv'))
#print(df)
df.head()
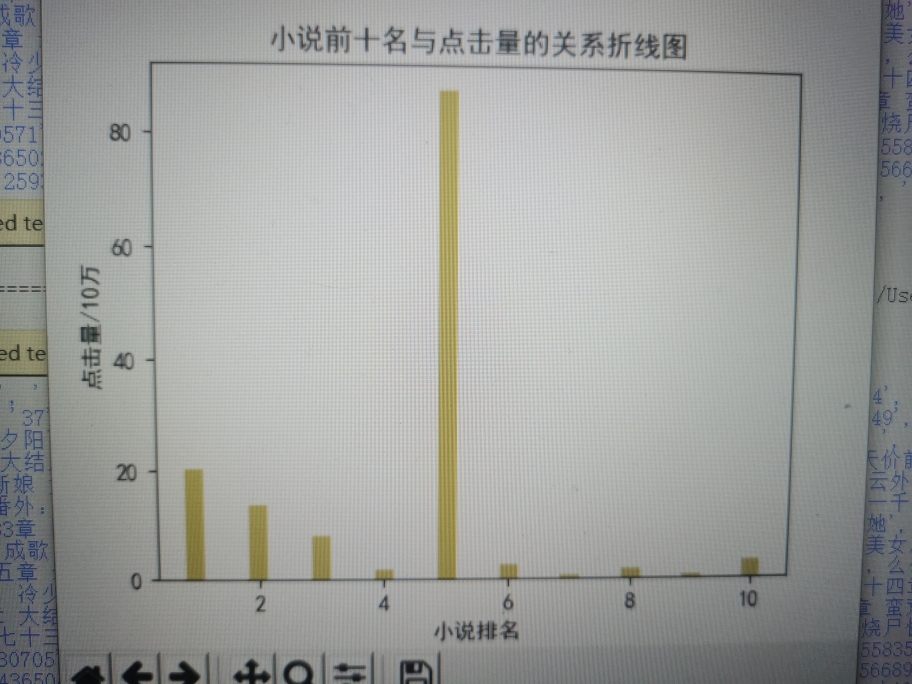
#小说排行前十名与访问点击的次数关系图
import matplotlib.pyplot as plt
plt.figure(figsize=(5,4))
x=[1,2,3,4,5,6,7,8,9,10]
y=[20.391433,13.830093,8.096769,1.799154,87.548741,2.541974,0.49946,1.721017,0.558165,3.220900]
plt.bar(x,y,width=0.3,align='center',color='y')
plt.xlabel('小说排名')
plt.ylabel('点击量/10万')
plt.title('小说前十名与点击量的关系折线图')
plt.rcParams['font.sans-serif']=['SimHei']#设置字体
plt.show()
import matplotlib.pyplot as plt
plt.figure(figsize=(5,4))
plt.plot([1,2,3,4,5,6,7,8,9,10],[20.391433,13.830093,8.096769,1.799154,87.548741,2.541974,0.49946,1.721017,0.558165,3.220900],'go-',linewidth=2)
plt.rcParams['font.sans-serif']=['SimHei']#设置字体
plt.rcParams['lines.color']='blue'#设置线条颜色
plt.legend()
plt.xlabel('小说排名')
plt.ylabel('点击量/10万')
plt.title('小说前十名与点击量的关系条形图')
plt.show()
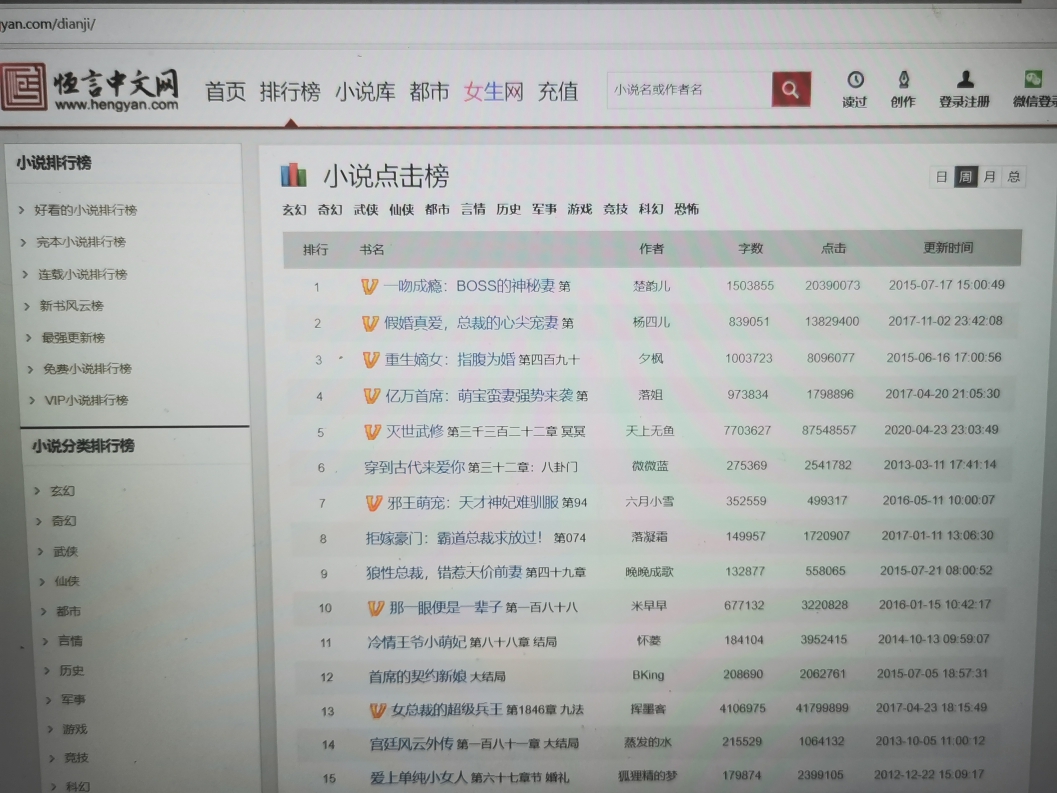
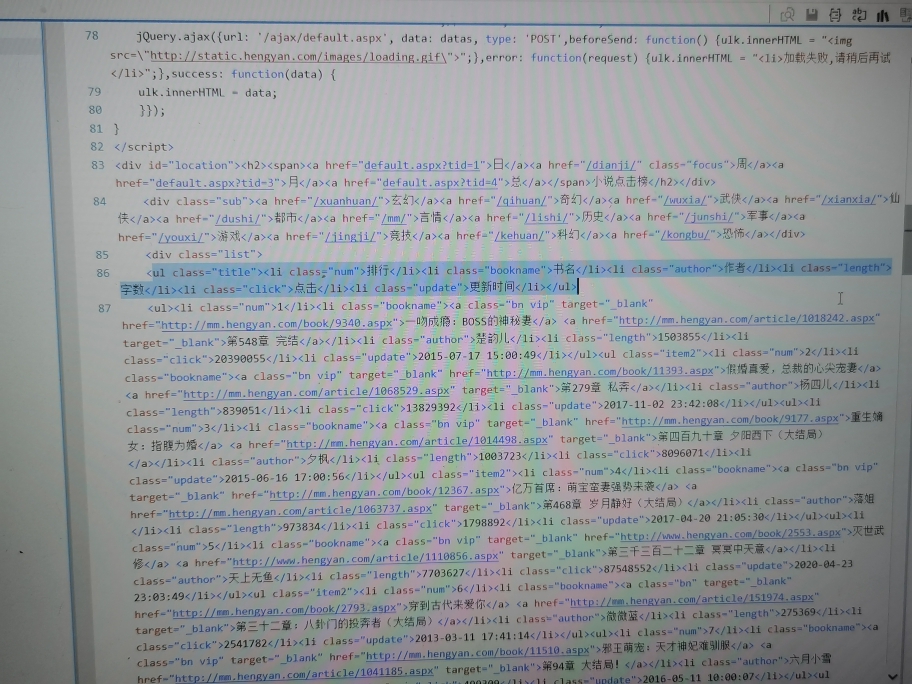
#小说排名在”class=num“中
#小说名称在"class=bookname"中
#小说点击量在"class=click"中
import requests #请求的作用,简单理解就是向网页请求url链接,进而爬取它
from bs4 import BeautifulSoup
import bs4 #在第二个方法中用到了bs4的标签定义函数element
import bs4 #在第二个方法中用到了bs4的标签定义函数element
import pandas as pd
from pandas import DataFrame
url="http://top.hengyan.com/dianji/"#恒言小说网
def getHTMLText(url):
try:
r=requests.get(url,timeout=30)#通过get函数获取url信息
r.raise_for_status()#用于产生异常信息
r.encoding=r.apparent_encoding#修改编码,apparent_encoding一般为utf-8
return r.text#成功则返回该链接的网页信息
except:
return ""#否则为异常信息,返回空串
try:
r=requests.get(url,timeout=30)#通过get函数获取url信息
r.raise_for_status()#用于产生异常信息
r.encoding=r.apparent_encoding#修改编码,apparent_encoding一般为utf-8
return r.text#成功则返回该链接的网页信息
except:
return ""#否则为异常信息,返回空串
headers = {'User-Agent':'Mozilla/5.0 (Windows NT 6.3; Win64; x64) AppleWebKit/537.36 (KHTML, like Gecko)Chrome/69.0.3497.100 Safari/537.36'}#伪装爬虫
#requests抓取网页信息
html=getHTMLText(url)
soup=BeautifulSoup(html,'html.parser')#通过BeautifulSoup函数对页面进行调整,使得格式更加方便看,采用html的解析器
print(soup.prettify())
r=requests.get(url)
r.encoding=r.apparent_encoding
html = r.text #将html以文档的形式展现出来
soup = BeautifulSoup(html,'lxml')
num=[]
name=[]
click=[]
name=[]
click=[]
for o in soup.find_all('li',class_="num",):
num.append(o.get_text().strip())
for p in soup.find_all(class_="bookname"):
name.append(p.get_text().strip())
for q in soup.find_all(class_="click"):
click.append(q.get_text().strip())
num.append(o.get_text().strip())
for p in soup.find_all(class_="bookname"):
name.append(p.get_text().strip())
for q in soup.find_all(class_="click"):
click.append(q.get_text().strip())
data=[num,name,click]print(data)
df=pd.DataFrame(data,index=["排名","小说","点击量"])
data=[num,name,click]
#把三个列表收到data变量中
print(data)
data=[num,name,click]
#把三个列表收到data变量中
print(data)
df=pd.DataFrame(data,index=["排名","小说","点击量"])
print(df.T)
#小说排行前十名与访问点击的次数关系图
import matplotlib.pyplot as plt
plt.figure(figsize=(5,4))#设置画布
x=[1,2,3,4,5,6,7,8,9,10]
y=[20.391433,13.830093,8.096769,1.799154,87.548741,2.541974,0.49946,1.721017,0.558165,3.220900]
plt.bar(x,y,width=0.3,align='center',color='y')#设置条形宽度
plt.xlabel('小说排名')
plt.ylabel('点击量/10万')
plt.title('小说前十名与点击量的关系条形图')
plt.rcParams['font.sans-serif']=['SimHei']#设置字体
plt.show()
import matplotlib.pyplot as plt
plt.figure(figsize=(5,4))#设置画布
plt.plot([1,2,3,4,5,6,7,8,9,10],[20.391433,13.830093,8.096769,1.799154,87.548741,2.541974,0.49946,1.721017,0.558165,3.220900],'go-',linewidth=2)
plt.rcParams['font.sans-serif']=['SimHei']#设置字体
plt.rcParams['lines.color']='blue'#设置线条颜色
plt.legend()
plt.xlabel('小说排名')
plt.ylabel('点击量/10万')
plt.title('小说前十名与点击量的关系折线图')
plt.show()
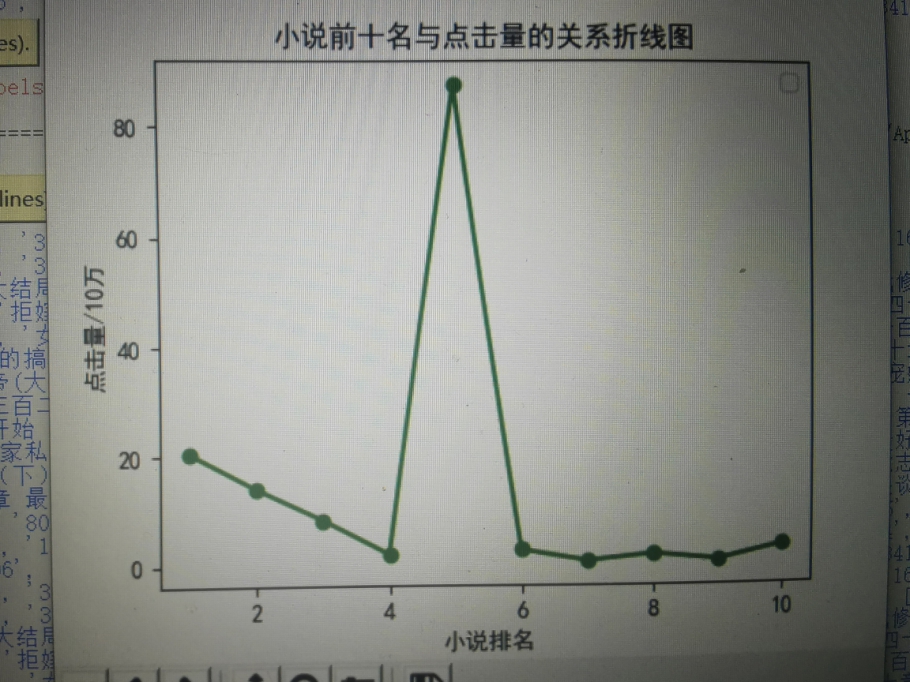
结论:小说的排行和小说的点击量没有太多的联系 有些点击量很少但是排名靠前 有些点击量很多 却在后面 这是以前不知道的 通过设计这个小程序才知道的结果
总结 : 对于很多地方的知识点不太理解 ,看了不少的例子 ,安装python第三方库 有时候挺麻烦的 ,对于爬取网页相关的内容有些遍历不太清楚 ,将文件导入本地并清洗没有明白 ,再写数据可视化的条形图和折线图时中文显示不出 在网上找了那个代码才填上 这次的作业让我认识到很多的不足 有很大的进步 但有些很复杂的地方不太明白 还需要努力学习

 浙公网安备 33010602011771号