R笔记 map_leaflet googlevis
packages : map leaflet
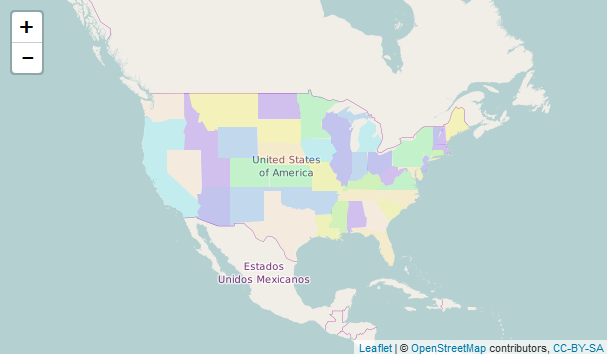
library(leaflet)
library(maps)
mapStates = map("state", fill = TRUE, plot = FALSE)
leaflet(data = mapStates) %>% addTiles() %>%
  addPolygons(fillColor = topo.colors(10, alpha = NULL), stroke = FALSE)
另外一张

```
专注数据分析
欢迎转载并注明出处
```