python画统计图(二)
python画统计图(二)
fig = plt.gca()	# 获取当前的Figure对象,如果没有就新建一个Figure

# 保存统计图
fig.savefig('figure.pdf', dpi=fig.dpi, format='pdf', pad_inches=0,bbox_inches='tight')
api路径:matplotlib.figure.Figure.savefig(self, fname, *, transparent=None, **kwargs)
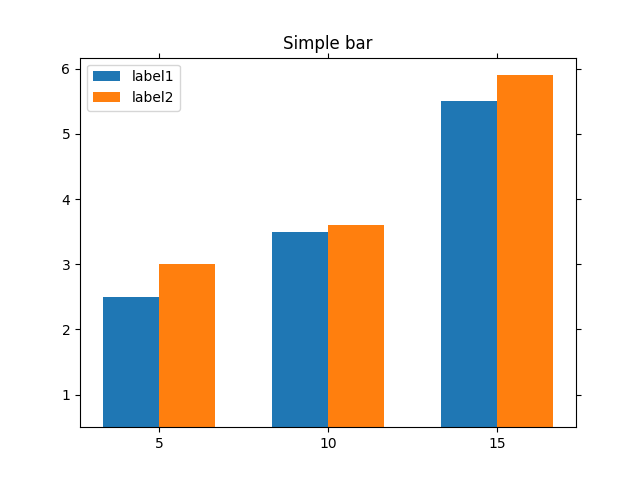
bar()
import matplotlib.pyplot as plt

plt.ion()	# 交互模式

fig, ax = plt.subplots()	# 创建画布

ax.set_title('Simple bar')	# 设置标题

# 创建条形图
label1 = ax.bar(
    x = [1, 1.6, 2.2],
    height = [2, 3, 5],
    width = 0.2,
    bottom = 0.5,
    align = 'edge',
)
label1.set_label('label1')

label2 = ax.bar(
    x = [1.2, 1.8, 2.4],
    height = [2.5, 3.1, 5.4],
    width = 0.2,
    bottom = 0.5,
    align = 'edge',
)
label2.set_label('label2')

ax.bar(
    x = [1.2, 1.8, 2.4],
    height = [0, 0, 0],
    width = [0, 0, 0],
    align = 'center',
    tick_label = ['5', '10', '15']
)

ax.legend([label1, label2], ['label1', 'label2'])	# 自动创建图例

ax.clear()	# 清除所有
每天进步一点点!
©版权声明
文章版权归作者所有,未经允许请勿转载。

 浙公网安备 33010602011771号