
什么是普罗米修斯?
Prometheus是最初在SoundCloud上构建的开源系统监视和警报工具包 。
自2012年成立以来,许多公司和组织都采用了Prometheus,该项目拥有非常活跃的开发人员和用户社区。
组件说明
- Prometheus:负责实现对K8s集群监控数据的获取,存储以及查询。
- PrometheusOperator:为Prometheus实例的部署和管理提供了简单的监视定义。
- KubeStateMetrics:是K8s集群资源使用情况的聚合器,收集数据给K8s集群内使用(如HPA)。
- AlertManager:负责将告警信息重复数据删除,分组和路由到正确的接收者集成。
- NodeExporter:用于采集集群中各个节点的资源使用情况。
- Grafana:一个跨平台的开源的度量分析和可视化工具。
系统架构

什么时候合适?
Prometheus非常适合记录任何纯数字时间序列。
它既适合以机器为中心的监视,也适合于高度动态的面向服务的体系结构的监视。在微服务世界中,它对多维数据收集和查询的支持是一种特别的优势。
Prometheus的设计旨在提高可靠性,使其成为中断期间要使用的系统,以使您能够快速诊断问题。
每个Prometheus服务器都是独立的,而不依赖于网络存储或其他远程服务。当基础结构的其他部分损坏时,您可以依靠它,并且无需设置广泛的基础结构即可使用它。
什么时候不合适?
普罗米修斯重视可靠性。即使在故障情况下,您始终可以查看有关系统的可用统计信息。
如果您需要100%的准确性(例如按请求计费),则Prometheus并不是一个不错的选择,因为所收集的数据可能不会足够详细和完整。
在这种情况下,最好使用其他系统来收集和分析数据以进行计费,并使用Prometheus进行其余的监视。
部署安装
Github : https://github.com/coreos/kube-prometheus
1、下载官方源码文件(默认镜像源来自quay.io)
wget -o kube-prometheus.tgz https://github.com/coreos/kube-prometheus/archive/v0.3.0.tar.gz
- 当然,如果你的国外网不太友好,也可以下载本人百度云文件(已修改镜像源到aliyuncs)kube-prometheus-0.3.0.zip(ccer )
2、解压并部署安装
tar -zxvf kube-prometheus.tgz && cd kube-prometheus-0.3.0/manifests
kubectl create -f setup
until kubectl get servicemonitors --all-namespaces ; do date; sleep 1; echo ""; done
kubectl create -f .
![]() ls -R[root@k8s-32 manifests]# ls -R .: alertmanager-alertmanager.yaml kube-state-metrics-service.yaml prometheus-clusterRole.yaml alertmanager-secret.yaml node-exporter-clusterRoleBinding.yaml prometheus-operator-serviceMonitor.yaml alertmanager-serviceAccount.yaml node-exporter-clusterRole.yaml prometheus-prometheus.yaml alertmanager-serviceMonitor.yaml node-exporter-daemonset.yaml prometheus-roleBindingConfig.yaml alertmanager-service.yaml node-exporter-serviceAccount.yaml prometheus-roleBindingSpecificNamespaces.yaml grafana-dashboardDatasources.yaml node-exporter-serviceMonitor.yaml prometheus-roleConfig.yaml grafana-dashboardDefinitions.yaml node-exporter-service.yaml prometheus-roleSpecificNamespaces.yaml grafana-dashboardSources.yaml prometheus-adapter-apiService.yaml prometheus-rules.yaml grafana-deployment.yaml prometheus-adapter-clusterRoleAggregatedMetricsReader.yaml prometheus-serviceAccount.yaml grafana-serviceAccount.yaml prometheus-adapter-clusterRoleBindingDelegator.yaml prometheus-serviceMonitorApiserver.yaml grafana-serviceMonitor.yaml prometheus-adapter-clusterRoleBinding.yaml prometheus-serviceMonitorCoreDNS.yaml grafana-service.yaml prometheus-adapter-clusterRoleServerResources.yaml prometheus-serviceMonitorKubeControllerManager.yaml kube-state-metrics-clusterRoleBinding.yaml prometheus-adapter-clusterRole.yaml prometheus-serviceMonitorKubelet.yaml kube-state-metrics-clusterRole.yaml prometheus-adapter-configMap.yaml prometheus-serviceMonitorKubeScheduler.yaml kube-state-metrics-deployment.yaml prometheus-adapter-deployment.yaml prometheus-serviceMonitor.yaml kube-state-metrics-roleBinding.yaml prometheus-adapter-roleBindingAuthReader.yaml prometheus-service.yaml kube-state-metrics-role.yaml prometheus-adapter-serviceAccount.yaml setup kube-state-metrics-serviceAccount.yaml prometheus-adapter-service.yaml kube-state-metrics-serviceMonitor.yaml prometheus-clusterRoleBinding.yaml ./setup: 0namespace-namespace.yaml prometheus-operator-0prometheusruleCustomResourceDefinition.yaml prometheus-operator-deployment.yaml prometheus-operator-0alertmanagerCustomResourceDefinition.yaml prometheus-operator-0servicemonitorCustomResourceDefinition.yaml prometheus-operator-serviceAccount.yaml prometheus-operator-0podmonitorCustomResourceDefinition.yaml prometheus-operator-clusterRoleBinding.yaml prometheus-operator-service.yaml prometheus-operator-0prometheusCustomResourceDefinition.yaml prometheus-operator-clusterRole.yaml
ls -R[root@k8s-32 manifests]# ls -R .: alertmanager-alertmanager.yaml kube-state-metrics-service.yaml prometheus-clusterRole.yaml alertmanager-secret.yaml node-exporter-clusterRoleBinding.yaml prometheus-operator-serviceMonitor.yaml alertmanager-serviceAccount.yaml node-exporter-clusterRole.yaml prometheus-prometheus.yaml alertmanager-serviceMonitor.yaml node-exporter-daemonset.yaml prometheus-roleBindingConfig.yaml alertmanager-service.yaml node-exporter-serviceAccount.yaml prometheus-roleBindingSpecificNamespaces.yaml grafana-dashboardDatasources.yaml node-exporter-serviceMonitor.yaml prometheus-roleConfig.yaml grafana-dashboardDefinitions.yaml node-exporter-service.yaml prometheus-roleSpecificNamespaces.yaml grafana-dashboardSources.yaml prometheus-adapter-apiService.yaml prometheus-rules.yaml grafana-deployment.yaml prometheus-adapter-clusterRoleAggregatedMetricsReader.yaml prometheus-serviceAccount.yaml grafana-serviceAccount.yaml prometheus-adapter-clusterRoleBindingDelegator.yaml prometheus-serviceMonitorApiserver.yaml grafana-serviceMonitor.yaml prometheus-adapter-clusterRoleBinding.yaml prometheus-serviceMonitorCoreDNS.yaml grafana-service.yaml prometheus-adapter-clusterRoleServerResources.yaml prometheus-serviceMonitorKubeControllerManager.yaml kube-state-metrics-clusterRoleBinding.yaml prometheus-adapter-clusterRole.yaml prometheus-serviceMonitorKubelet.yaml kube-state-metrics-clusterRole.yaml prometheus-adapter-configMap.yaml prometheus-serviceMonitorKubeScheduler.yaml kube-state-metrics-deployment.yaml prometheus-adapter-deployment.yaml prometheus-serviceMonitor.yaml kube-state-metrics-roleBinding.yaml prometheus-adapter-roleBindingAuthReader.yaml prometheus-service.yaml kube-state-metrics-role.yaml prometheus-adapter-serviceAccount.yaml setup kube-state-metrics-serviceAccount.yaml prometheus-adapter-service.yaml kube-state-metrics-serviceMonitor.yaml prometheus-clusterRoleBinding.yaml ./setup: 0namespace-namespace.yaml prometheus-operator-0prometheusruleCustomResourceDefinition.yaml prometheus-operator-deployment.yaml prometheus-operator-0alertmanagerCustomResourceDefinition.yaml prometheus-operator-0servicemonitorCustomResourceDefinition.yaml prometheus-operator-serviceAccount.yaml prometheus-operator-0podmonitorCustomResourceDefinition.yaml prometheus-operator-clusterRoleBinding.yaml prometheus-operator-service.yaml prometheus-operator-0prometheusCustomResourceDefinition.yaml prometheus-operator-clusterRole.yaml![]() kubectl create -f .[root@k8s-32 manifests]# kubectl create -f setup/. namespace/monitoring created customresourcedefinition.apiextensions.k8s.io/alertmanagers.monitoring.coreos.com created customresourcedefinition.apiextensions.k8s.io/podmonitors.monitoring.coreos.com created customresourcedefinition.apiextensions.k8s.io/prometheuses.monitoring.coreos.com created customresourcedefinition.apiextensions.k8s.io/prometheusrules.monitoring.coreos.com created customresourcedefinition.apiextensions.k8s.io/servicemonitors.monitoring.coreos.com created clusterrole.rbac.authorization.k8s.io/prometheus-operator created clusterrolebinding.rbac.authorization.k8s.io/prometheus-operator created deployment.apps/prometheus-operator created service/prometheus-operator created serviceaccount/prometheus-operator created [root@k8s-32 manifests]# kubectl create -f . alertmanager.monitoring.coreos.com/main created secret/alertmanager-main created service/alertmanager-main created serviceaccount/alertmanager-main created servicemonitor.monitoring.coreos.com/alertmanager created secret/grafana-datasources created configmap/grafana-dashboard-apiserver created configmap/grafana-dashboard-cluster-total created configmap/grafana-dashboard-controller-manager created configmap/grafana-dashboard-k8s-resources-cluster created configmap/grafana-dashboard-k8s-resources-namespace created configmap/grafana-dashboard-k8s-resources-node created configmap/grafana-dashboard-k8s-resources-pod created configmap/grafana-dashboard-k8s-resources-workload created configmap/grafana-dashboard-k8s-resources-workloads-namespace created configmap/grafana-dashboard-kubelet created configmap/grafana-dashboard-namespace-by-pod created configmap/grafana-dashboard-namespace-by-workload created configmap/grafana-dashboard-node-cluster-rsrc-use created configmap/grafana-dashboard-node-rsrc-use created configmap/grafana-dashboard-nodes created configmap/grafana-dashboard-persistentvolumesusage created configmap/grafana-dashboard-pod-total created configmap/grafana-dashboard-pods created configmap/grafana-dashboard-prometheus-remote-write created configmap/grafana-dashboard-prometheus created configmap/grafana-dashboard-proxy created configmap/grafana-dashboard-scheduler created configmap/grafana-dashboard-statefulset created configmap/grafana-dashboard-workload-total created configmap/grafana-dashboards created deployment.apps/grafana created service/grafana created serviceaccount/grafana created servicemonitor.monitoring.coreos.com/grafana created clusterrole.rbac.authorization.k8s.io/kube-state-metrics created clusterrolebinding.rbac.authorization.k8s.io/kube-state-metrics created deployment.apps/kube-state-metrics created role.rbac.authorization.k8s.io/kube-state-metrics created rolebinding.rbac.authorization.k8s.io/kube-state-metrics created service/kube-state-metrics created serviceaccount/kube-state-metrics created servicemonitor.monitoring.coreos.com/kube-state-metrics created clusterrole.rbac.authorization.k8s.io/node-exporter created clusterrolebinding.rbac.authorization.k8s.io/node-exporter created daemonset.apps/node-exporter created service/node-exporter created serviceaccount/node-exporter created servicemonitor.monitoring.coreos.com/node-exporter created apiservice.apiregistration.k8s.io/v1beta1.metrics.k8s.io created clusterrole.rbac.authorization.k8s.io/prometheus-adapter created clusterrole.rbac.authorization.k8s.io/system:aggregated-metrics-reader created clusterrolebinding.rbac.authorization.k8s.io/prometheus-adapter created clusterrolebinding.rbac.authorization.k8s.io/resource-metrics:system:auth-delegator created clusterrole.rbac.authorization.k8s.io/resource-metrics-server-resources created configmap/adapter-config created deployment.apps/prometheus-adapter created rolebinding.rbac.authorization.k8s.io/resource-metrics-auth-reader created service/prometheus-adapter created serviceaccount/prometheus-adapter created clusterrole.rbac.authorization.k8s.io/prometheus-k8s created clusterrolebinding.rbac.authorization.k8s.io/prometheus-k8s created servicemonitor.monitoring.coreos.com/prometheus-operator created prometheus.monitoring.coreos.com/k8s created rolebinding.rbac.authorization.k8s.io/prometheus-k8s-config created rolebinding.rbac.authorization.k8s.io/prometheus-k8s created rolebinding.rbac.authorization.k8s.io/prometheus-k8s created rolebinding.rbac.authorization.k8s.io/prometheus-k8s created role.rbac.authorization.k8s.io/prometheus-k8s-config created role.rbac.authorization.k8s.io/prometheus-k8s created role.rbac.authorization.k8s.io/prometheus-k8s created role.rbac.authorization.k8s.io/prometheus-k8s created prometheusrule.monitoring.coreos.com/prometheus-k8s-rules created service/prometheus-k8s created serviceaccount/prometheus-k8s created servicemonitor.monitoring.coreos.com/prometheus created servicemonitor.monitoring.coreos.com/kube-apiserver created servicemonitor.monitoring.coreos.com/coredns created servicemonitor.monitoring.coreos.com/kube-controller-manager created servicemonitor.monitoring.coreos.com/kube-scheduler created servicemonitor.monitoring.coreos.com/kubelet created
kubectl create -f .[root@k8s-32 manifests]# kubectl create -f setup/. namespace/monitoring created customresourcedefinition.apiextensions.k8s.io/alertmanagers.monitoring.coreos.com created customresourcedefinition.apiextensions.k8s.io/podmonitors.monitoring.coreos.com created customresourcedefinition.apiextensions.k8s.io/prometheuses.monitoring.coreos.com created customresourcedefinition.apiextensions.k8s.io/prometheusrules.monitoring.coreos.com created customresourcedefinition.apiextensions.k8s.io/servicemonitors.monitoring.coreos.com created clusterrole.rbac.authorization.k8s.io/prometheus-operator created clusterrolebinding.rbac.authorization.k8s.io/prometheus-operator created deployment.apps/prometheus-operator created service/prometheus-operator created serviceaccount/prometheus-operator created [root@k8s-32 manifests]# kubectl create -f . alertmanager.monitoring.coreos.com/main created secret/alertmanager-main created service/alertmanager-main created serviceaccount/alertmanager-main created servicemonitor.monitoring.coreos.com/alertmanager created secret/grafana-datasources created configmap/grafana-dashboard-apiserver created configmap/grafana-dashboard-cluster-total created configmap/grafana-dashboard-controller-manager created configmap/grafana-dashboard-k8s-resources-cluster created configmap/grafana-dashboard-k8s-resources-namespace created configmap/grafana-dashboard-k8s-resources-node created configmap/grafana-dashboard-k8s-resources-pod created configmap/grafana-dashboard-k8s-resources-workload created configmap/grafana-dashboard-k8s-resources-workloads-namespace created configmap/grafana-dashboard-kubelet created configmap/grafana-dashboard-namespace-by-pod created configmap/grafana-dashboard-namespace-by-workload created configmap/grafana-dashboard-node-cluster-rsrc-use created configmap/grafana-dashboard-node-rsrc-use created configmap/grafana-dashboard-nodes created configmap/grafana-dashboard-persistentvolumesusage created configmap/grafana-dashboard-pod-total created configmap/grafana-dashboard-pods created configmap/grafana-dashboard-prometheus-remote-write created configmap/grafana-dashboard-prometheus created configmap/grafana-dashboard-proxy created configmap/grafana-dashboard-scheduler created configmap/grafana-dashboard-statefulset created configmap/grafana-dashboard-workload-total created configmap/grafana-dashboards created deployment.apps/grafana created service/grafana created serviceaccount/grafana created servicemonitor.monitoring.coreos.com/grafana created clusterrole.rbac.authorization.k8s.io/kube-state-metrics created clusterrolebinding.rbac.authorization.k8s.io/kube-state-metrics created deployment.apps/kube-state-metrics created role.rbac.authorization.k8s.io/kube-state-metrics created rolebinding.rbac.authorization.k8s.io/kube-state-metrics created service/kube-state-metrics created serviceaccount/kube-state-metrics created servicemonitor.monitoring.coreos.com/kube-state-metrics created clusterrole.rbac.authorization.k8s.io/node-exporter created clusterrolebinding.rbac.authorization.k8s.io/node-exporter created daemonset.apps/node-exporter created service/node-exporter created serviceaccount/node-exporter created servicemonitor.monitoring.coreos.com/node-exporter created apiservice.apiregistration.k8s.io/v1beta1.metrics.k8s.io created clusterrole.rbac.authorization.k8s.io/prometheus-adapter created clusterrole.rbac.authorization.k8s.io/system:aggregated-metrics-reader created clusterrolebinding.rbac.authorization.k8s.io/prometheus-adapter created clusterrolebinding.rbac.authorization.k8s.io/resource-metrics:system:auth-delegator created clusterrole.rbac.authorization.k8s.io/resource-metrics-server-resources created configmap/adapter-config created deployment.apps/prometheus-adapter created rolebinding.rbac.authorization.k8s.io/resource-metrics-auth-reader created service/prometheus-adapter created serviceaccount/prometheus-adapter created clusterrole.rbac.authorization.k8s.io/prometheus-k8s created clusterrolebinding.rbac.authorization.k8s.io/prometheus-k8s created servicemonitor.monitoring.coreos.com/prometheus-operator created prometheus.monitoring.coreos.com/k8s created rolebinding.rbac.authorization.k8s.io/prometheus-k8s-config created rolebinding.rbac.authorization.k8s.io/prometheus-k8s created rolebinding.rbac.authorization.k8s.io/prometheus-k8s created rolebinding.rbac.authorization.k8s.io/prometheus-k8s created role.rbac.authorization.k8s.io/prometheus-k8s-config created role.rbac.authorization.k8s.io/prometheus-k8s created role.rbac.authorization.k8s.io/prometheus-k8s created role.rbac.authorization.k8s.io/prometheus-k8s created prometheusrule.monitoring.coreos.com/prometheus-k8s-rules created service/prometheus-k8s created serviceaccount/prometheus-k8s created servicemonitor.monitoring.coreos.com/prometheus created servicemonitor.monitoring.coreos.com/kube-apiserver created servicemonitor.monitoring.coreos.com/coredns created servicemonitor.monitoring.coreos.com/kube-controller-manager created servicemonitor.monitoring.coreos.com/kube-scheduler created servicemonitor.monitoring.coreos.com/kubelet created


3、等待部署完成
kubectl get pod -n monitoring
NAME                                   READY   STATUS    RESTARTS   AGE
alertmanager-main-0                    2/2     Running   0          65m
alertmanager-main-1                    2/2     Running   0          65m
alertmanager-main-2                    2/2     Running   0          65m
grafana-7c54b4677d-btwfb               1/1     Running   0          65m
kube-state-metrics-58b656b699-p8m29    3/3     Running   0          65m
node-exporter-rc5mx                    2/2     Running   0          65m
node-exporter-vdzkb                    2/2     Running   0          65m
node-exporter-xzdw2                    2/2     Running   0          65m
prometheus-adapter-7d6f96974c-76m4z    1/1     Running   0          65m
prometheus-k8s-0                       3/3     Running   1          65m
prometheus-k8s-1                       3/3     Running   1          65m
prometheus-operator-5bd99d6457-89n7h   1/1     Running   0          66m
4、更改访问模式(ClusterIP => NodePort)
1)Prometheus
kubectl edit svc/prometheus-k8s -n monitoring
2)Alert Manager
kubectl edit svc/alertmanager-main -n monitoring
3)Grafana
kubectl edit svc/grafana -n monitoring
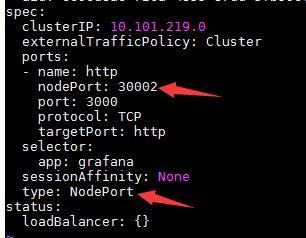
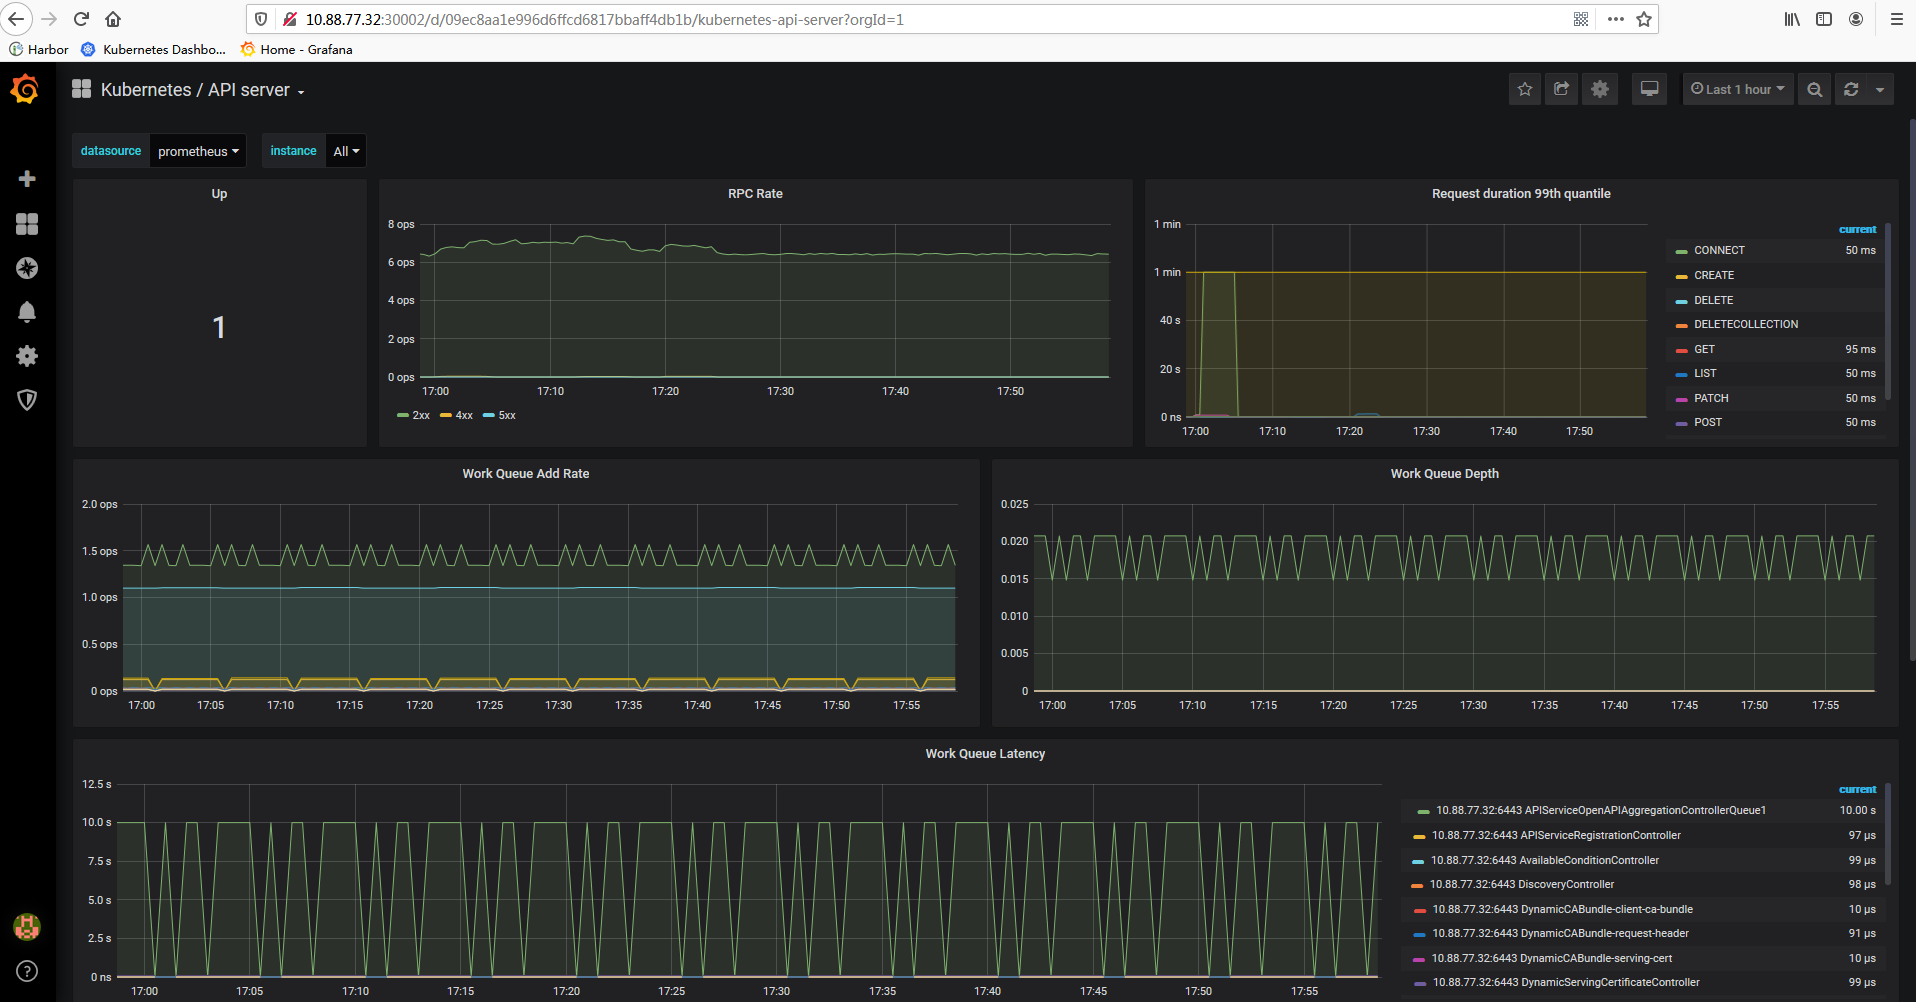
5、访问MasterIP:Port,其中Grafana默认用户名和密码都是admin
>>> 普罗米修斯功能强大,目前我也还没有完全掌握,具体应用还需要大家自己深度学习。
作者:Leozhanggg
出处:https://www.cnblogs.com/leozhanggg/p/12661566.html
本文版权归作者和博客园共有,欢迎转载,但未经作者同意必须保留此段声明,且在文章页面明显位置给出原文连接,否则保留追究法律责任的权利。

 浙公网安备 33010602011771号