

一文揭秘如何利用AndroidGodEye 打造Android应用性能测试监控
AndroidGodEye是什么?
官网的介绍如下。
Android开发者在性能检测方面的工具一直比较匮乏,仅有的一些工具,比如Android Device Monitor,使用起来也有些繁琐,使用起来对开发者有一定的要求。
而线上的App监控更无从谈起。所以需要有一个系统能够提供Debug和Release阶段全方位的监控,更深入地了解对App运行时的状态。AndroidGodEye是一个可以在PC浏览器中实时监控Android数据指标
(比如性能指标,但是不局限于性能)的工具,你可以通过wifi/usb连接手机和pc,通过pc浏览器实时监控手机性能。AndroidGodEye 系统分为三部分:Core 核心部分,提供所有模块Debug Monitor部分,提供Debug阶段开发者面板Toolbox 快速接入工具集,给开发者提供各种便捷接入的工具AndroidGodEye提供了多种监控模块,
比如cpu、内存、卡顿、内存泄漏等等,并且提供了Debug阶段的Monitor看板实时展示这 些数据。而且提供了api供开发者在release阶段进行数据上报。
那么如何使用呢,接下来,我来带领大家去实际的去操作下。
首先呢,我们先去引入
dependencies {
    // 核心模块,必须依赖
      implementation 'cn.hikyson.godeye:godeye-core:3.4.2'
    implementation 'cn.hikyson.godeye:godeye-monitor:3.4.2'
    implementation 'cn.hikyson.godeye:godeye-okhttp:3.4.2'
    // 额外依赖,添加此依赖可以完成Crash监控,如果不依赖则无法监控Crash(安装了也不会生效)
    implementation 'cn.hikyson.godeye:godeye-xcrash:3.4.2'
}
备注,这里的gradle的版本需要6.1.1版本
支持页面生命周期耗时检测和方法耗时检测MethodCanary
在Root Project的build.gradle中添加
buildscript {
    repositories {
        jcenter()
    }
    dependencies {
    //我的配置classpath "cn.hikyson.methodcanary:plugin:0.15.0"
        classpath "cn.hikyson.methodcanary:plugin:PLUGIN_VERSION_NAME"
    }
}
PLUGIN_VERSION_NAME参考 MethodCanary github release
在Application Module Project('com.android.application')的build.gradle中添加
apply plugin: 'cn.hikyson.methodcanary.plugin'
AndroidGodEye {
    enableMethodTracer true // 方法耗时检测,注意,生产包中关闭它,举例,这里可以这么写:!gradle.startParameter.taskNames.contains("assembleRelease")
    enableLifecycleTracer true // 页面生命周期检测
    instrumentationRuleFilePath 'AndroidGodEye-MethodCanary.js'
  }
需要配置AndroidGodEye-MethodCanary.js
如下
/**
    classInfo
        {int access
         String name
         String superName
         String[] interfaces}

     methodInfo
         {int access
         String name
         String desc}
**/
function isInclude(classInfo,methodInfo){
    if(!classInfo.name.startsWith('cn/hikyson/methodcanary')){
        return false;
    }
    if(classInfo.name.startsWith('cn/hikyson/methodcanary/samplelib/R$')
            || classInfo.name === 'cn/hikyson/methodcanary/samplelib/BuildConfig'){
            return false
    }
    return true
}
在debug配置
resValue("bool", "android_god_eye_manual_install", "false")
            resValue("bool", "android_god_eye_need_notification", "true")
            resValue("integer", "android_god_eye_monitor_port", "5390")
            resValue("string", "android_god_eye_install_assets_path", "android-godeye-config/install.config")
在项目的目录下面创建assets目录,然后创建android-godeye-config,然后去创建install.config文件,具体路径如下
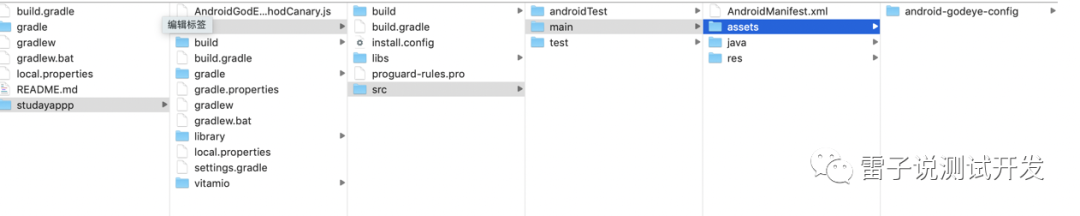
文件内容如下
<config>
    <cpu intervalMillis="2000" />
    <battery />
    <fps intervalMillis="2000" />
    <leakCanary />
    <heap intervalMillis="2000" />
    <pss intervalMillis="2000" />
    <ram intervalMillis="2000" />
    <network />
    <sm dumpIntervalMillis="1000" longBlockThresholdMillis="500" shortBlockThresholdMillis="500" />
    <startup />
    <traffic intervalMillis="2000" sampleMillis="1000" />
    <crash immediate="false" />
    <thread intervalMillis="3000"
        threadFilter="cn.hikyson.godeye.core.internal.modules.thread.ExcludeSystemThreadFilter"
        threadTagger="cn.hikyson.godeye.core.internal.modules.thread.DefaultThreadTagger" />
    <pageload
        pageInfoProvider="cn.hikyson.godeye.core.internal.modules.pageload.DefaultPageInfoProvider" />
    <methodCanary lowCostMethodThresholdMillis="10" maxMethodCountSingleThreadByCost="300" />
    <appSize delayMillis="0" />
    <viewCanary maxDepth="10" />
    <imageCanary
        imageCanaryConfigProvider="cn.hikyson.godeye.core.internal.modules.imagecanary.DefaultImageCanaryConfigProvider" />
</config>
这要是一些监控的配置。配置完毕,我们需要在项目的主入口增加
GodEyeHelper.setMonitorAppInfoConext(new AppInfoConext() {
            @Override
            public List<cn.hikyson.godeye.core.monitor.AppInfoLabel> getAppInfo() {
                List<AppInfoLabel> appInfoLabels = new ArrayList<>();
                appInfoLabels.add(new AppInfoLabel("ApplicationID", "com", null));
                appInfoLabels.add(new AppInfoLabel("VersionName", "1.1.0", ""));
                appInfoLabels.add(new AppInfoLabel("AndroidGodEye", "https://github.com/Kyson/AndroidGodEye", "https://github.com/Kyson/AndroidGodEye"));
                return appInfoLabels;
            }
        });
然后就可以运行app,我们就可以在设备上运行。
为了方便查看,
adb forward tcp:5390 tcp:5390然后在本地浏览器就可以打开访问了。访问地址
http://localhost:5390/index.html
界面如下。
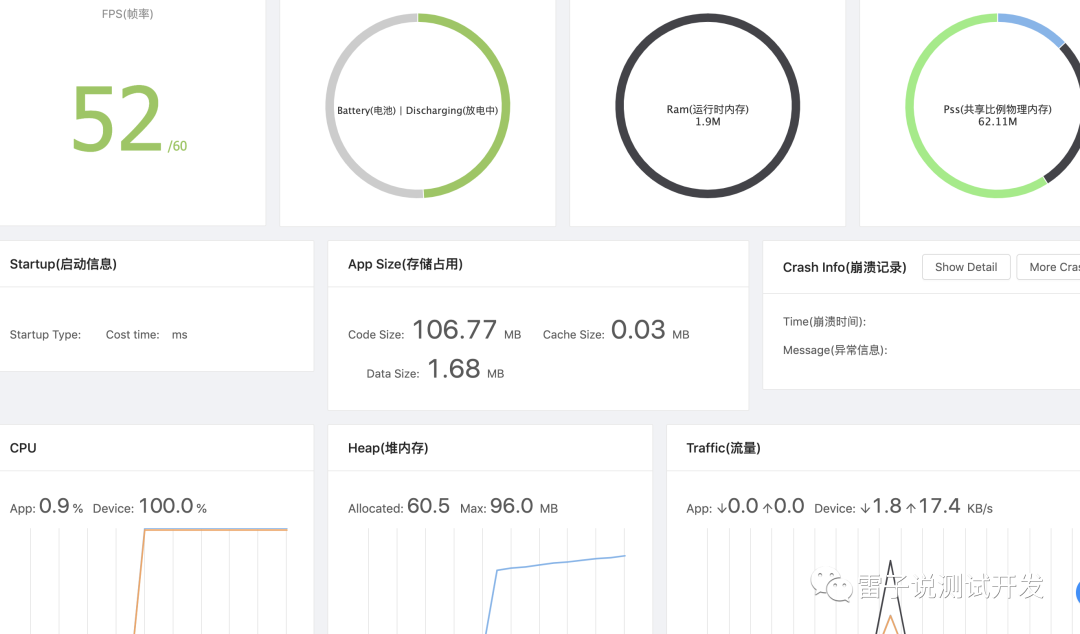
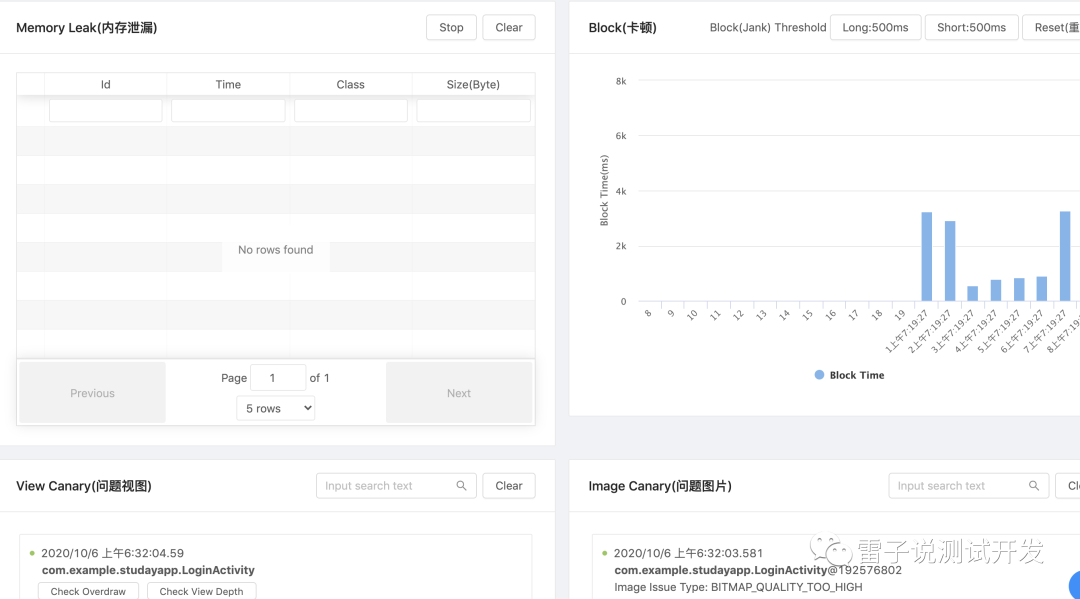
这样我们在实际的测试中,就可以发现我们的应用中的性能问题了,尽早发现尽早处理。


 浙公网安备 33010602011771号