


如何用MAT分析Android应用内存泄露
使用工具:Android Studio 2.0 Preview, Android Device Monitor, MAT(Memory Analyzer).
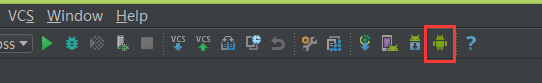
点击Android Studio工具栏上的“Android Device Monitor”,如下图
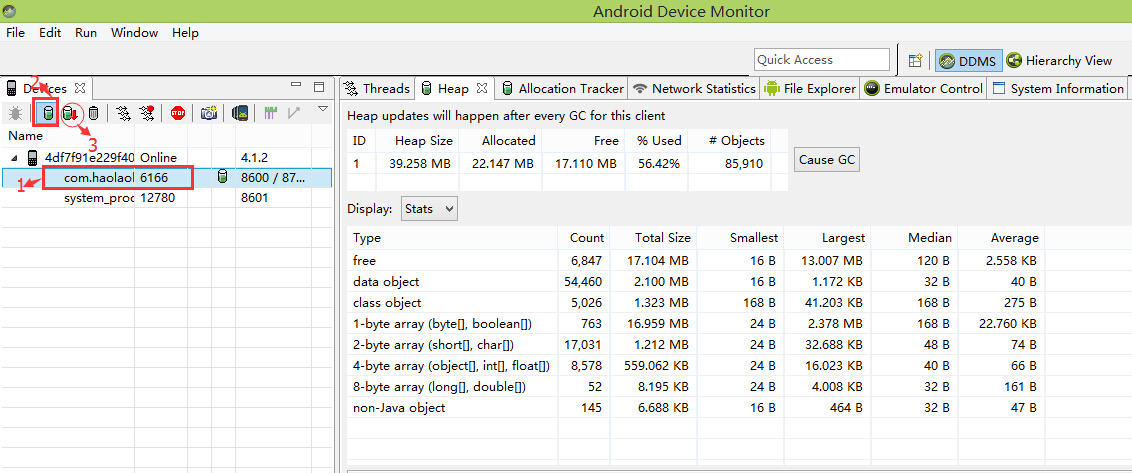
打开后选中应用进程,然后点击“Update heap”,接着反复点击应用的每个activity,最后“Dump HPROF file”,如下图1-2-3所示
保存hprof文件。

下面需要对hprof文件进行转换。
打开CMD终端,进入到\sdk\platform-tools目录,利用hprof-conv命令转换hprof文件
hprof-conv F:/a.hprof F:/b.hprof
最终得到b.hprof文件。
到官网:http://www.eclipse.org/mat/downloads.php 下载Memory Analyzer工具。

选择适合你的版本即可。
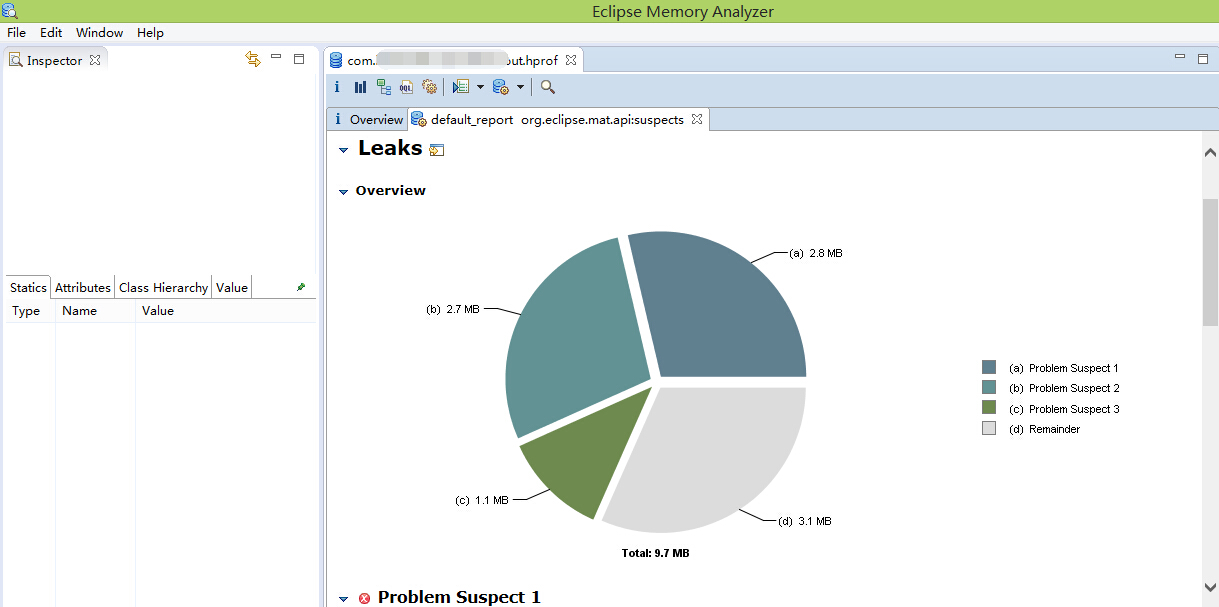
打开MemoryAnalyzer.exe,工具栏中选择“File”->"Open Heap Dump",选择b.hprof
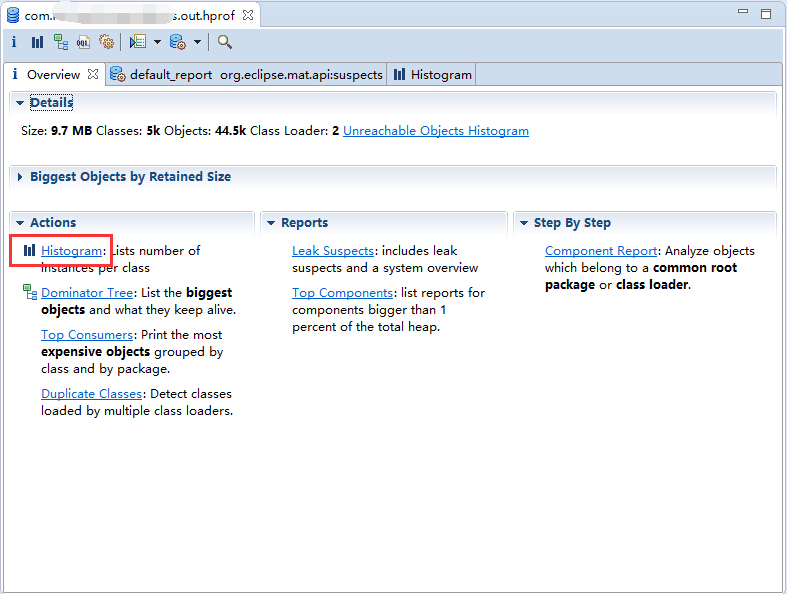
选中Overview中的Action,点击“Histogram”
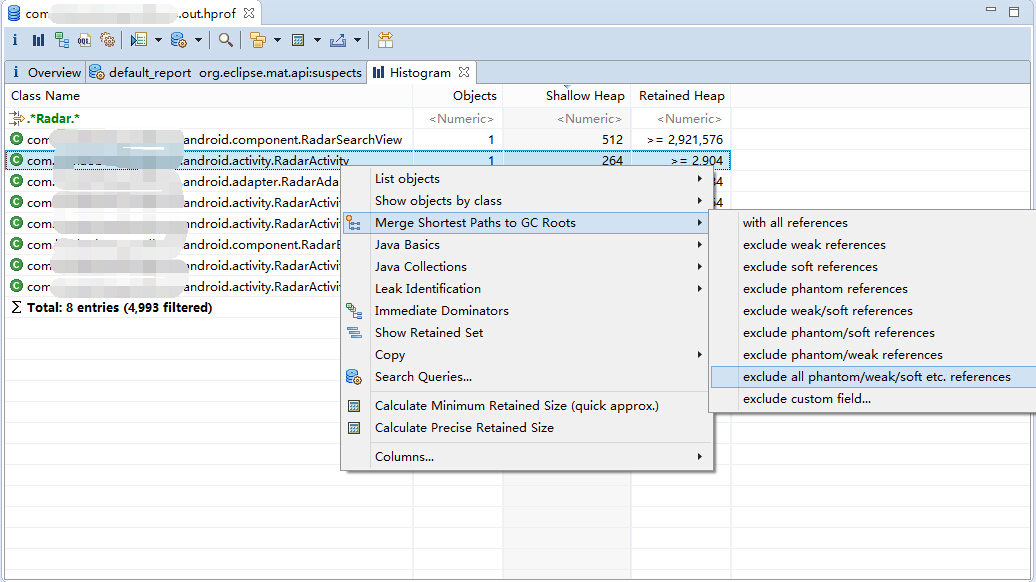
可以搜索工程中的类名,支持部分匹配。我输入Radar后,匹配出了以下的内容

右键其中一个,选择“Merge Shortest Paths to GC Roots” -> "exclude all phantom/weak/soft etc. references"

还可以利用Overview中的Dominator Tree生成新的列表,再次使用Path to GC Roots -> exclude weak/soft references筛选出跟程序相关的内存泄露的类。给个例子:
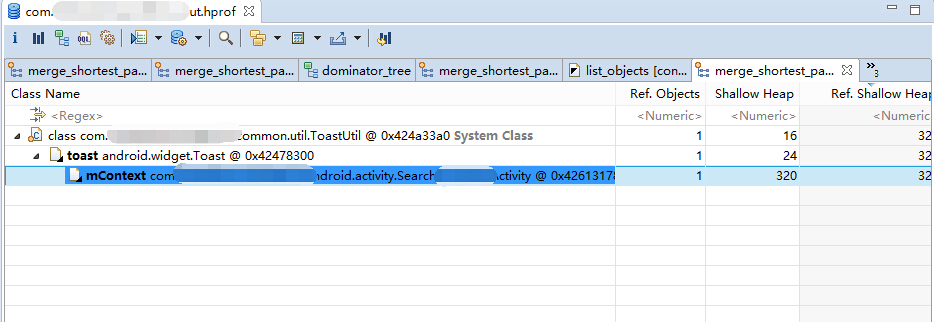
由于ToastUtil是一个工具类,方法都是static,且接受Context参数,此时在一个activity中传入了Activity的context,导致ToastUtil持有了该activity的引用而该activity得不到释放,内存泄露了。解决办法:传一个application context进去,让此context与ToastUtil具备同样的生命周期。
此外,Handler使用不当也会出现内存泄露,如在Handler中使用postDelayed。
常用的解决方案有以下:
1、使用静态内部Handler/Runnable + 弱引用
2、在onDestory的时候,手动清除Message
3、使用Badoo开发的第三方的 WeakHandler
具体请参考这篇文章:使用Android studio分析内存泄露

 浙公网安备 33010602011771号