
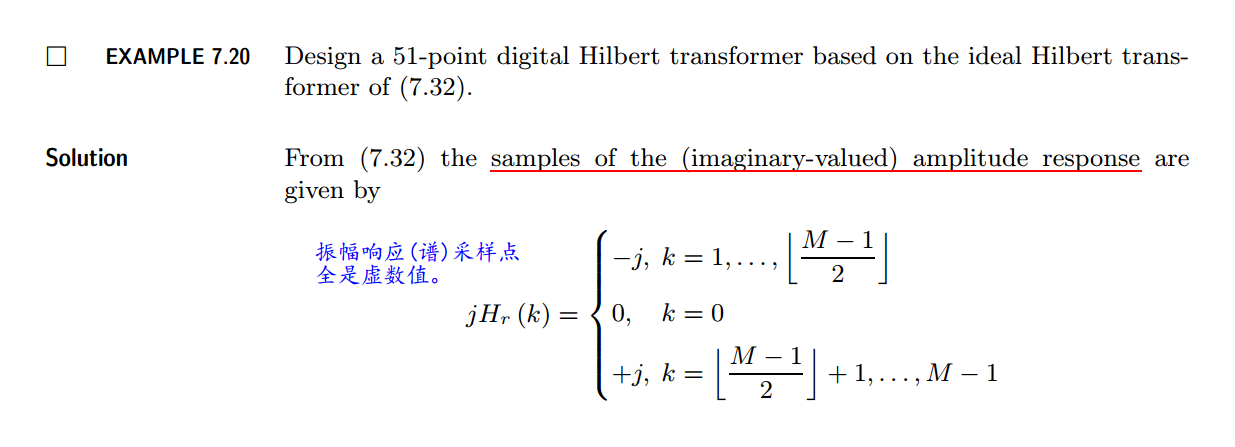
《DSP using MATLAB》示例Example7.20

代码:
M = 51; alpha = (M-1)/2; Dw = 2*pi/M; l = 0:M-1; wl = Dw*l;
T1 = j*0.39;
k1 = 0:floor((M-1)/2); k2 = floor((M-1)/2)+1:M-1;

Hrs = [0, -j*ones(1, (M-3)/2), -T1, T1, j*ones(1, (M-3)/2)];
angH = [-alpha*Dw*k1, alpha*Dw*(M-k2)];
H = Hrs.*exp(j*angH); h = real(ifft(H, M));

[db, mag, pha, grd, w] = freqz_m(h, 1);
[Hr, ww, c, L] = Hr_Type3(h);

%Plot

figure('NumberTitle', 'off', 'Name', 'Exameple 7.20')
set(gcf,'Color','white');

subplot(2,2,1); plot(wl(1:26)/pi, j*(Hrs(1:26)), 'o', ww/pi, -Hr); axis([0, 1, -1.0, 1.5]); grid on;
xlabel('frequency in \pi nuits'); ylabel('Amplitude Response'); title('Hilbert Transformer, frequency sampleing design: M=51');

subplot(2,2,2); stem(l, h); axis([-1, M, -1.1, 1.1]); grid on;
xlabel('n'); ylabel('h(n)'); title('Impulse Response');

subplot(2,2,3); plot(w/pi, pha/pi); axis([0, 1, -1.5, 2]); grid on;
xlabel('frequency in \pi units'); ylabel('pha(w) in  \pi units'); title('Phase Response');

subplot(2,2,4); plot(w/pi, db); axis([0, 1, -60, 10]); grid on;
xlabel('frequency in \pi units'); ylabel('Decibels'); title('Magnitude Response');
运行结果:
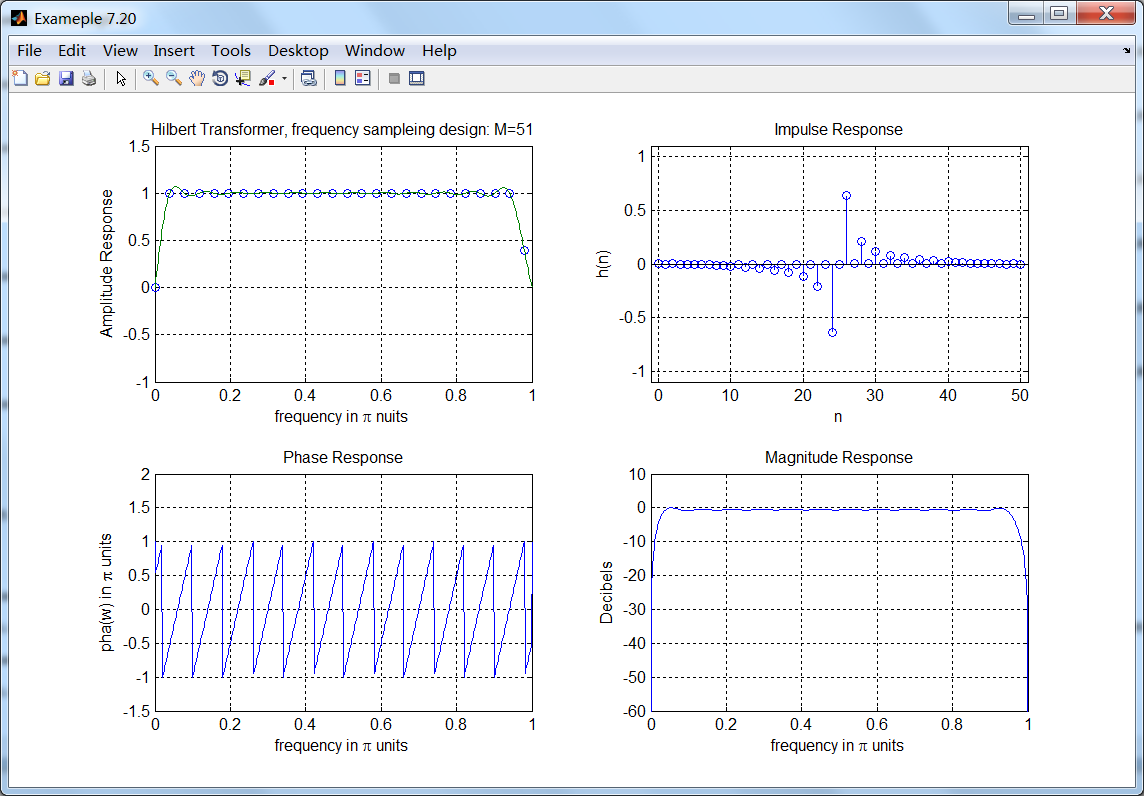
过渡带中有采样点(左上图)的效果。
牢记:
1、如果你决定做某事,那就动手去做;不要受任何人、任何事的干扰。2、这个世界并不完美,但依然值得我们去为之奋斗。

 浙公网安备 33010602011771号