
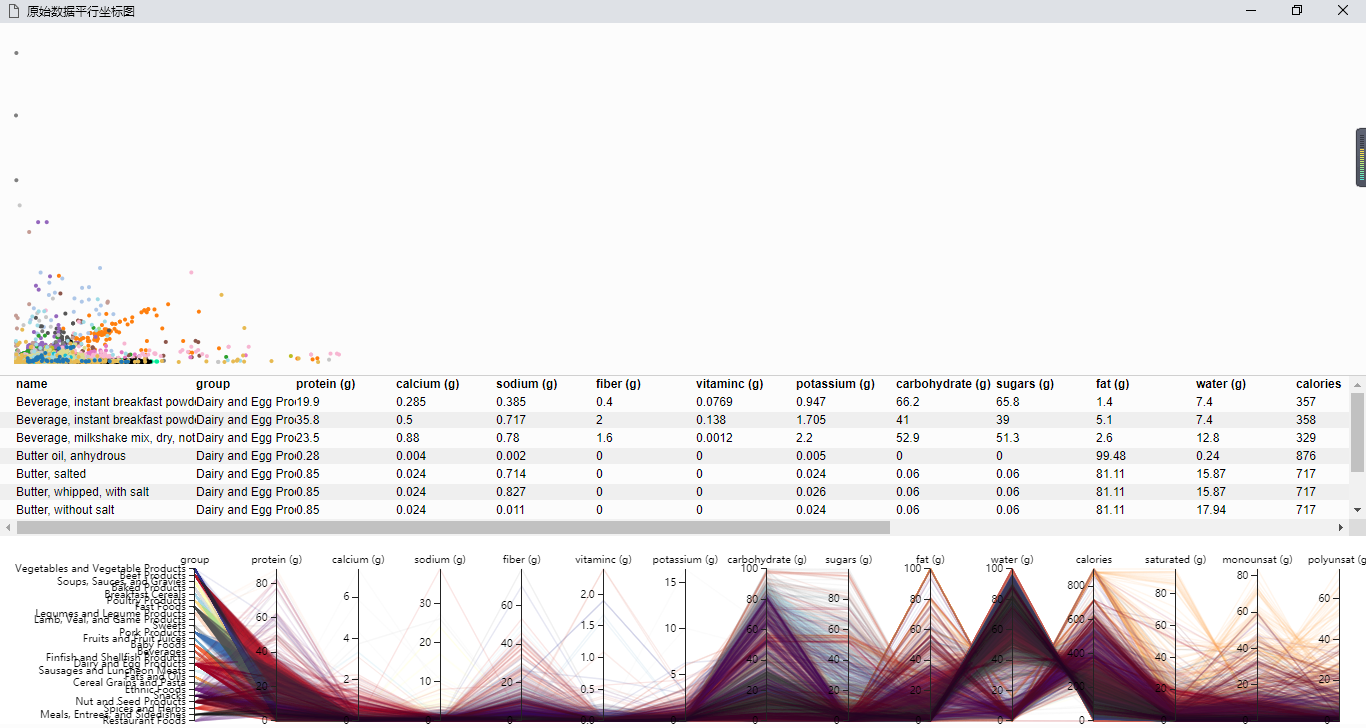
D3.js绘制平行坐标图
参照:https://syntagmatic.github.io/parallel-coordinates/ 和 https://github.com/syntagmatic/parallel-coordinates
源码:
<!DOCTYPE html>
<html lang="en">
<head>
    <meta charset="UTF-8">
    <title>原始数据平行坐标图</title>
    <link rel="stylesheet" type="text/css" href="static/css/d3.parcoords.css">
    <link rel="stylesheet" type="text/css" href="static/css/style.css">
    <style>
        body, html {
            margin: 0;
            padding: 0;
            width: 100%;
            height: 100%;
        }

        /* parcoords */
        #nutrients {
            position: fixed;
            bottom: 4px;
            height: 180px;
            width: 98%;
            padding: 8px 1% 0;
            border-top: 1px solid #d0d0d0;
        }

        #nutrients text {
            font-size: 10px;
        }

        /* data table styles */
        #grid {
            position: fixed;
            bottom: 192px;
            width: 100%;
            height: 160px;
            overflow: auto;
            border-top: 1px solid #d0d0d0;
        }

        .row, .header {
            clear: left;
            font-size: 10px;
            line-height: 16px;
            height: 16px;
            width: 2000px;
            padding: 0 16px;
        }

        .row:nth-child(odd) {
            background: rgba(0, 0, 0, 0.05);
        }

        .header {
            font-weight: bold;
        }

        .cell {
            float: left;
            overflow: hidden;
            white-space: nowrap;
            width: 100px;
            height: 18px;
        }

        .col-0 {
            width: 180px;
        }
    </style>
    <script src="static/js/d3.min.js"></script>
    <script src="static/js/d3.parcoords.js"></script>
    <script src="static/js/divgrid.js"></script>
    <script src="static/js/underscore.js"></script>
    <script src="static/js/scatterplot.js"></script>

</head>
<body>
<div id="nutrients" class="parcoords"></div>
<svg id="scatter"></svg>
<div id="grid"></div>


<script id="brushing">
    var parcoords = d3.parcoords()("#nutrients");
    var transparency = d3.scale.pow()
        .exponent(0.15)
        .range([1, 0.12]);

    var colorList = ["#a50026", "#d73027", "#f46d43", "#fdae61", "#fee090", "#ffffbf", "#e0f3f8", "#abd9e9", "#74add1", "#4575b4", "#313695", "#67001f", "#b2182b", "#d6604d", "#f4a582", "#fddbc7", "#ffffff", "#e0e0e0", "#bababa", "#878787", "#4d4d4d", "#1a1a1a", "#40004b", "#762a83", "#9970ab", "#c2a5cf", "#e7d4e8", "#f7f7f7", "#d9f0d3", "#a6dba0", "#5aae61", "#1b7837", "#00441b"];

    var scatter = scatterplot()
        .key(function (d) {
            return d.name
        })
        .width(document.body.clientHeight - 350)
        .height(document.body.clientHeight - 350);

    // load csv file and create the chart
    d3.csv('data/nutrients.csv', function (data) {
        var colorMap = {};
        _(data).chain()
            .pluck('group')
            .uniq()
            .each(function (d, i) {
                colorMap[d] = colorList.length > i ? colorList[i] : "black";
            });

        var color = function (d) {
            return colorMap[d.group];
        };
        transparency.domain([1, data.length]);

        parcoords
            .data(data)
            .hideAxis(["name"])
            .alpha(transparency(data.length))
            .color(color)
            .composite("darken")
            .margin({top: 24, left: 140, bottom: 12, right: 0})
            .mode("queue")
            .render()
            .brushMode("1D-axes");  // enable brushing

        scatter.data(data)("#scatter");

        // create data table, row hover highlighting
        var grid = d3.divgrid();
        d3.select("#grid")
            .datum(data.slice(0, 10))
            .call(grid)
            .selectAll(".row")
            .on({
                "mouseover": function (d) {
                    parcoords.highlight([d])
                },
                "mouseout": parcoords.unhighlight
            });

        // update data table on brush event
        parcoords.on("brush", function (d) {
            parcoords.alpha(transparency(d.length));
            scatter.show(d);
            d3.select("#grid")
                .datum(d.slice(0, 30))
                .call(grid)
                .selectAll(".row")
                .on({
                    "mouseover": function (d) {
                        parcoords.highlight([d])
                    },
                    "mouseout": parcoords.unhighlight
                });
        });

        window.onresize = function () {
            parcoords.width(document.body.clientWidth);
            parcoords.resize();

            scatter
                .width(document.body.clientHeight - 350)
                .height(document.body.clientHeight - 350)
                .update();

        };
    });
</script>
</body>
</html>
效果截图:


 浙公网安备 33010602011771号