machine learning for hacker记录(2) 数据分析
本章主要讲了对数据的一些基本探索,常见的six numbers,方差,均值等
1 > data.file <- file.path('data', '01_heights_weights_genders.csv')
2 > heights.weights <- read.csv(data.file, header = TRUE, sep = ',')
3 > heights <- with(heights.weights, Height)
4 > summary(heights)
5    Min. 1st Qu.  Median    Mean 3rd Qu.    Max.
6   54.26   63.51   66.32   66.37   69.17   79.00
上面是six numbers:最小值,第一个四分位数,中位数(注意跟均值的区别),均值,第三个四分位数,最大值
中位数跟均值的区别:中位数 就是指数据排序后处于中间的那个数,而均值就是算术平均值,在R中可以直接用函数mean(),median()来求出。
同时,R中的quantile函数是计算数据的分位数的,默认情况是0%,25%,50%,75%,100%,例如:
1 > quantile(heights)
2       0%      25%      50%      75%     100%
3 54.26313 63.50562 66.31807 69.17426 78.99874
4 > quantile(heights,probs=seq(0,1,by=0.2))
5       0%      20%      40%      60%      80%     100%
6 54.26313 62.85901 65.19422 67.43537 69.81162 78.99874
7 > quantile(heights,probs=c(0,0.1,0.5,0.9,1))
8       0%      10%      50%      90%     100%
9 54.26313 61.41270 66.31807 71.47215 78.99874
后面两个就是自定义所需的分位数。
对于一份数据 光有six numbers 可能还不能很好的刻画数据的分布,对此统计学家引入了方差、标准差的概念,方差是明确了数据集中数据与均值的平均偏离程度,标准差是sqrt(方差)。对应R语言内置的函数var(),std()可以计算。
以上讲的是一些简单的统计学术语,接下来描述的是有关数据可视化的相关技术,并引出了一些基本的分布。
对上面heigths的数据,画出身高的频率直方图
1 ggplot(heights.weights, aes(x = Height)) +geom_histogram(binwidth = 1)
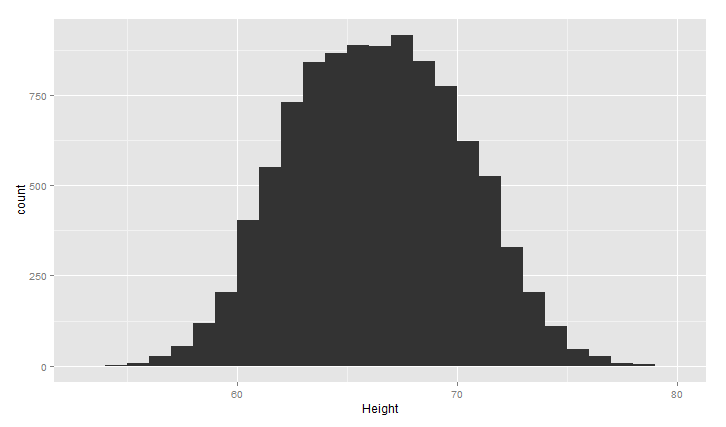
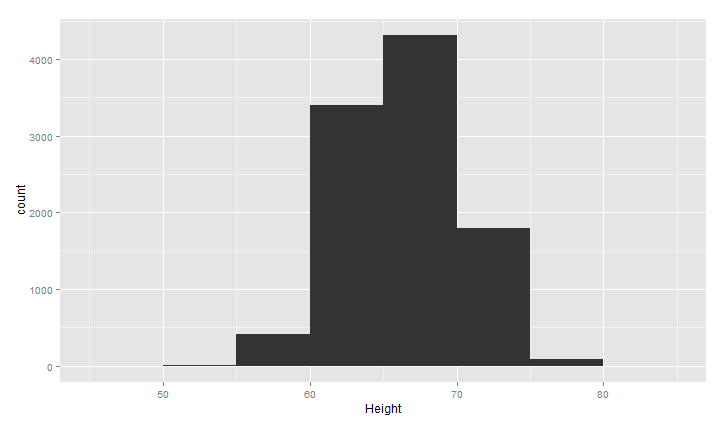
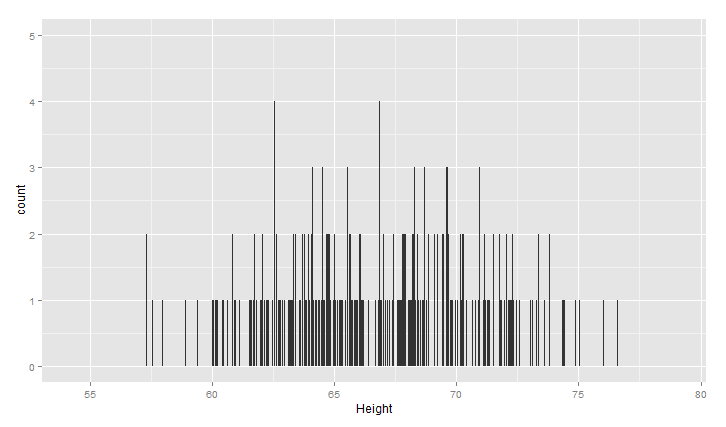
上面的图大致呈现正太分布,中间高,两边低,binwidth是直方图的宽度,设置不同,图形效果不同,下面看两种情况(过平滑和欠平滑)
1 ggplot(heights.weights, aes(x = Height)) +geom_histogram(binwidth = 5)
1 ggplot(heights.weights, aes(x = Height)) +geom_histogram(binwidth = 0.001)
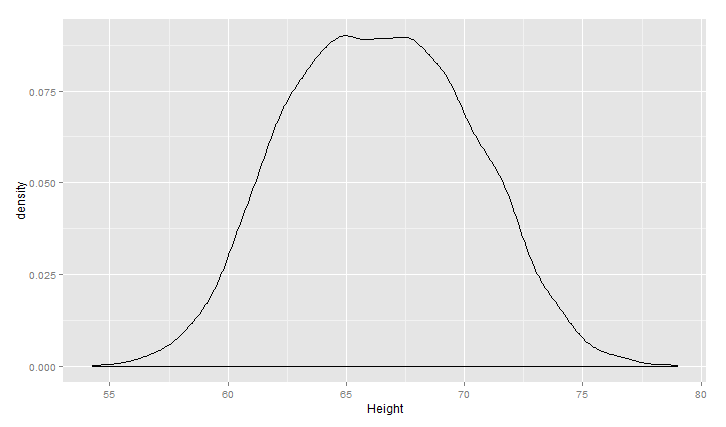
同时,可以用核密度估计KDE/密度曲线图来描述数据分布:
1 ggplot(heights.weights, aes(x = Height)) +geom_density()
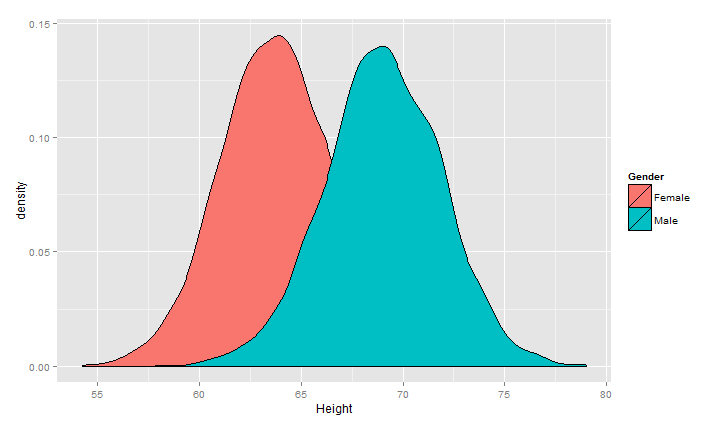
把数据样本分性别来看
1 ggplot(heights.weights, aes(x = Height,fill=Gender)) +geom_density()
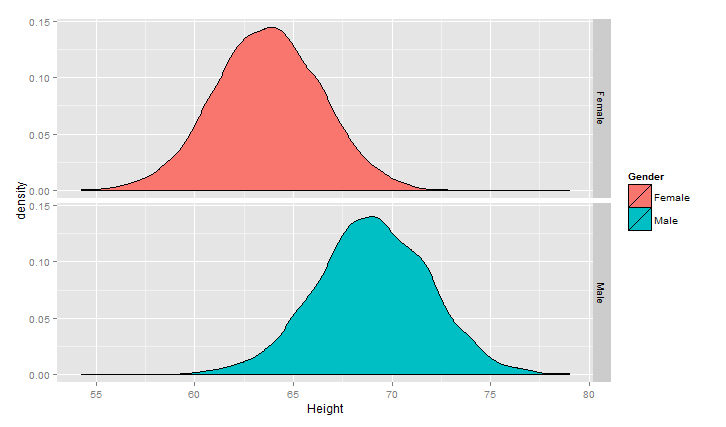
对两个曲线画成子图的模式
1 ggplot(heights.weights, aes(x = Height,fill=Gender)) +geom_density() +facet_grid(Gender~.)
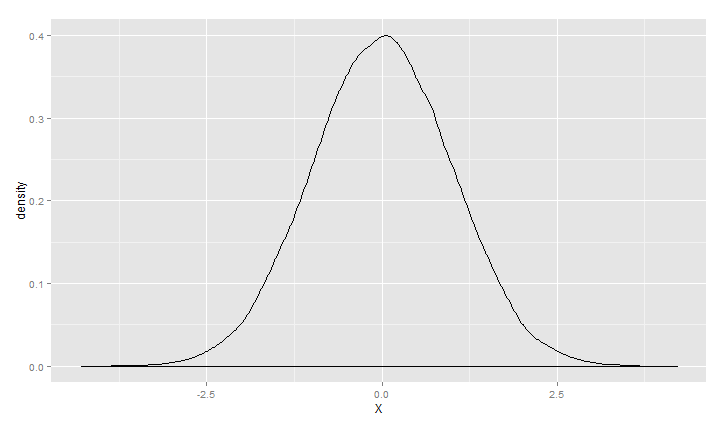
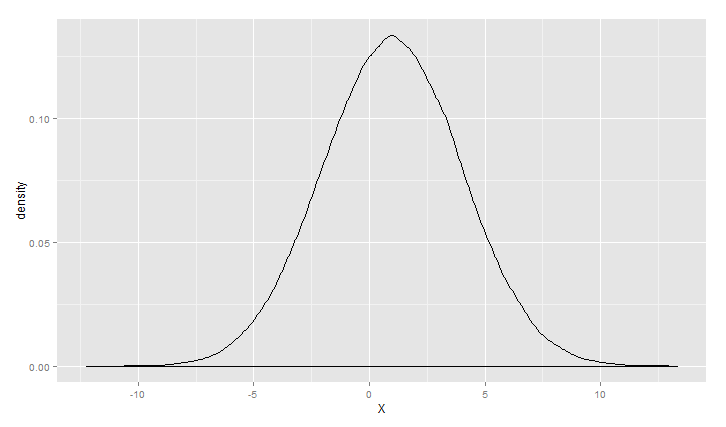
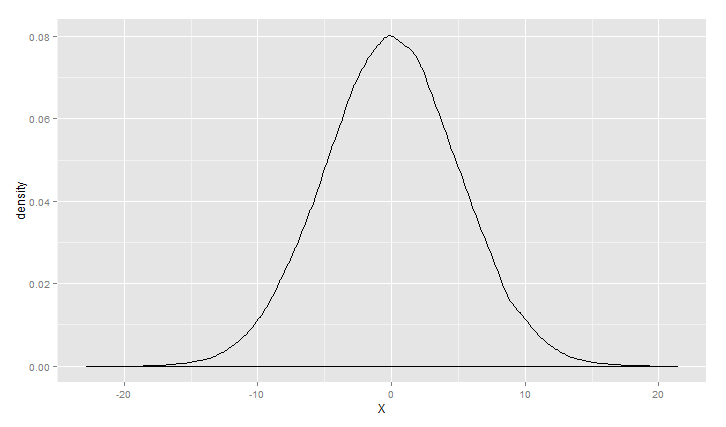
对上面的情况可以描述为高斯(正态)混合模型,正态分布应用范围非常广泛,链接http://songshuhui.net/archives/76501很清晰的讲了正态分布的“前世今生”,下面看一下高斯分布在不同均值跟方差下的 图形情况.
1 > m<-0
2 > s<-1
3 > ggplot(data.frame(X=rnorm(100000,m,s)), aes(x = X)) +geom_density()
1 > m<-1
2 > s<-3
3 > ggplot(data.frame(X=rnorm(100000,m,s)), aes(x = X)) +geom_density()
1 > m<-0
2 > s<-5
3 > ggplot(data.frame(X=rnorm(100000,m,s)), aes(x = X)) +geom_density()
正态分布在99%的情况下所产生的的数据偏离均值不会超过3个标准差,但是对于柯西分布来说,只有90%。
1 > ggplot(data.frame(X=rcauchy(100000,0,1)), aes(x = X)) +geom_density()
伽玛分布
1 >ggplot(data.frame(X=rcauchy(100000,0,1)), aes(x = X)) +geom_density()
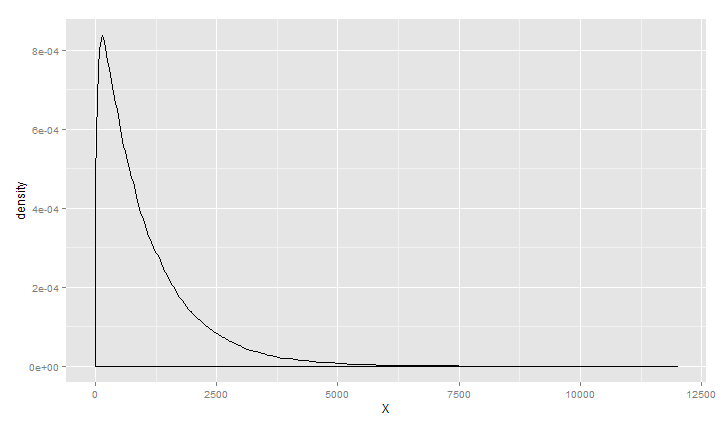
书中还统计苹果手机游戏《屋顶狂奔》的得分,KDE曲线符合伽玛分布,现实好多数据分布也是伽玛分布,如企业呼叫中心收到呼叫请求的时间间隔,还有游戏数据等等;
以上所有的绘图都是单变量的可视化,接着可以看下两个变量之间的关系
散点图
1 >ggplot(heights.weights, aes(x = Height,y=Weight)) +geom_point()

从图中看到,这两个变量存在某种关系,如越高的人,体重越大
1 >ggplot(heights.weights, aes(x = Height,y=Weight)) +geom_point() +geom_smooth()

对画图中加入性别
1 >ggplot(heights.weights, aes(x = Height,y=Weight,color=Gender)) +geom_point() +geom_smooth()
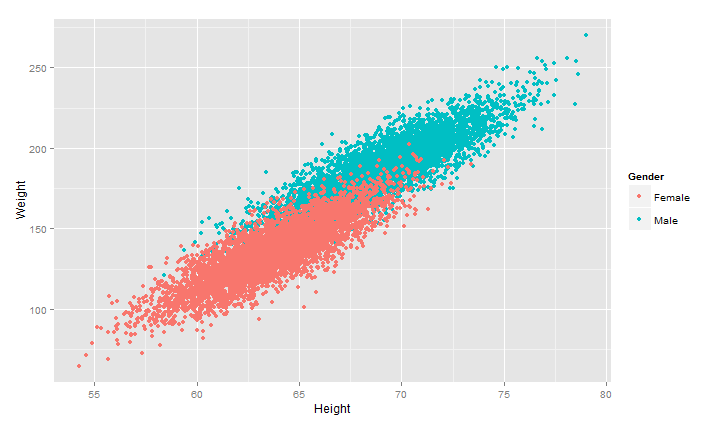
可以看出男女的分界线很鲜明,很容易用分类算法根据身高、体重来预测其性别,详细的分类算法下回分解O(∩_∩)O

 浙公网安备 33010602011771号