machine learning for hacker记录(1) R与机器学习
开篇:首先这本书的名字很霸气,全书内容讲的是R语言在机器学习上面的应用,一些基本的分类算法(tree,SVM,NB),回归算法,智能优化算法,维度约减等,机器学习领域已经有很多成熟的R工具箱,毕竟这个领域被统计学称霸了十多年,常用R工具箱都可以在这里面找到http://www.rdatamining.com/docs,http://www.mloss.org/software/
本书第一张介绍了R以及相应包的安装,同时拿了UFO数据集进行练手,数据集以及源码网上都有的
首先加载数据集(博客园的插入代码不支持R语言!!!!)
1 ufo <- read.delim(file.path("data", "ufo", "ufo_awesome.tsv"),
2                   sep = "\t",
3                   stringsAsFactors = FALSE,
4                   header = FALSE,
5                   na.strings = "")
read.* 有好多函数csv,csv2,table,delim等,具体的操作可以查看帮助文档?read.delim,这里面第一个参数路径,sep文本的分隔符,stringsAsFactors 是否转化为因子变量,header 是否有文件头 ,na.strings缺失值的处理;
加载数据集后 看看文件的头六个样本或最后六个样本(head(ufo)/tail(ufo))
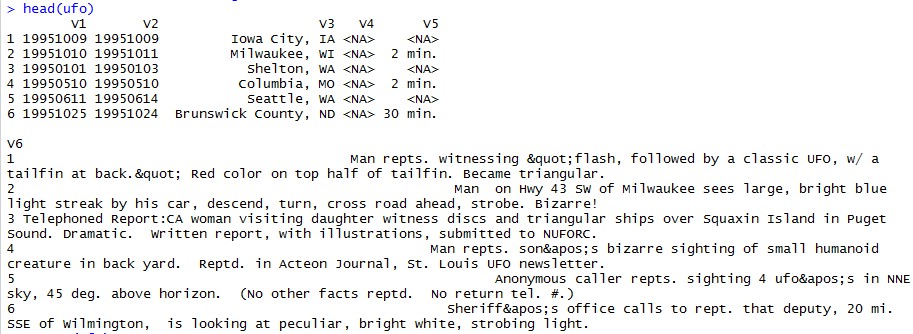
数据集中包含61869个instance,5个feature,v1,v2是第一次看到ufo的时间,向当局报道看见ufo的时间,v3是目击者所在的城市,所在的州,v4对ufo的短描述,v5看见ufo持续的时间,v6长描述
可以把v1~v6换成我们自己定义的名词
1 names(ufo) <- c("DateOccurred" , "DateReported" , "Location", "ShortDescription", "Duration", "LongDescription")
看到第1,2个feature 时间是字符串型的,这里可以转化为R的时间格式
1 ufo$DateOccurred<-as.Date(ufo$DateOccurred,format="%Y%m%d");
结果出错了,执行下面语句发现 某些样本的日期有问题
1 head(ufo[which(nchar(ufo$DateOccurred)!=8 | nchar(ufo$DateReported)!=8),1])
[1] "0000"
[2] "Callers report sighting a number of soft white  balls of lights headingin an easterly directing then changing direction to the west beforespeeding off to the north west."
[3] "0000"
[4] "0000"
[5] "0000"
[6] "0000"
这条语句的意思就是 把数据集中第一列跟第二列的字符长度不为8的 样本找出来并取前六个看看,可以看出有些样本的日期字符串是异常的,接下来看看到底有多少个这样的样本。
1 > good.rows <- ifelse(nchar(ufo$DateOccurred) != 8 | nchar(ufo$DateReported) != 8,FALSE,TRUE)
2 > length(which(!good.rows))
3 [1] 730
有730个这样的样本
这里good.rows 得到了 日期完整的样本index
更新ufo,并转化日期字符串为R内置的日期格式
1 ufo <- ufo[good.rows, ]
2 ufo$DateOccurred <- as.Date(ufo$DateOccurred, format = "%Y%m%d")
3 ufo$DateReported <- as.Date(ufo$DateReported, format = "%Y%m%d")
可以看到Location 特征是一个字符串,包含城市跟州的信息,现在想把城市跟州拆分作为两列加入到ufo数据集中。
首先定义一个函数
 1 get.location <- function(l)
 2 {
 3   split.location <- tryCatch(strsplit(l, ",")[[1]],error = function(e) return(c(NA, NA)))
 4   clean.location <- gsub("^ ","",split.location)
 5   if (length(clean.location) > 2)
 6   {
 7     return(c(NA,NA))
 8   }
 9   else
10   {
11     return(clean.location)
12   }
13 }
trycatch是异常函数,gsub是正则函数,把字符串首字符为空格的去掉,最后判断得到的clean.location的list是否长度为2,就是一个为城市一个为州,如果比如Location里面城市跟州之间有好多个逗号,那么也会被返回NA的。
把这个函数应用到数据集上
 1 > city.state <- lapply(ufo$Location, get.location)
 2 > head(city.state)
 3 [[1]]
 4 [1] "Iowa City" "IA"
 5
 6 [[2]]
 7 [1] "Milwaukee" "WI"
 8
 9 [[3]]
10 [1] "Shelton" "WA"
11
12 [[4]]
13 [1] "Columbia" "MO"
14
15 [[5]]
16 [1] "Seattle" "WA"
17
18 [[6]]
19 [1] "Brunswick County" "ND"
用到了lapply(list-apply)函数,形式apply(vector,function),然后返回特定结果
这里返回了list链表
1 > location.matrix <- do.call(rbind, city.state)
2 > ufo <- transform(ufo,
3 +                  USCity = location.matrix[, 1],
4 +                  USState = tolower(location.matrix[, 2]),
5 +                  stringsAsFactors = FALSE)
在ufo后面添加2列特征,其中USState把字母转化成了小写;
下面接着把数据集中不在美国的的样本 城市跟州都定为NA,接着抽取发生在美国的UFO样本
1 us.states<-c('ak','al','ar','az','ca','co','ct','de','fl','ga'
2              ,'hi','ia','id','il','in','ks','ky','la','ma','md'
3              ,'me','mi','mn','mo','ms','mt','nc','nd','ne','nh'
4              ,'nj','nm','nv','ny','oh','ok','or','pa','ri','sc'
5              ,'sd','tn','tx','ut','va','vt','wa','wi','wv','wy')
6 ufo$USState <- us.states[match(ufo$USState, us.states)]
7 ufo$USCity[is.na(ufo$USState)] <- NA
8 ufo.us <- subset(ufo, !is.na(ufo$USState))
ufo.us就是发生在美国目击ufo的样本,ufo.us类似跟ufo一样是个数据框,是ufo的subset
现在通过summary函数观察一下各个特征的5个统计数
> summary(ufo.us$DateOccurred)
        Min.      1st Qu.       Median         Mean      3rd Qu.         Max.
"1400-06-30" "1999-09-06" "2004-01-10" "2001-02-13" "2007-07-26" "2010-08-30"
可以看到最早的在1400年 就看到了。。最早至第一个四分位的时间跨度有点大,可以看看整个数据集样本的时间分布直方图看一看
1 quick.hist <- ggplot(ufo.us, aes(x = DateOccurred)) +
2   geom_histogram() +
3   scale_x_date(breaks = "80 years")
4
5 ggsave(plot = quick.hist,
6        filename = file.path("images", "quick_hist.pdf"),
7        height = 6,
8        width = 8)
ggsave是保存图片,也可以通过print(quick.hist)来打印至屏幕
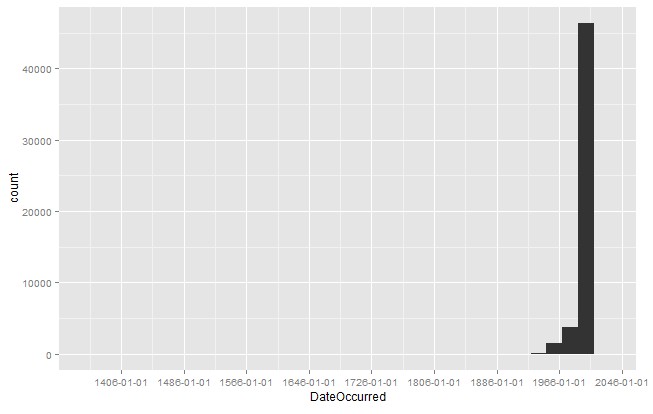
可以看出大部分时间在1960之后,继续精简数据集
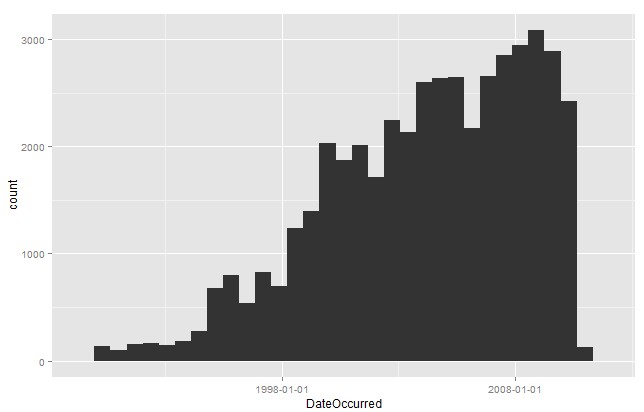
1 ufo.us <- subset(ufo.us, DateOccurred >= as.Date("1990-01-01"))
2 nrow(ufo.us)
对新数据集画直方图

 浙公网安备 33010602011771号