
ELK基础架构解说-运维笔记
一、ELK日志分析工具介绍
1) Elasticsearch
1.1) Elasticsearch介绍
ElasticSearch是一个基于Lucene的搜索服务器。它提供了一个分布式多用户能力的全文搜索引擎,基于RESTful web接口。Elasticsearch是用Java开发的,并作为Apache许可条款下的开放源码发布,是第二流行的企业搜索引擎。设计用于云计算中,能够达到实时搜索,稳定,可靠,快速,安装使用方便。
1.2) Elasticsearch几个重要术语
- NRT
elasticsearch是一个近似实时的搜索平台,从索引文档到可搜索有些延迟,通常为1秒。
- 集群
集群就是一个或多个节点存储数据,其中一个节点为主节点,这个主节点是可以通过选举产生的,并提供跨节点的联合索引和搜索的功能。集群有一个唯一性标示的名字,默认是elasticsearch,集群名字很重要,每个节点是基于集群名字加入到其集群中的。因此,确保在不同环境中使用不同的集群名字。一个集群可以只有一个节点。强烈建议在配置elasticsearch时,配置成集群模式。
- 节点
节点就是一台单一的服务器,是集群的一部分,存储数据并参与集群的索引和搜索功能。像集群一样,节点也是通过名字来标识,默认是在节点启动时随机分配的字符名。当然啦,你可以自己定义。该名字也蛮重要的,在集群中用于识别服务器对应的节点。
节点可以通过指定集群名字来加入到集群中。默认情况下,每个节点被设置成加入到elasticsearch集群。如果启动了多个节点,假设能自动发现对方,他们将会自动组建一个名为elasticsearch的集群。
- 索引
索引是有几分相似属性的一系列文档的集合。如nginx日志索引、syslog索引等等。索引是由名字标识,名字必须全部小写。这个名字用来进行索引、搜索、更新和删除文档的操作。
索引相对于关系型数据库的库。
- 类型
在一个索引中,可以定义一个或多个类型。类型是一个逻辑类别还是分区完全取决于你。通常情况下,一个类型被定于成具有一组共同字段的文档。如ttlsa运维生成时间所有的数据存入在一个单一的名为logstash-ttlsa的索引中,同时,定义了用户数据类型,帖子数据类型和评论类型。
类型相对于关系型数据库的表。
- 文档
文档是信息的基本单元,可以被索引的。文档是以JSON格式表现的。
在类型中,可以根据需求存储多个文档。
虽然一个文档在物理上位于一个索引,实际上一个文档必须在一个索引内被索引和分配一个类型。
文档相对于关系型数据库的列。
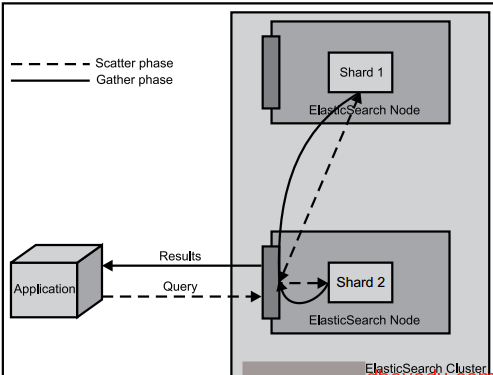
- 分片和副本
在实际情况下,索引存储的数据可能超过单个节点的硬件限制。如一个十亿文档需1TB空间可能不适合存储在单个节点的磁盘上,或者从单个节点搜索请求太慢了。为了解决这个问题,elasticsearch提供将索引分成多个分片的功能。当在创建索引时,可以定义想要分片的数量。每一个分片就是一个全功能的独立的索引,可以位于集群中任何节点上。
分片的两个最主要原因:
a) 水平分割扩展,增大存储量;
b) 分布式并行跨分片操作,提高性能和吞吐量;
分布式分片的机制和搜索请求的文档如何汇总完全是有elasticsearch控制的,这些对用户而言是透明的。
网络问题等等其它问题可以在任何时候不期而至,为了健壮性,强烈建议要有一个故障切换机制,无论何种故障以防止分片或者节点不可用。
为此,elasticsearch让我们将索引分片复制一份或多份,称之为分片副本或副本。
副本也有两个最主要原因:
a) 高可用性,以应对分片或者节点故障。出于这个原因,分片副本要在不同的节点上。
b) 提供性能,增大吞吐量,搜索可以并行在所有副本上执行。
总之,每一个索引可以被分成多个分片。索引也可以有0个或多个副本。复制后,每个索引都有主分片(母分片)和复制分片(复制于母分片)。分片和副本数量可以在每个索引被创建时定义。索引创建后,可以在任何时候动态的更改副本数量,但是,不能改变分片数。
默认情况下,elasticsearch为每个索引分片5个主分片和1个副本,这就意味着集群至少需要2个节点。索引将会有5个主分片和5个副本(1个完整副本),每个索引总共有10个分片。 每个elasticsearch分片是一个Lucene索引。一个单个Lucene索引有最大的文档数LUCENE-5843, 文档数限制为2147483519(MAX_VALUE – 128)。 可通过_cat/shards来监控分片大小。
2) Logstash
2.1) Logstash 介绍
LogStash由JRuby语言编写,基于消息(message-based)的简单架构,并运行在Java虚拟机(JVM)上。不同于分离的代理端(agent)或主机端(server),LogStash可配置单一的代理端(agent)与其它开源软件结合,以实现不同的功能。
2.2) LogStash的四大组件
Shipper:发送事件(events)至LogStash;通常,远程代理端(agent)只需要运行这个组件即可;
Broker and Indexer:接收并索引化事件;
Search and Storage:允许对事件进行搜索和存储;
Web Interface:基于Web的展示界面
正是由于以上组件在LogStash架构中可独立部署,才提供了更好的集群扩展性。
2.3) LogStash主机分类
代理主机(agent host):作为事件的传递者(shipper),将各种日志数据发送至中心主机;只需运行Logstash 代理(agent)程序;
中心主机(central host):可运行包括中间转发器(Broker)、索引器(Indexer)、搜索和存储器(Search and Storage)、Web界面端(Web Interface)在内的各个组件,以实现对日志数据的接收、处理和存储。
3) Kibana
Logstash是一个完全开源的工具,他可以对你的日志进行收集、分析,并将其存储供以后使用(如,搜索),您可以使用它。说到搜索,logstash带有一个web界面,搜索和展示所有日志。
二、使用ELK日志分析工具的必要性(解决运维痛点)
- 开发人员不能登录线上服务器查看详细日志;
- 各个系统都有日志,日志数据分散难以查找;
- 日志数据量大,查询速度慢,或者数据不够实时;
三、ELK日志分析环境部署
1) 准备机器
两台虚拟机:
hostname:linux-node1 和 linux-node2
ip地址:192.168.56.11 和 192.168.56.22
2) 系统环境(两台完全一致)
[root@linux-node2 ~]# cat /etc/redhat-release
CentOS Linux release 7.1.1503 (Core)

[root@linux-node2 ~]# uname -a
Linux linux-node2 3.10.0-229.el7.x86_64 #1 SMP Fri Mar 6 11:36:42 UTC 2015 x86_64 x86_64 x86_64 GNU/Linux

[root@linux-node2 ~]# cat /etc/hosts
127.0.0.1   localhost localhost.localdomain localhost4 localhost4.localdomain4
::1         localhost localhost.localdomain localhost6 localhost6.localdomain6
192.168.56.11 linux-node1.oldboyedu.com linux-node1
192.168.56.12 linux-node2.oldboyedu.com linux-node2
3) elk准备环境(两台完全一致)
1) elasticsearch安装
下载并安装GPG key
[root@linux-node2 ~]# rpm --import https://packages.elastic.co/GPG-KEY-elasticsearch

添加yum仓库
[root@linux-node2 ~]# vim /etc/yum.repos.d/elasticsearch.repo
[elasticsearch-2.x]
name=Elasticsearch repository for 2.x packages
baseurl=http://packages.elastic.co/elasticsearch/2.x/centos
gpgcheck=1
gpgkey=http://packages.elastic.co/GPG-KEY-elasticsearch
enabled=1

安装elasticsearch
[root@hadoop-node2 ~]# yum install -y elasticsearch

2) logstash安装
下载并安装GPG key
[root@linux-node2 ~]# rpm --import https://packages.elastic.co/GPG-KEY-elasticsearch

添加yum仓库
[root@linux-node2 ~]# vim /etc/yum.repos.d/logstash.repo
[logstash-2.1]
name=Logstash repository for 2.1.x packages
baseurl=http://packages.elastic.co/logstash/2.1/centos
gpgcheck=1
gpgkey=http://packages.elastic.co/GPG-KEY-elasticsearch
enabled=1

安装logstash
[root@linux-node2 ~]# yum install -y logstash

3) kibana安装
[root@linux-node2 ~]# cd /usr/local/src
[root@linux-node1 src]# wget https://download.elastic.co/kibana/kibana/kibana-4.3.1-linux-x64.tar.gz
[root@linux-node1 src]# tar -zvxf kibana-4.3.1-linux-x64.tar.gz
[root@linux-node1 src]# mv kibana-4.3.1-linux-x64 /usr/local/
[root@linux-node2 src]# ln -s /usr/local/kibana-4.3.1-linux-x64/ /usr/local/kibana

安装Redis,nginx和java
[root@linux-node2 ~]# yum install -y redis nginx java
4) 管理配置elasticsearch
4.1) 管理linux-node1的elasticsearch
修改elasticsearch配置文件,并授权
[root@linux-node1 src]# grep -n '^[a-Z]' /etc/elasticsearch/elasticsearch.yml
17:cluster.name: chuck-cluster        #判别节点是否是统一集群
23:node.name: linux-node1             #节点的hostname
33:path.data: /data/es-data           #数据存放路径
37:path.logs: /var/log/elasticsearch/      #日志路径
43:bootstrap.mlockall: true         #锁住内存,使内存不会再swap中使用
54:network.host: 0.0.0.0        #允许访问的ip
58:http.port: 9200          #端口

[root@linux-node1 ~]# mkdir -p /data/es-data
[root@linux-node1 src]# chown  elasticsearch.elasticsearch /data/es-data/

启动elasticsearch
[root@linux-node1 src]# systemctl start elasticsearch

[root@linux-node1 src]# systemctl enable elasticsearch
ln -s '/usr/lib/systemd/system/elasticsearch.service' '/etc/systemd/system/multi-user.target.wants/elasticsearch.service'

[root@linux-node1 src]# systemctl status elasticsearch
elasticsearch.service - Elasticsearch
   Loaded: loaded (/usr/lib/systemd/system/elasticsearch.service; enabled)
   Active: active (running) since Thu 2016-01-14 09:30:25 CST; 14s ago
     Docs: http://www.elastic.co
 Main PID: 37954 (java)
   CGroup: /system.slice/elasticsearch.service
           └─37954 /bin/java -Xms256m -Xmx1g -Djava.awt.headless=true -XX:+UseParNewGC -XX:+UseConc...
Jan 14 09:30:25 linux-node1 systemd[1]: Starting Elasticsearch...
Jan 14 09:30:25 linux-node1 systemd[1]: Started Elasticsearch.
[root@linux-node1 src]# netstat -lntup|grep 9200
tcp6       0      0 :::9200                 :::*                    LISTEN      37954/java
访问9200端口,会把信息显示出来

elasticsearch进行交互
1) 交互的两种方法
a) Java API :
node client
Transport client

b) RESTful API
Javascript
.NET
php
Perl
Python
Ruby

2) 使用RESTful API进行交互
查看当前索引和分片情况,稍后会有插件展示
[root@linux-node1 src]# curl -i -XGET 'http://192.168.56.11:9200/_count?pretty' -d '{
"query" {
     "match_all": {}
}
}'
HTTP/1.1 200 OK
Content-Type: application/json; charset=UTF-8
Content-Length: 95
{
  "count" : 0,     索引0个
  "_shards" : {    分区0个
    "total" : 0,
    "successful" : 0, 成功0个
    "failed" : 0      失败0个
  }
}

使用head插件显示索引和分片情况
[root@linux-node1 src]# /usr/share/elasticsearch/bin/plugin install mobz/elasticsearch-head
在插件中添加一个index-demo/test的索引,提交请求

发送一个GET(当然可以使用其他类型请求)请求,查询上述索引id
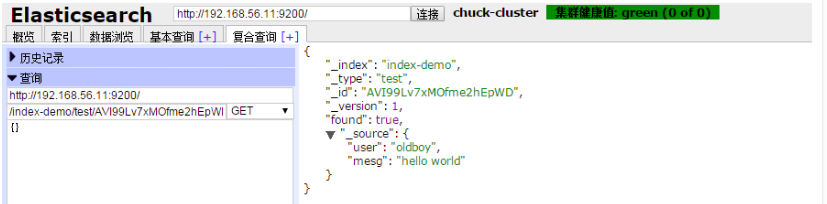
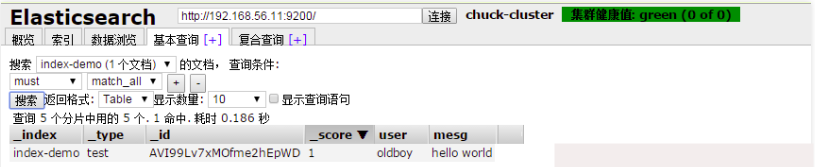
在基本查询中查看所建索引
4.2) 管理linux-node2的elasticsearch
将linux-node1的配置文件拷贝到linux-node2中,并修改配置文件并授权配置文件中cluster.name的名字一定要一致,当集群内节点启动的时候,默认使用组播(多播),寻找集群中的节点:
[root@linux-node1 src]# scp /etc/elasticsearch/elasticsearch.yml 192.168.56.12:/etc/elasticsearch/elasticsearch.yml
[root@linux-node2 elasticsearch]# sed -i '23s#node.name: linux-node1#node.name: linux-node2#g' elasticsearch.yml
[root@linux-node2 elasticsearch]# mkdir -p /data/es-data
[root@linux-node2 elasticsearch]# chown elasticsearch.elasticsearch /data/es-data/

启动elasticsearch
[root@linux-node2 elasticsearch]# systemctl enable elasticsearch.service
ln -s '/usr/lib/systemd/system/elasticsearch.service' '/etc/systemd/system/multi-user.target.wants/elasticsearch.service'
[root@linux-node2 elasticsearch]# systemctl start elasticsearch.service

[root@linux-node2 elasticsearch]# systemctl status elasticsearch.service
elasticsearch.service - Elasticsearch
   Loaded: loaded (/usr/lib/systemd/system/elasticsearch.service; enabled)
   Active: active (running) since Thu 2016-01-14 02:56:35 CST; 4s ago
     Docs: http://www.elastic.co
  Process: 38519 ExecStartPre=/usr/share/elasticsearch/bin/elasticsearch-systemd-pre-exec (code=exited, status=0/SUCCESS)
 Main PID: 38520 (java)
   CGroup: /system.slice/elasticsearch.service
           └─38520 /bin/java -Xms256m -Xmx1g -Djava.awt.headless=true -XX:+UseParNewGC -XX:+UseConc...
Jan 14 02:56:35 linux-node2 systemd[1]: Starting Elasticsearch...
Jan 14 02:56:35 linux-node2 systemd[1]: Started Elasticsearch.

在linux-node2配置中添加如下内容,使用单播模式(尝试了使用组播,但是不生效)
[root@linux-node1 ~]# grep -n "^discovery" /etc/elasticsearch/elasticsearch.yml
79:discovery.zen.ping.unicast.hosts: ["linux-node1", "linux-node2"]
[root@linux-node1 ~]# systemctl restart elasticsearch.service
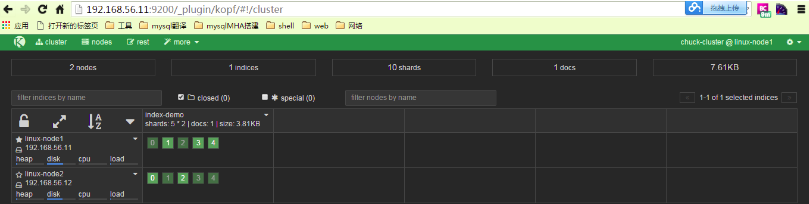
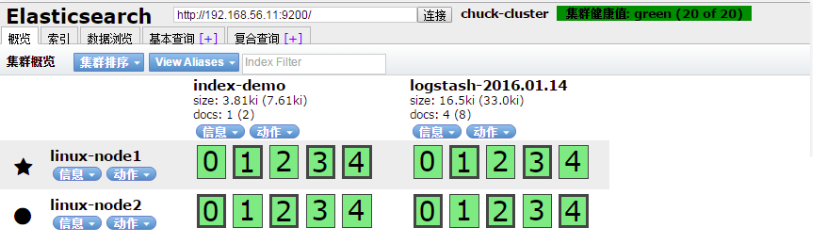
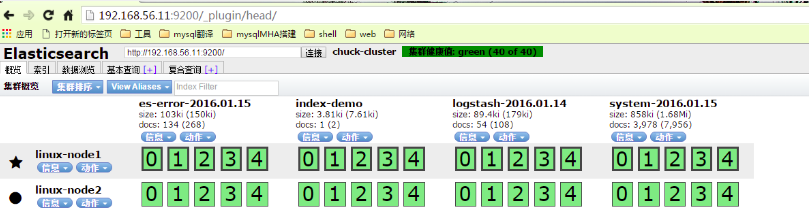
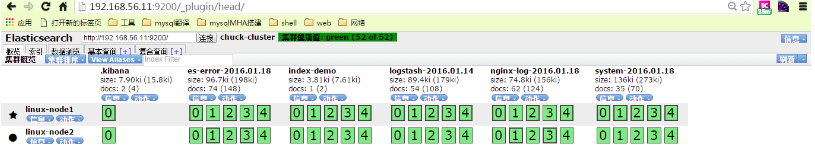
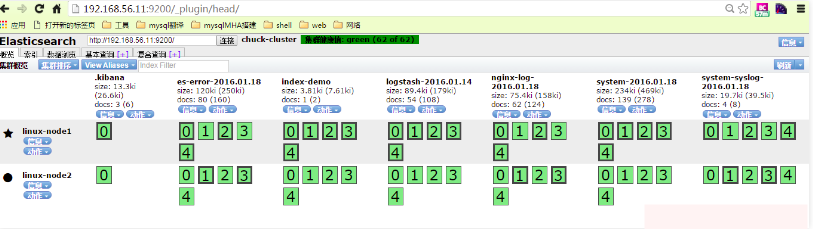
在浏览器中查看分片信息,一个索引默认被分成了5个分片,每份数据被分成了五个分片(可以调节分片数量),下图中外围带绿色框的为主分片,不带框的为副本分片,主分片丢失,副本分片会复制一份成为主分片,起到了高可用的作用,主副分片也可以使用负载均衡加快查询速度,但是如果主副本分片都丢失,则索引就是彻底丢失。

4.3) 使用kopf插件监控elasticsearch
[root@linux-node1 bin]# /usr/share/elasticsearch/bin/plugin install lmenezes/elasticsearch-kopf
从下图可以看出节点的负载,cpu适应情况,java对内存的使用(heap usage),磁盘使用,启动时间
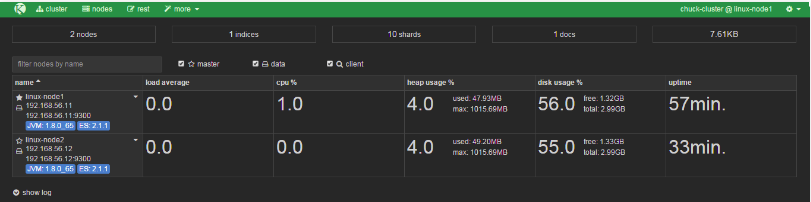
除此之外,kopf插件还提供了REST API 等,类似kopf插件的还有bigdesk,但是bigdesk目前还不支持2.1!!安装bigdesk的方法如下:
# /usr/share/elasticsearch/bin/plugin install lukas-vlcek/bigdesk
4.4) node间组播通信和分片
当第一个节点启动,它会组播发现其他节点,发现集群名字一样的时候,就会自动加入集群。随便一个节点都是可以连接的,并不是主节点才可以连接,连接的节点起到的作用只是汇总信息展示:

最初可以自定义设置分片的个数,分片一旦设置好,就不可以改变。主分片和副本分片都丢失,数据即丢失,无法恢复,可以将无用索引删除。有些老索引或者不常用的索引需要定期删除,否则会导致es资源剩余有限,占用磁盘大,搜索慢等。如果暂时不想删除有些索引,可以在插件中关闭索引,就不会占用内存了。
5) 配置Logstash
5.1) 循序渐进学习Logstash
启动一个logstash, 其中-e:在命令行执行;input输入,stdin标准输入,是一个插件;output输出,stdout:标准输出
[root@linux-node1 bin]# /opt/logstash/bin/logstash -e 'input { stdin{} } output { stdout{} }'         Settings: Default filter workers: 1
Logstash startup completed
chuck       ==>输入
2016-01-14T06:01:07.184Z linux-node1 chuck      ==>输出
www.chuck-blog.com       ==>输入
2016-01-14T06:01:18.581Z linux-node1 www.chuck-blog.com       ==>输出
使用rubudebug显示详细输出,codec为一种编解码器
[root@linux-node1 bin]# /opt/logstash/bin/logstash -e 'input { stdin{} } output { stdout{ codec => rubydebug} }'
Settings: Default filter workers: 1
Logstash startup completed
chuck       ==>输入
{
       "message" => "chuck",
      "@version" => "1",
    "@timestamp" => "2016-01-14T06:07:50.117Z",
          "host" => "linux-node1"
}        ==>使用rubydebug输出
上述每一条输出的内容称为一个事件,多个相同的输出的内容合并到一起称为一个事件(举例:日志中连续相同的日志输出称为一个事件)! 使用logstash将信息写入到elasticsearch
[root@linux-node1 bin]# /opt/logstash/bin/logstash -e 'input { stdin{} } output { elasticsearch { hosts => ["192.168.56.11:9200"] } }'
Settings: Default filter workers: 1
Logstash startup completed
maliang
chuck
chuck-blog.com
www.chuck-blog.com
在elasticsearch中查看logstash新加的索引

在elasticsearch中写一份,同时在本地输出一份,也就是在本地保留一份文本文件,也就不用在elasticsearch中再定时备份到远端一份了。此处使用的保留文本文件三大优势:1)文本最简单; 2) 文本可以二次加工; 3) 文本的压缩比最高;
[root@linux-node1 bin]# /opt/logstash/bin/logstash -e 'input { stdin{} } output { huihuisearch { hosts => ["192.168.56.11:9200"] } stdout{ codec => rubydebug } }'
Settings: Default filter workers: 1
Logstash startup completed
www.shibo.com
{
       "message" => "www.shibo.com",
      "@version" => "1",
    "@timestamp" => "2016-01-14T06:27:49.014Z",
          "host" => "linux-node1"
}
www.huihui.co
{
       "message" => "www.huihui.co",
      "@version" => "1",
    "@timestamp" => "2016-01-14T06:27:58.058Z",
          "host" => "linux-node1"
}
使用logstash启动一个配置文件,会在elasticsearch中写一份
[root@linux-node1 ~]# cat normal.conf
input { stdin { } }
output {
  elasticsearch { hosts => ["localhost:9200"] }
  stdout { codec => rubydebug }
}
[root@linux-node1 ~]# /opt/logstash/bin/logstash -f normal.conf
Settings: Default filter workers: 1
Logstash startup completed
123
{
       "message" => "123",
      "@version" => "1",
    "@timestamp" => "2016-01-14T06:51:13.411Z",
          "host" => "linux-node1
5.2) 学习编写conf格式
- 输入插件配置,此处以file为例,可以设置多个
input {
  file {
    path => "/var/log/messages"
    type => "syslog"
  }
  file {
    path => "/var/log/apache/access.log"
    type => "apache"
  }
}
- 介绍几种收集文件的方式,可以使用数组方式或者用*匹配,也可以写多个path
path => ["/var/log/messages","/var/log/*.log"]
path => ["/data/mysql/mysql.log"]
- 设置boolean值
ssl_enable => true
- 文件大小单位
my_bytes => "1113" # 1113 bytes
my_bytes => "10MiB"# 10485760 bytes
my_bytes => "100kib" # 102400 bytes
my_bytes => "180 mb" # 180000000 bytes
- jason收集
codec => “json”
- hash收集
match => {
  "field1" => "value1"
  "field2" => "value2"
  ...
}
- 端口
port => 33
- 密码
my_password => "password"
5.3) 学习编写input的file插件
input插件之input
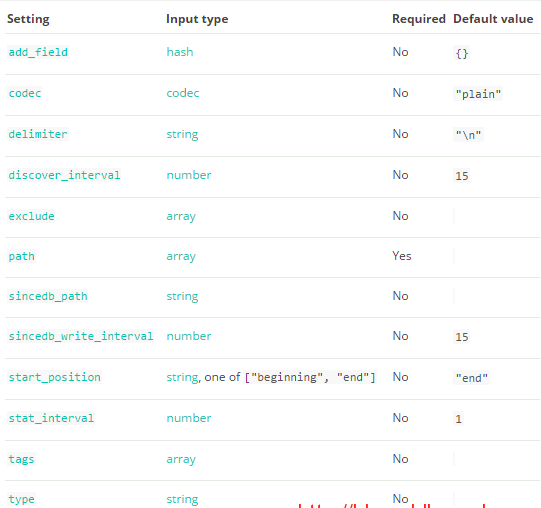
sincedb_path:记录logstash读取位置的路径
start_postion :包括beginning和end,指定收集的位置,默认是end,从尾部开始
add_field: 加一个域
discover_internal: 发现间隔,每隔多久收集一次,默认15秒
5.4) 学习编写output的file插件
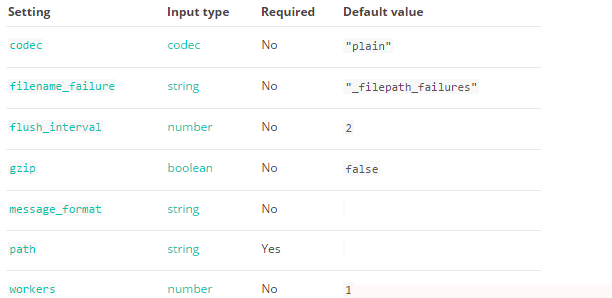
5.5) 通过input和output插件编写conf文件
- 收集系统日志的conf
[root@linux-node1 ~]# cat system.conf
input {
    file {
        path => "/var/log/messages"
        type => "system"
        start_position => "beginning"
    }
}
output {
    elasticsearch {
        hosts => ["192.168.56.11:9200"]
        index => "system-%{+YYYY.MM.dd}"
    }
}

[root@linux-node1 ~]# /opt/logstash/bin/logstash -f system.conf


- 收集elasticsearch的error日志
此处把上个system日志和这个error(java程序日志)日志,放在一起。使用if判断,两种日志分别写到不同索引中.此处的type(固定的就是type,不可更改)不可以和日志格式的任何一个域(可以理解为字段)的名称重复,也就是说日志的域不可以有type这个名称。
[root@linux-node1 ~]# cat all.conf
input {
    file {
        path => "/var/log/messages"
        type => "system"
        start_position => "beginning"
    }
    file {
        path => "/var/log/elasticsearch/chuck-cluster.log"
        type => "es-error"
        start_position => "beginning"
    }
}
output {
    if [type] == "system" {
        elasticsearch {
            hosts => ["192.168.56.11:9200"]
            index => "system-%{+YYYY.MM.dd}"
        }
    }
    if [type] == "es-error" {
        elasticsearch {
            hosts => ["192.168.56.11:9200"]
            index => "es-error-%{+YYYY.MM.dd}"
        }
    }
}

[root@linux-node1 ~]# /opt/logstash/bin/logstash -f all.conf
5.6) 把多行整个报错收集到一个事件中
举例说明

以at.org开头的内容都属于同一个事件,但是显示在不同行,这样的日志格式看起来很不方便,所以需要把他们合并到一个事件中.
- 引入codec的multiline插件
input {
  stdin {
    codec => multiline {
    `pattern => "pattern, a regexp"
      negate => "true" or "false"
      what => "previous" or "next"`
    }
  }
}
regrxp:使用正则,什么情况下把多行合并起来
negate: 正向匹配和反向匹配
what: 合并到当前行还是下一行
在标准输入和标准输出中测试以证明多行收集到一个日志成功
[root@linux-node1 ~]# cat muliline.conf
input {
    stdin {
        codec => multiline {
            pattern => "^\["
            negate => true
            what => "previous"
        }
    }
}
output {
    stdout {
        codec => "rubydebug"
    }
}

[root@linux-node1 ~]# /opt/logstash/bin/logstash -f muliline.conf
Settings: Default filter workers: 1
Logstash startup completed
[1
[2
{
    "@timestamp" => "2016-01-15T06:46:10.712Z",
       "message" => "[1",
      "@version" => "1",
          "host" => "linux-node1"
}
chuck
chuck-blog.com
123456
[3
{
    "@timestamp" => "2016-01-15T06:46:16.306Z",
       "message" => "[2\nchuck\nchuck-blog\nchuck-blog.com\n123456",
      "@version" => "1",
          "tags" => [
        [0] "multiline"
    ],
          "host" => "linux-node1"
继续将上述实验结果放到all.conf的es-error索引中
[root@linux-node1 ~]# cat all.conf
input {
    file {
        path => "/var/log/messages"
        type => "system"
        start_position => "beginning"
    }
    file {
        path => "/var/log/elasticsearch/chuck-clueser.log"
        type => "es-error"
        start_position => "beginning"
        codec => multiline {
            pattern => "^\["
            negate => true
            what => "previous"
        }
    }
}
output {
    if [type] == "system" {
        elasticsearch {
            hosts => ["192.168.56.11:9200"]
            index => "system-%{+YYYY.MM.dd}"
        }
    }
    if [type] == "es-error" {
        elasticsearch {
            hosts => ["192.168.56.11:9200"]
            index => "es-error-%{+YYYY.MM.dd}"
        }
    }
}
6) 了解 Kibana
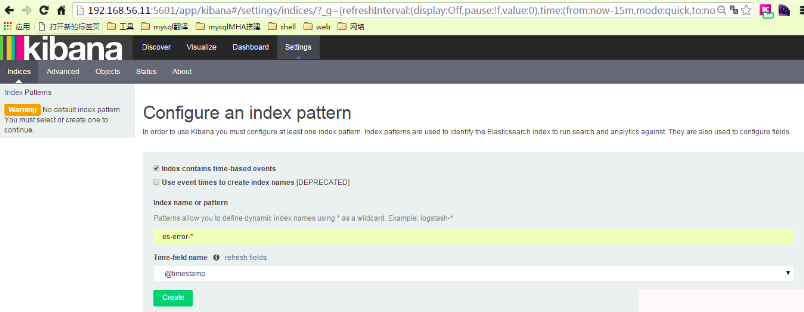
6.1) 编辑kinaba配置文件使之生效
[root@linux-node1 ~]# grep '^[a-Z]' /usr/local/kibana/config/kibana.yml
server.port: 5601          #kibana端口
server.host: "0.0.0.0"       #对外服务的主机
elasticsearch.url:  "http://192.168.56.11:9200"         #访问elasticsearch的地址
kibana.index: ".kibana                  #在elasticsearch中添加.kibana索引
开启一个screen,并启动kibana
[root@linux-node1 ~]# screen
[root@linux-node1 ~]# /usr/local/kibana/bin/kibana

注意: 使用crtl +a+d退出screen
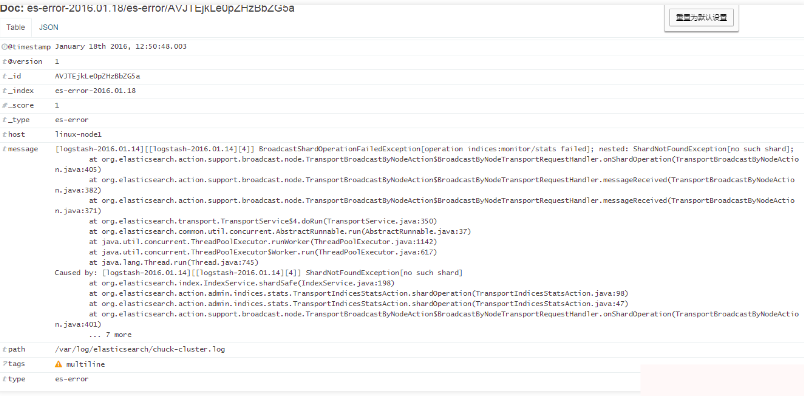
6.2) 验证error的muliline插件生效
在kibana中添加一个es-error索引
可以看到默认的字段
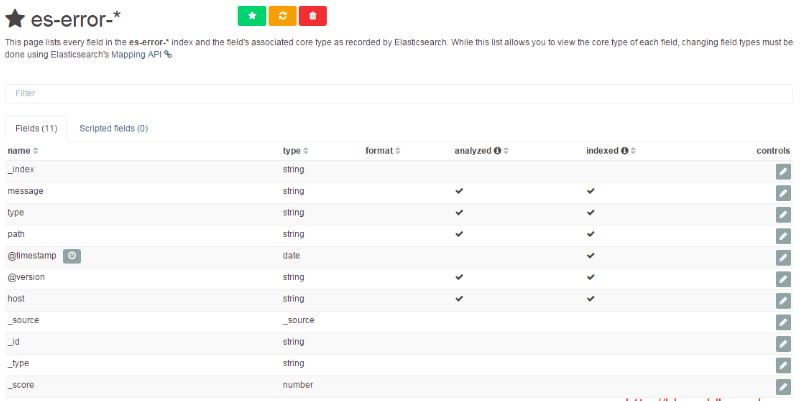
选择discover查看
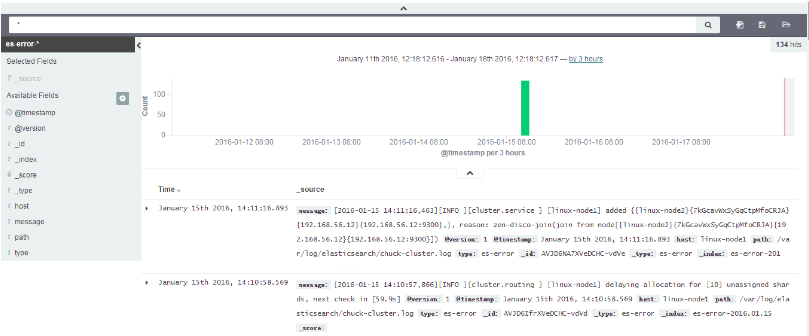
验证error的muliline插件生效
7) Logstash收集nginx、syslog和tcp日志
7.1) 收集nginx的访问日志
在这里使用codec的json插件将日志的域进行分段,使用key-value的方式,使日志格式更清晰,易于搜索,还可以降低cpu的负载
更改nginx的配置文件的日志格式,使用json
[root@linux-node1 ~]# sed -n '15,33p' /etc/nginx/nginx.conf
    log_format  main  '$remote_addr - $remote_user [$time_local] "$request" '
                      '$status $body_bytes_sent "$http_referer" '
                      '"$http_user_agent" "$http_x_forwarded_for"';
log_format json '{ "@timestamp": "$time_local", '
                         '"@fields": { '
                         '"remote_addr": "$remote_addr", '
                         '"remote_user": "$remote_user", '
                         '"body_bytes_sent": "$body_bytes_sent", '
                         '"request_time": "$request_time", '
                         '"status": "$status", '
                         '"request": "$request", '
                         '"request_method": "$request_method", '
                         '"http_referrer": "$http_referer", '
                         '"body_bytes_sent":"$body_bytes_sent", '
                         '"http_x_forwarded_for": "$http_x_forwarded_for", '
                         '"http_user_agent": "$http_user_agent" } }';
   # access_log  /var/log/nginx/access_json.log  main;
    access_log  /var/log/nginx/access.log  json;
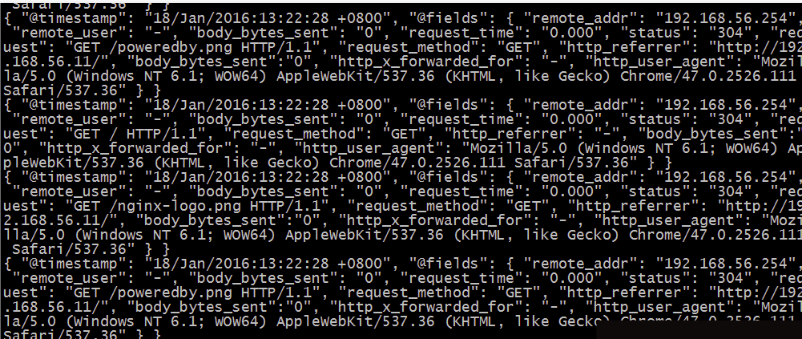
启动nginx
[root@linux-node1 ~]# nginx -t
nginx: the configuration file /etc/nginx/nginx.conf syntax is ok
nginx: configuration file /etc/nginx/nginx.conf test is successful
[root@linux-node1 ~]# nginx
[root@linux-node1 ~]# netstat -lntup|grep 80
tcp        0      0 0.0.0.0:80              0.0.0.0:*               LISTEN      43738/nginx: master
tcp6       0      0 :::80                   :::*                    LISTEN      43738/nginx: master
日志格式显示如下
使用logstash将nginx访问日志收集起来,继续写到all.conf中
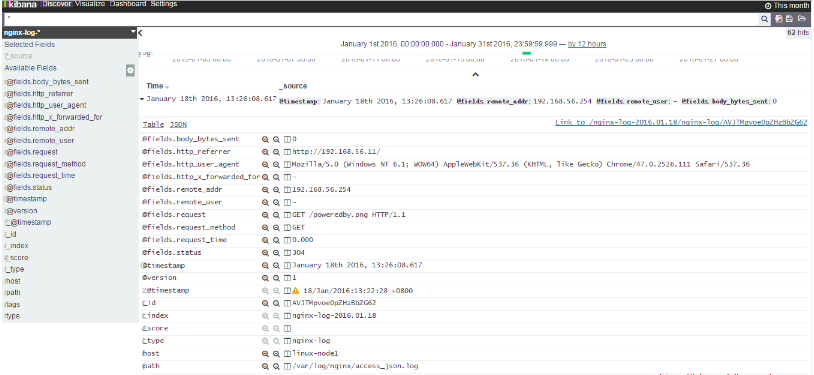
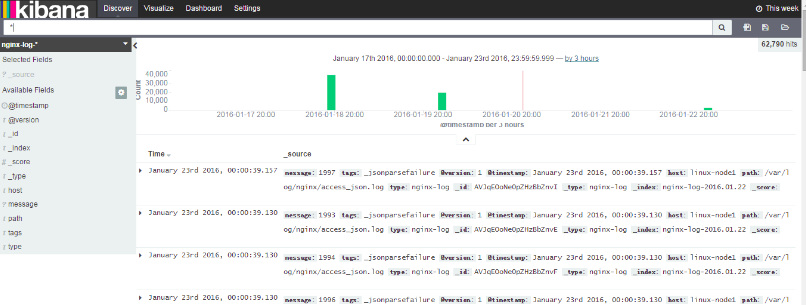
将nginx-log加入kibana中并显示
7.2) 收集系统syslog日志
前文中已经使用文件file的形式收集了系统日志/var/log/messages,但是实际生产环境是需要使用syslog插件直接收集
修改syslog的配置文件,把日志信息发送到514端口上
[root@linux-node1 ~]# vim /etc/rsyslog.conf
90 *.* @@192.168.56.11:514
将system-syslog放到all.conf中,启动all.conf
[root@linux-node1 ~]# cat all.conf
input {
    syslog {
       type => "system-syslog"
       host => "192.168.56.11"
       port => "514"
    }
    file {
        path => "/var/log/messages"
        type => "system"
        start_position => "beginning"
    }
    file {
        path => "/var/log/nginx/access_json.log"
        codec => json
        start_position => "beginning"
        type => "nginx-log"
    }
    file {
        path => "/var/log/elasticsearch/chuck-cluster.log"
        type => "es-error"
        start_position => "beginning"
        codec => multiline {
            pattern => "^\["
            negate => true
            what => "previous"
        }
    }
}
output {
    if [type] == "system" {
        elasticsearch {
            hosts => ["192.168.56.11:9200"]
            index => "system-%{+YYYY.MM.dd}"
        }
    }
    if [type] == "es-error" {
        elasticsearch {
            hosts => ["192.168.56.11:9200"]
            index => "es-error-%{+YYYY.MM.dd}"
        }
    }
    if [type] == "nginx-log" {
        elasticsearch {
            hosts => ["192.168.56.11:9200"]
            index => "nginx-log-%{+YYYY.MM.dd}"
        }
    }
    if [type] == "system-syslog" {
        elasticsearch {
            hosts => ["192.168.56.11:9200"]
            index => "system-syslog-%{+YYYY.MM.dd}"
        }
    }
}

[root@linux-node1 ~]# /opt/logstash/bin/logstash -f all.conf
在elasticsearch插件中就可见到增加的system-syslog索引
7.3) 收集tcp日志

编写tcp.conf
[root@linux-node1 ~]# cat tcp.conf
input {
    tcp {
        host => "192.168.56.11"
        port => "6666"
    }
}
output {
  stdout {
      codec => "rubydebug"
  }
}
使用nc对6666端口写入数据
[root@linux-node1 ~]# nc 192.168.56.11 6666 </var/log/yum.log
将信息输入到tcp的伪设备中
[root@linux-node1 ~]# echo "chuck" >/dev/tcp/192.168.56.11/6666
8) Logstash解耦之消息队列
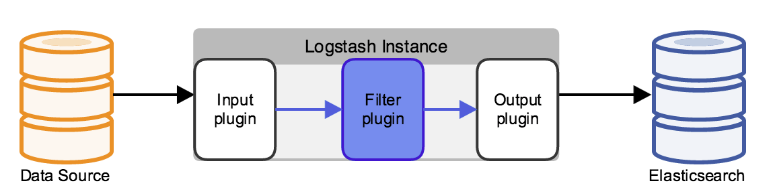
8.1) 图解使用消息队列架构
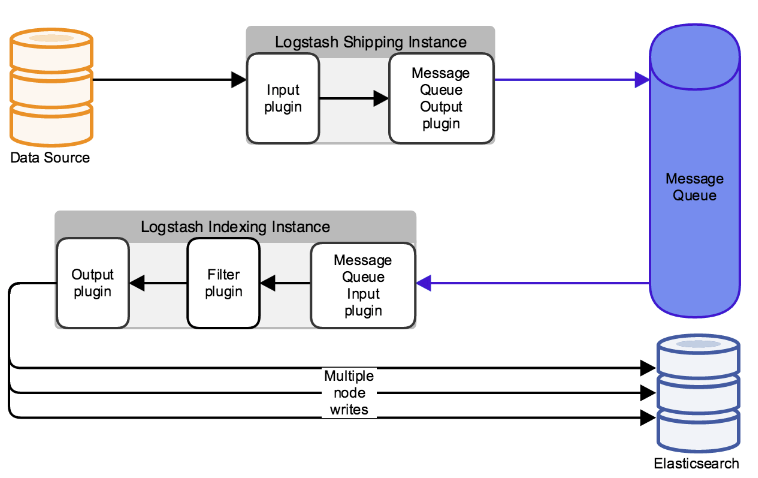
上图中,数据流向:
- 数据源Datasource把数据写到input插件中;
- output插件使用消息队列把消息写入到消息队列Message Queue中
- Logstash indexing Instance启动logstash使用input插件读取消息队列中的信息
- Fliter插件过滤后在使用output写入到elasticsearch中。如果生产环境中不适用正则grok匹配,可以写Python脚本从消息队列中读取信息,输出到elasticsearch中.
8.2 )上图架构的优点
- 解耦,松耦合
- 解除了由于网络原因不能直接连elasticsearch的情况
- 方便架构演变,增加新内容
- 消息队列可以使用rabbitmq,zeromq等,也可以使用redis,kafka(消息不删除,但是比较重量级)等.
9) 引入redis到架构中
9.1) 使用redis收集logstash的信息
修改redis的配置文件并启动redis
[root@linux-node1 ~]# vim /etc/redis.conf
 37 daemonize yes
 65 bind 192.168.56.11
[root@linux-node1 ~]# systemctl start redis
[root@linux-node1 ~]# netstat -lntup|grep 6379
tcp        0      0 192.168.56.11:6379      0.0.0.0:*               LISTEN      45270/redis-server
编写redis.conf
[root@linux-node1 ~]# cat redis-out.conf
input{
  stdin{
}
}
output{
    redis{
    host => "192.168.56.11"
    port => "6379"
    db => "6"
    data_type => "list"          #数据类型为list
    key => "demo"
}
启动配置文件输入信息
[root@linux-node1 ~]# /opt/logstash/bin/logstash -f redis-out.conf
Settings: Default filter workers: 1
Logstash startup completed
chuck
chuck-blog
使用redis-cli连接到redis并查看输入的信息
[root@linux-node1 ~]# redis-cli -h 192.168.56.11
192.168.56.11:6379> info   #输入info查看信息
# Server
redis_version:2.8.19
redis_git_sha1:00000000
redis_git_dirty:0
redis_build_id:c0359e7aa3798aa2
redis_mode:standalone
os:Linux 3.10.0-229.el7.x86_64 x86_64
arch_bits:64
multiplexing_api:epoll
gcc_version:4.8.3
process_id:45270
run_id:83f428b96e87b7354249fe42bd19ee8a8643c94e
tcp_port:6379
uptime_in_seconds:1111
uptime_in_days:0
hz:10
lru_clock:10271973
config_file:/etc/redis.conf
# Clients
connected_clients:2
client_longest_output_list:0
client_biggest_input_buf:0
blocked_clients:0
# Memory
used_memory:832048
used_memory_human:812.55K
used_memory_rss:5193728
used_memory_peak:832048
used_memory_peak_human:812.55K
used_memory_lua:35840
mem_fragmentation_ratio:6.24
mem_allocator:jemalloc-3.6.0
# Persistence
loading:0
rdb_changes_since_last_save:0
rdb_bgsave_in_progress:0
rdb_last_save_time:1453112484
rdb_last_bgsave_status:ok
rdb_last_bgsave_time_sec:0
rdb_current_bgsave_time_sec:-1
aof_enabled:0
aof_rewrite_in_progress:0
aof_rewrite_scheduled:0
aof_last_rewrite_time_sec:-1
aof_current_rewrite_time_sec:-1
aof_last_bgrewrite_status:ok
aof_last_write_status:ok
# Stats
total_connections_received:2
total_commands_processed:2
instantaneous_ops_per_sec:0
total_net_input_bytes:164
total_net_output_bytes:9
instantaneous_input_kbps:0.00
instantaneous_output_kbps:0.00
rejected_connections:0
sync_full:0
sync_partial_ok:0
sync_partial_err:0
expired_keys:0
evicted_keys:0
keyspace_hits:0
keyspace_misses:0
pubsub_channels:0
pubsub_patterns:0
latest_fork_usec:9722
# Replication
role:master
connected_slaves:0
master_repl_offset:0
repl_backlog_active:0
repl_backlog_size:1048576
repl_backlog_first_byte_offset:0
repl_backlog_histlen:0
# CPU
used_cpu_sys:1.95
used_cpu_user:0.40
used_cpu_sys_children:0.00
used_cpu_user_children:0.00
# Keyspace
db6:keys=1,expires=0,avg_ttl=0
192.168.56.11:6379> select 6   #选择db6
OK
192.168.56.11:6379[6]> keys *   #选择demo这个key
1) "demo"
192.168.56.11:6379[6]> LINDEX demo -2  #查看消息
"{\"message\":\"chuck\",\"@version\":\"1\",\"@timestamp\":\"2016-01-18T10:21:23.583Z\",\"host\":\"linux-node1\"}"
192.168.56.11:6379[6]> LINDEX demo -1   #查看消息
"{\"message\":\"chuck-blog\",\"@version\":\"1\",\"@timestamp\":\"2016-01-18T10:25:54.523Z\",\"host\":\"linux-node1\"}"
为了下一步写input插件到把消息发送到elasticsearch中,多在redis中写入写数据
[root@linux-node1 ~]# /opt/logstash/bin/logstash -f redis-out.conf
Settings: Default filter workers: 1
Logstash startup completed
chuck
chuck-blog
a
b
c
d
e
f
g
h
i
j
k
l
m
n
o
p
q
r
s
t
u
v
w
x
y
z
查看redis中名字为demo的key长度
192.168.56.11:6379[6]> llen demo
(integer) 28
9.2) 使用redis发送消息到elasticsearch中
编写redis-in.conf
[root@linux-node1 ~]# cat redis-in.conf
input{
    redis {
      host => "192.168.56.11"
      port => "6379"
      db => "6"
      data_type => "list"
      key => "demo"
}
}
output{
    elasticsearch {
     hosts => ["192.168.56.11:9200"]
     index => "redis-demo-%{+YYYY.MM.dd}"
   }
}
启动配置文件
[root@linux-node1 ~]# /opt/logstash/bin/logstash -f redis-in.conf
Settings: Default filter workers: 1
Logstash startup completed
不断刷新demo这个key的长度(读取很快,刷新一定要速度)
192.168.56.11:6379[6]> llen demo
(integer) 28
192.168.56.11:6379[6]> llen demo
(integer) 28
192.168.56.11:6379[6]> llen demo
(integer) 19                          #可以看到redis的消息正在写入到elasticsearch中
192.168.56.11:6379[6]> llen demo
(integer) 7                           #可以看到redis的消息正在写入到elasticsearch中
192.168.56.11:6379[6]> llen demo
(integer) 0
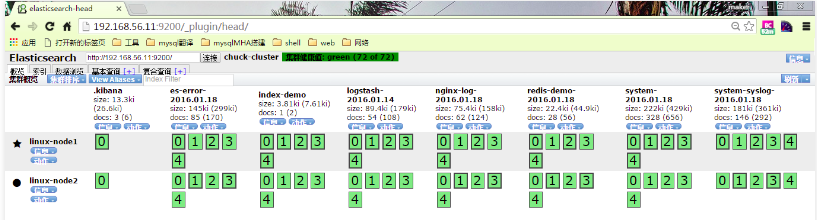
在elasticsearch中查看增加了redis-demo
9.3) 将all.conf的内容改为经由redis
编写shipper.conf作为redis收集logstash配置文件
[root@linux-node1 ~]# cp all.conf shipper.conf
[root@linux-node1 ~]# vim shipper.conf
input {
    syslog {
       type => "system-syslog"
       host => "192.168.56.11"
       port => "514"
    }
    tcp {
        type => "tcp-6666"
        host => "192.168.56.11"
        port => "6666"
    }
    file {
        path => "/var/log/messages"
        type => "system"
        start_position => "beginning"
    }
    file {
        path => "/var/log/nginx/access_json.log"
        codec => json
        start_position => "beginning"
        type => "nginx-log"
    }
    file {
        path => "/var/log/elasticsearch/chuck-cluster.log"
        type => "es-error"
        start_position => "beginning"
        codec => multiline {
            pattern => "^\["
            negate => true
            what => "previous"
        }
    }
}
output {
    if [type] == "system" {
          redis {
             host => "192.168.56.11"
             port => "6379"
             db => "6"
             data_type => "list"
             key => "system"
        }
    }
    if [type] == "es-error" {
          redis {
             host => "192.168.56.11"
             port => "6379"
             db => "6"
             data_type => "list"
             key => "es-error"
        }
        }
    if [type] == "nginx-log" {
          redis {
             host => "192.168.56.11"
             port => "6379"
             db => "6"
             data_type => "list"
             key => "nginx-log"
        }
        }
    if [type] == "system-syslog" {
          redis {
             host => "192.168.56.11"
             port => "6379"
             db => "6"
             data_type => "list"
             key => "system-syslog"
        }
    }
    if [type] == "tcp-6666" {
          redis {
             host => "192.168.56.11"
             port => "6379"
             db => "6"
             data_type => "list"
             key => "tcp-6666"
    }
 }
}
在redis中查看keys
192.168.56.11:6379[6]> select 6
OK
192.168.56.11:6379[6]> keys *
1) "system"
2) "nginx-log"
3) "tcp-6666"
编写indexer.conf作为redis发送elasticsearch配置文件
[root@linux-node1 ~]# cat indexer.conf
input {
     redis {
        type => "system-syslog"
        host => "192.168.56.11"
        port => "6379"
        db => "6"
        data_type => "list"
        key => "system-syslog"
    }
    redis {
        type => "tcp-6666"
          host => "192.168.56.11"
          port => "6379"
          db => "6"
          data_type => "list"
          key => "tcp-6666"
    }
    redis {
        type => "system"
          host => "192.168.56.11"
          port => "6379"
          db => "6"
          data_type => "list"
          key => "system"
    }
    redis {
        type => "nginx-log"
          host => "192.168.56.11"
          port => "6379"
          db => "6"
          data_type => "list"
          key => "nginx-log"
    }
    redis {
        type => "es-error"
          host => "192.168.56.11"
          port => "6379"
          db => "6"
          data_type => "list"
          key => "es-error"
        }
    }
output {
    if [type] == "system" {
          elasticsearch {
             hosts => "192.168.56.11"
             index => "system-%{+YYYY.MM.dd}"
        }
    }
    if [type] == "es-error" {
          elasticsearch {
             hosts => "192.168.56.11"
             index => "es-error-%{+YYYY.MM.dd}"
        }
        }
    if [type] == "nginx-log" {
          elasticsearch {
             hosts => "192.168.56.11"
             index => "nginx-log-%{+YYYY.MM.dd}"
        }
        }
    if [type] == "system-syslog" {
          elasticsearch {
             hosts => "192.168.56.11"
             index => "system-syslog-%{+YYYY.MM.dd}"
        }
    }
    if [type] == "tcp-6666" {
          elasticsearch {
             hosts => "192.168.56.11"
             index => "tcp-6666-%{+YYYY.MM.dd}"
    }
 }
}
启动shipper.conf
[root@linux-node1 ~]# /opt/logstash/bin/logstash -f shipper.conf
Settings: Default filter workers: 1
由于日志量小,很快就会全部被发送到elasticsearch,key也就没了,所以多写写数据到日志中
[root@linux-node1 ~]# for n in `seq 10000` ;do echo $n >>/var/log/elasticsearch/chuck-cluster.log;done
[root@linux-node1 ~]# for n in `seq 10000` ;do echo $n >>/var/log/nginx/access_json.log;done
[root@linux-node1 ~]# for n in `seq 10000` ;do echo $n >>/var/log/messages;done
查看key的长度看到key在增长
(integer) 2481
192.168.56.11:6379[6]> llen system
(integer) 2613
192.168.56.11:6379[6]> llen system
(integer) 2795
192.168.56.11:6379[6]> llen system
(integer) 2960
启动indexer.conf
[root@linux-node1 ~]# /opt/logstash/bin/logstash -f indexer.conf
Settings: Default filter workers: 1
Logstash startup completed
查看key的长度看到key在减小
192.168.56.11:6379[6]> llen nginx-log
(integer) 9680
192.168.56.11:6379[6]> llen nginx-log
(integer) 9661
192.168.56.11:6379[6]> llen nginx-log
(integer) 9661
192.168.56.11:6379[6]> llen system
(integer) 9591
192.168.56.11:6379[6]> llen system
(integer) 9572
192.168.56.11:6379[6]> llen system
(integer) 9562
kibana查看nginx-log索引
10) 学习logstash的fliter插件
10.1) 熟悉grok
前面介绍了input和output插件,在这里学习fliter插件
filter插件有很多,在这里就学习grok插件,使用正则匹配日志里的域来拆分。在实际生产中,apache日志不支持jason,就只能使用grok插件匹配;mysql慢查询日志也是无法拆分,只能石油grok正则表达式匹配拆分。
在如下链接,github上有很多写好的grok模板,可以直接引用https://github.com/logstash-plugins/logstash-patterns-core/blob/master/patterns/grok-patterns 在装好的logstash中也会有grok匹配规则,直接可以引用,路径如下:
[root@linux-node1 patterns]# pwd
/opt/logstash/vendor/bundle/jruby/1.9/gems/logstash-patterns-core-2.0.2/patterns
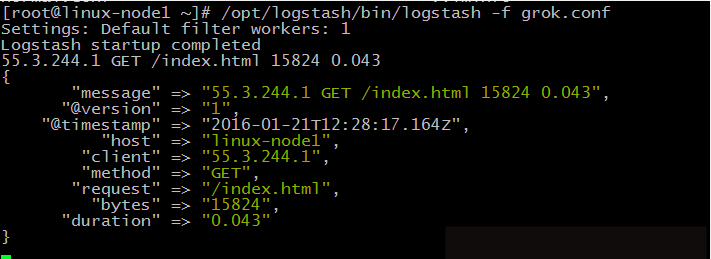
10.2) 根据官方文档提供而编写的grok.conf
[root@linux-node1 ~]# cat grok.conf
input {
   stdin {}
}
filter {
  grok {
    match => { "message" => "%{IP:client} %{WORD:method} %{URIPATHPARAM:request} %{NUMBER:bytes} %{NUMBER:duration}" }
  }
}
output {
   stdout {
    codec => "rubydebug"
   }
}
启动logstash,并根据官方文档提供输入,可得到拆分结果如下显示
10.3) 使用logstash收集mysql慢查询日志
倒入生产中mysql的slow日志,示例格式如下:
# Time: 160108 15:46:14
# User@Host: dev_select_user[dev_select_user] @  [192.168.97.86]  Id: 714519
# Query_time: 1.638396  Lock_time: 0.000163 Rows_sent: 40  Rows_examined: 939155
SET timestamp=1452239174;
SELECT DATE(create_time) as day,HOUR(create_time) as h,round(avg(low_price),2) as low_price
    FROM t_actual_ad_num_log WHERE create_time>='2016-01-07' and ad_num<=10
    GROUP BY DATE(create_time),HOUR(create_time);
使用multiline处理,并编写slow.conf
[root@linux-node1 ~]# cat mysql-slow.conf
input{
   file {
     path => "/root/slow.log"
     type => "mysql-slow-log"
     start_position => "beginning"
     codec => multiline {
        pattern => "^# User@Host:"
        negate => true
        what => "previous"
    }
  }
}
filter {
      # drop sleep events
    grok {
        match => { "message" =>"SELECT SLEEP" }
        add_tag => [ "sleep_drop" ]
        tag_on_failure => [] # prevent default _grokparsefailure tag on real records
      }
     if "sleep_drop" in [tags] {
        drop {}
     }
     grok {
        match => [ "message", "(?m)^# User@Host: %{USER:user}\[[^\]]+\] @ (?:(?<clienthost>\S*) )?\[(?:%{IP:clientip})?\]\s+Id: %{NUMBER:row_id:int}\s*# Query_time: %{NUMBER:query_time:float}\s+Lock_time: %{NUMBER:lock_time:float}\s+Rows_sent: %{NUMBER:rows_sent:int}\s+Rows_examined: %{NUMBER:rows_examined:int}\s*(?:use %{DATA:database};\s*)?SET timestamp=%{NUMBER:timestamp};\s*(?<query>(?<action>\w+)\s+.*)\n#\s*" ]
      }
      date {
        match => [ "timestamp", "UNIX" ]
        remove_field => [ "timestamp" ]
      }
}
output {
     stdout{
     codec => "rubydebug"
   }
}
执行该配置文件,查看grok正则匹配结果

11) 生产如何上线ELK
11.1) 日志分类
系统日志   rsyslog   logstash  syslog插件
访问日志   nginx     logstash  codec json
错误日志   file      logstash  file+ mulitline
运行日志   file      logstash  codec json
设备日志   syslog    logstash  syslog插件
debug日志 file      logstash  json or mulitline
10.2) 日志标准化
- 路径固定标准化
- 格式尽量使用json

 浙公网安备 33010602011771号