Python for Data Science - Multiple linear regression
Chapter 3 - Regression Models
Segment 2 - Multiple linear regression
import numpy as np
import pandas as pd

import matplotlib.pyplot as plt
from pylab import rcParams

import sklearn
from sklearn.linear_model import LinearRegression
from sklearn.preprocessing import scale
%matplotlib inline
rcParams['figure.figsize'] = 5, 4
import seaborn as sb
sb.set_style('whitegrid')
from collections import Counter
(Multiple) linear regression on the enrollment data
address = '~/Data/enrollment_forecast.csv'

enroll = pd.read_csv(address)
enroll.columns = ['year', 'roll', 'unem', 'hgrad', 'inc']
enroll.head()
| year | roll | unem | hgrad | inc | |
|---|---|---|---|---|---|
| 0 | 1 | 5501 | 8.1 | 9552 | 1923 |
| 1 | 2 | 5945 | 7.0 | 9680 | 1961 |
| 2 | 3 | 6629 | 7.3 | 9731 | 1979 |
| 3 | 4 | 7556 | 7.5 | 11666 | 2030 |
| 4 | 5 | 8716 | 7.0 | 14675 | 2112 |
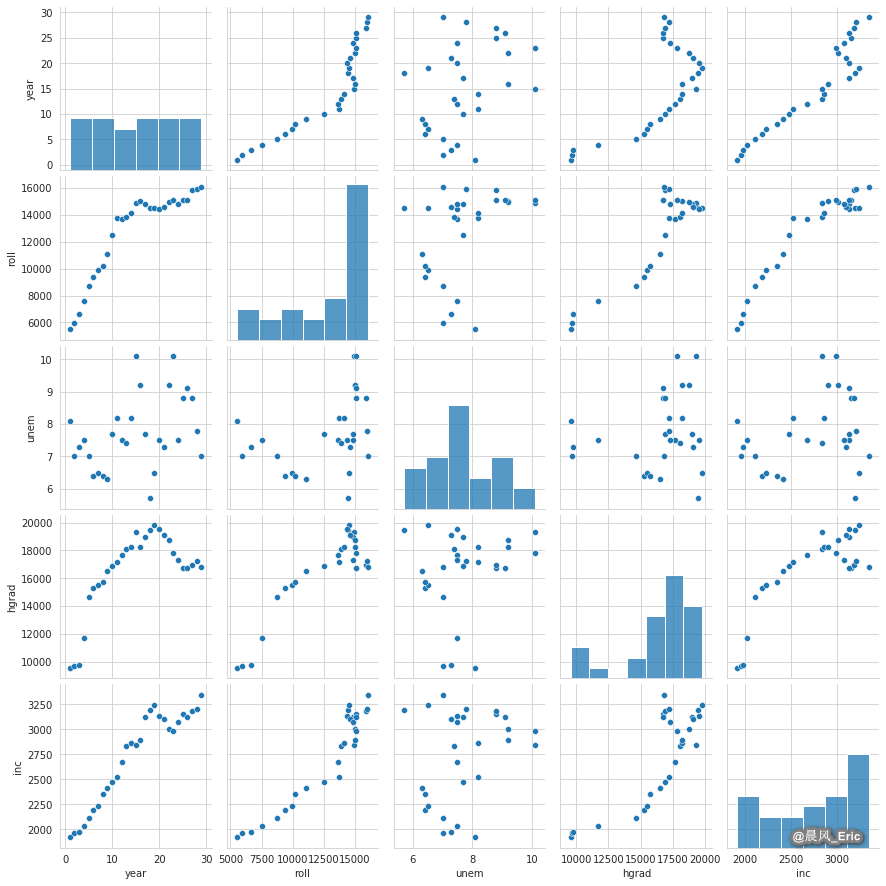
sb.pairplot(enroll)
<seaborn.axisgrid.PairGrid at 0x7f9c02deb7f0>
print(enroll.corr())
year roll unem hgrad inc
year 1.000000 0.900934 0.378305 0.670300 0.944287
roll 0.900934 1.000000 0.391344 0.890294 0.949876
unem 0.378305 0.391344 1.000000 0.177376 0.282310
hgrad 0.670300 0.890294 0.177376 1.000000 0.820089
inc 0.944287 0.949876 0.282310 0.820089 1.000000
enroll_data = enroll[['unem', 'hgrad']].values

enroll_target = enroll[['roll']].values

enroll_data_names = ['unem', 'hgrad']

X, y = scale(enroll_data), enroll_target
Checking for missing values
missing_values = X==np.NAN
X[missing_values == True]
array([], dtype=float64)
LinReg = LinearRegression(normalize=True)

LinReg.fit(X, y)

print(LinReg.score(X, y))
0.8488812666133723
相信未来 - 该面对的绝不逃避,该执著的永不怨悔,该舍弃的不再留念,该珍惜的好好把握。

 浙公网安备 33010602011771号