
python 内存监控模块之memory_profiler
0. memory_profiler是干嘛的
This is a python module for monitoring memory consumption of a process as well as line-by-line analysis of memory consumption for python programs. It is a pure python module and has the psutil module as optional (but highly recommended) dependencies.
memory_profiler是监控python进程的神器,它可以分析出每一行代码所增减的内存状况。
1. 入门例子
#del3.py
import time
@profile
def my_func():
    a = [1] * (10 ** 6)
    b = [2] * (2 * 10 ** 7)
    time.sleep(10)
    del b
    del a
    print "+++++++++"

if __name__ == '__main__':
    my_func()
结果
$python -m memory_profiler del3.py
+++++++++
Filename: del3.py

Line #    Mem usage    Increment   Line Contents
================================================
     2   10.293 MiB    0.000 MiB   @profile
     3                             def my_func():
     4   17.934 MiB    7.641 MiB       a = [1] * (10 ** 6)
     5  170.523 MiB  152.590 MiB       b = [2] * (2 * 10 ** 7)
     6  170.527 MiB    0.004 MiB       time.sleep(10)
     7   17.938 MiB -152.590 MiB       del b
     8   10.305 MiB   -7.633 MiB       del a
     9   10.309 MiB    0.004 MiB       print "+++++++++"
代码执行一遍,然后给出具体代码在某一步占用的内存,通过内存加减可以看出某个对象的大小。
2. 对象不删除,直接赋值内存是否会继续增长
#对比1
@profile
def my_func():
    a = 'a' * 1024 * 1024 * 1024;
    a = 'a' * 1024 * 1024
    a = 'a' * 1024
    del a
    print "+++++++++"

if __name__ == '__main__':
    my_func()
结果
Line #    Mem usage    Increment   Line Contents
================================================
     1   10.293 MiB    0.000 MiB   @profile
     2                             def my_func():
     3 1034.301 MiB 1024.008 MiB       a = 'a' * 1024 * 1024 * 1024;
     4   11.285 MiB -1023.016 MiB       a = 'a' * 1024 * 1024
     5   11.285 MiB    0.000 MiB       a = 'a' * 1024
     6   11.285 MiB    0.000 MiB       del a
     7   11.289 MiB    0.004 MiB       print "+++++++++"
#对比2
@profile
def my_func():
    a = 'a' * 1024 * 1024 * 1024;
    del a
    a = 'a' * 1024 * 1024
    del a
    a = 'a' * 1024
    del a
    print "+++++++++"

if __name__ == '__main__':
    my_func()
结果
Line #    Mem usage    Increment   Line Contents
================================================
     1   10.293 MiB    0.000 MiB   @profile
     2                             def my_func():
     3 1034.301 MiB 1024.008 MiB       a = 'a' * 1024 * 1024 * 1024;
     4   10.297 MiB -1024.004 MiB       del a
     5   11.285 MiB    0.988 MiB       a = 'a' * 1024 * 1024
     6   11.285 MiB    0.000 MiB       del a
     7   11.285 MiB    0.000 MiB       a = 'a' * 1024
     8   11.285 MiB    0.000 MiB       del a
     9   11.289 MiB    0.004 MiB       print "+++++++++"
结论:是否 del对象没有影响,新赋的值会替代旧的值
3. 对象赋值是否会增加同样的内存
#对比1
@profile
def my_func():
    a = 'a' * 1024 * 1024 * 1024;
    b = a
    del a
    print "+++++++++"

if __name__ == '__main__':
    my_func()
结果
Line #    Mem usage    Increment   Line Contents
================================================
     1   10.293 MiB    0.000 MiB   @profile
     2                             def my_func():
     3 1034.301 MiB 1024.008 MiB       a = 'a' * 1024 * 1024 * 1024;
     4 1034.301 MiB    0.000 MiB       b = a
     5 1034.301 MiB    0.000 MiB       del a
     6 1034.305 MiB    0.004 MiB       print "+++++++++"
#对比2
@profile
def my_func():
    a = 'a' * 1024 * 1024 * 1024;
    b = a
    del a
    del b
    print "+++++++++"

if __name__ == '__main__':
    my_func()
结果
Line #    Mem usage    Increment   Line Contents
================================================
     1   10.297 MiB    0.000 MiB   @profile
     2                             def my_func():
     3 1034.305 MiB 1024.008 MiB       a = 'a' * 1024 * 1024 * 1024;
     4 1034.305 MiB    0.000 MiB       b = a
     5 1034.305 MiB    0.000 MiB       del a
     6   10.301 MiB -1024.004 MiB       del b
     7   10.305 MiB    0.004 MiB       print "+++++++++"
结论,把a赋值给b,内存没有增加。但是只删除其中一个对象的时候,内存不会减。
4. 另一种等价的启动方式
from memory_profiler import profile
@profile(precision=4)
def my_func():
    a = 'a' * 1024 * 1024 * 1024;
    del a
    a = 'a' * 1024 * 1024
    del a
    a = 'a' * 1024
    del a
    print "+++++++++"

if __name__ == '__main__':
    my_func()
结果
$python -m memory_profiler del3.py
+++++++++
Filename: del3.py

Line #    Mem usage    Increment   Line Contents
================================================
     2  10.3867 MiB   0.0000 MiB   @profile(precision=4)
     3                             def my_func():
     4 1034.3945 MiB 1024.0078 MiB       a = 'a' * 1024 * 1024 * 1024;
     5  10.3906 MiB -1024.0039 MiB       del a
     6  11.3789 MiB   0.9883 MiB       a = 'a' * 1024 * 1024
     7  11.3789 MiB   0.0000 MiB       del a
     8  11.3789 MiB   0.0000 MiB       a = 'a' * 1024
     9  11.3789 MiB   0.0000 MiB       del a
    10  11.3828 MiB   0.0039 MiB       print "+++++++++"
5. 非python内置对象例子
from memory_profiler import profile
import networkx as nx

@profile(precision=4)
def my_func():
    a = 'a' * 1024 * 1024 * 1024;
    del a
    G = nx.Graph()
    G.add_node(1)
    G.add_nodes_from([i for i in range(10000)])
    G.add_nodes_from([i for i in range(10000, 20000)])
    G.add_edges_from([(1,2), (1,4), (2, 9), (4, 1), (3, 8)])
    del G
    print "++++++"

if __name__ == '__main__':
    my_func()
结果
$python del3.py
++++++
Filename: del3.py

Line #    Mem usage    Increment   Line Contents
================================================
     4  23.4844 MiB   0.0000 MiB   @profile(precision=4)
     5                             def my_func():
     6 1047.4922 MiB 1024.0078 MiB       a = 'a' * 1024 * 1024 * 1024;
     7  23.4883 MiB -1024.0039 MiB       del a
     8  23.4883 MiB   0.0000 MiB       G = nx.Graph()
     9  23.4883 MiB   0.0000 MiB       G.add_node(1)
    10  31.3359 MiB   7.8477 MiB       G.add_nodes_from([i for i in range(10000)])
    11  36.9219 MiB   5.5859 MiB       G.add_nodes_from([i for i in range(10000, 20000)])
    12  36.9219 MiB   0.0000 MiB       G.add_edges_from([(1,2), (1,4), (2, 9), (4, 1), (3, 8)])
    13  25.9219 MiB -11.0000 MiB       del G
    14  25.9258 MiB   0.0039 MiB       print "++++++"
6. 类怎么使用呢
#del4.py
from memory_profiler import profile

class people:
    name = ''
    age = 0
    __weight = 0

    def __init__(self,n,a,w):
        self.name = n
        self.age = a
        self.__weight = w

    @profile(precision=4)
    def speak(self):
        a = 'a' * 1024
        b = 'b' * 1024 * 1024
        print("%s is speaking: I am %d years old" % (self.name,self.age))


if __name__ == '__main__':
    p = people('tom', 10, 30)
    p.speak()
结果
$python del4.py
tom is speaking: I am 10 years old
Filename: del4.py

Line #    Mem usage    Increment   Line Contents
================================================
    13   9.4219 MiB   0.0000 MiB       @profile(precision=4)
    14                                 def speak(self):
    15   9.4258 MiB   0.0039 MiB           a = 'a' * 1024
    16  10.4297 MiB   1.0039 MiB           b = 'b' * 1024 * 1024
    17  10.4336 MiB   0.0039 MiB           print("%s is speaking: I am %d years old" % (self.name,self.age))
7. 随时间内存统计
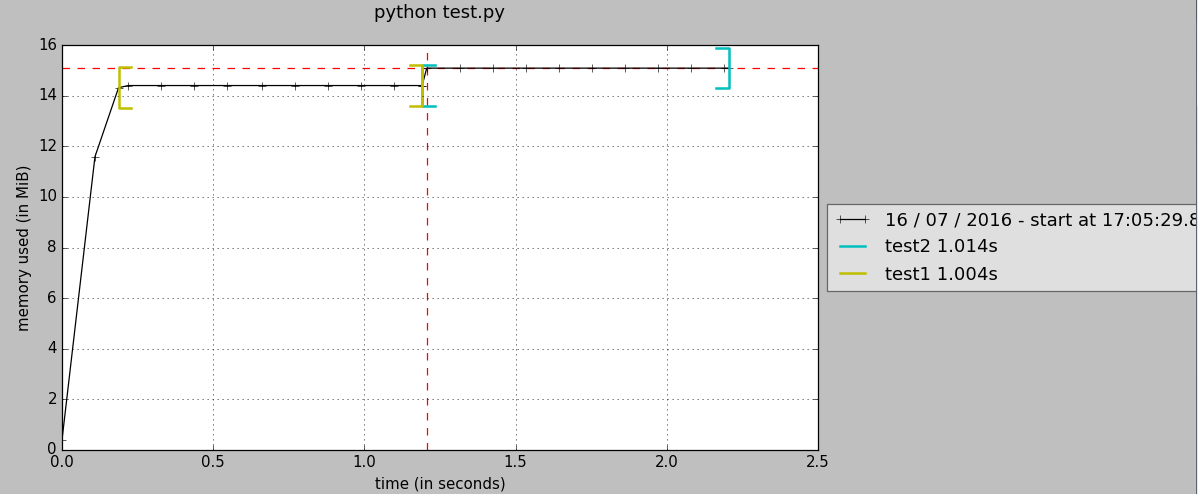
#test.py
import time

@profile
def test1():
    n = 10000
    a = [1] * n
    time.sleep(1)
    return a

@profile
def test2():
    n = 100000
    b = [1] * n
    time.sleep(1)
    return b

if __name__ == "__main__":
    test1()
    test2()
test.py 里有两个两个待分析的函数(@profile标识),为了形象地看出内存随时间的变化,每个函数内sleep 1s,执行
mprof run test.py
如果执行成功,结果这样
$ mprof run test.py
mprof: Sampling memory every 0.1s
running as a Python program...
结果会生成一个.dat文件,如"mprofile_20160716170529.dat",里面记录了内存随时间的变化,可用下面的命令以图片的形式展示出来:
mprof plot
8. API
memory_profiler提供很多包给第三方代码,如
>>> from memory_profiler import memory_usage
>>> mem_usage = memory_usage(-1, interval=.2, timeout=1)
>>> print(mem_usage)
    [7.296875, 7.296875, 7.296875, 7.296875, 7.296875]
memory_usage(proc=-1, interval=.2, timeout=None)返回一段时间的内存值,其中proc=-1表示此进程,这里可以指定特定的进程号;interval=.2表示监控的时间间隔是0.2秒;timeout=1表示总共的时间段为1秒。那结果就返回5个值。
如果要返回一个函数的内存消耗,示例
def f(a, n=100):
     import time
     time.sleep(2)
     b = [a] * n
     time.sleep(1)
     return b

from memory_profiler import memory_usage
print memory_usage((f, (2,), {'n' : int(1e6)}))
这里执行了 f(1, n=int(1e6)) ,并返回在执行此函数时的内存消耗。
9. 优化实例
对比str & int
from datetime import datetime
@profile
def my_func():
    beg = datetime.now()
    a = {}
    for i in range(1000000):
        a[i] = i
        #a[str(i)] = i
    print "+++++++++"
    del a
    print "+++++++++"
    end = datetime.now()
    print "time:", end - beg

if __name__ == '__main__':
    my_func()
用a[i] = i,结果
+++++++++
+++++++++
time: 0:06:14.790899
Filename: int.py

Line #    Mem usage    Increment   Line Contents
================================================
     2   14.727 MiB    0.000 MiB   @profile
     3                             def my_func():
     4   14.734 MiB    0.008 MiB       beg = datetime.now()
     5   14.734 MiB    0.000 MiB       a = {}
     6   94.031 MiB   79.297 MiB       for i in range(1000000):
     7   94.031 MiB    0.000 MiB           a[i] = i
     8                                     #a[str(i)] = i
     9   86.402 MiB   -7.629 MiB       print "+++++++++"
    10   38.398 MiB  -48.004 MiB       del a
    11   38.398 MiB    0.000 MiB       print "+++++++++"
    12   38.398 MiB    0.000 MiB       end = datetime.now()
    13   38.406 MiB    0.008 MiB       print "time:", end - beg
用a[str(i)] = i,结果
+++++++++
+++++++++
time: 0:06:00.288052
Filename: int.py

Line #    Mem usage    Increment   Line Contents
================================================
     2   14.723 MiB    0.000 MiB   @profile
     3                             def my_func():
     4   14.730 MiB    0.008 MiB       beg = datetime.now()
     5   14.730 MiB    0.000 MiB       a = {}
     6  140.500 MiB  125.770 MiB       for i in range(1000000):
     7                                     #a[i] = i
     8  140.500 MiB    0.000 MiB           a[str(i)] = i
     9  132.871 MiB   -7.629 MiB       print "+++++++++"
    10   38.539 MiB  -94.332 MiB       del a
    11   38.539 MiB    0.000 MiB       print "+++++++++"
    12   38.539 MiB    0.000 MiB       end = datetime.now()
    13   38.547 MiB    0.008 MiB       print "time:", end - beg

 浙公网安备 33010602011771号