

微信小程序使用echarts规范做法
近来在开发微信小程序时,需要用到echarts图表,于是在网上搜索了一番,发现虽然能在微信页面上展示出来,但代码比较混乱,破坏了微信小程序的代码结构,于是经过不断摸索,总结出了一套比较规范的做法,记录下来供自己以后使用参照,也供大家参考。
所需材料:
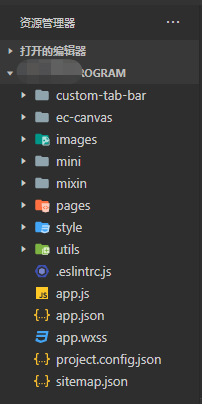
1.下载echarts的微信小程序版本:echarts-for-weixin ,已经有大侠做好了,地址在:https://github.com/ecomfe/echarts-for-weixin,下载后解压,只需要其中的ec-canvas文件夹。将其复制到微信小程序的根目录(本文做法,复制到其他目录也可以,只是需要修改相应的调用路径)。项目的结构如下:
2.在需要引用echarts的页面json文件中,添加echarts引用(注意echarts的相对路径):
{
  "usingComponents": {
    "ec-canvas": "../../ec-canvas/ec-canvas"
  },
  "navigationBarTitleText": "详情"
}
3.在需要引用echarts的js文件中,引入echars.js:
import * as echarts from '../../ec-canvas/echarts';
实现步骤:
步骤一:严格按照微信小程序页面的代码结构,定义setOption方法:也就是vue的方法定义的规范做法。
步骤二:在data区域声明echarts懒加载(稍后在ajax回调中加载)。并声明echarts的html作业区域组件。
步骤三:在ajax的回调方法中调用echarts的初始化方法,并填充数据,展示图表。
代码实例一(在页面的js文件中的page区域内,添加setOption方法):
setOption:function (chart, d1, d2,d3) {
        var seriesLabel = {
            normal : {
                show : true,
                //textBorderColor : '#333',
                //textBorderWidth : 1
            }
        }
        var option = {
            title : {
                subtext : '万元',
                x : 'right'
            },
            tooltip : {
                trigger : 'axis',
                axisPointer : {
                    type : 'shadow'
                }
            },
            legend : {
                data : [ '金额', '单价', '总价' ],
                bottom : 0
            },
            grid : {
                top : '3%',
                left : '3%',
                bottom:'15%',
                containLabel : true
            },
            xAxis : {
                type : 'value',
                name : '',
                axisLabel : {
                    formatter : '{value}'
                },
                axisLine: {show:true}
            },
            yAxis : {
                type : 'category',
                data : [ '详情' ],
                inverse : false
            },
            series : [ {
                name : '金额',
                type : 'bar',
                data : [d1],
                label : seriesLabel,
            }, {
                name : '单价',
                type : 'bar',
                label : seriesLabel,
                data : [d2]
            }, {
                name : '总价',
                type : 'bar',
                label : seriesLabel,
                data : [d3]
            } ]
        };
        chart.setOption(option);
    }
代码示例二:
data: {
        ec: {
            lazyLoad: true
        },
    },
代码示例三:
 onLoad: function (options) {
        this.oneComponent = this.selectComponent('#mychart-dom-bar');

        this.getDetail();
    },
ajax回调部分代码:
 success: (res) => {
                if (res.data.flag == true) {
                    this.oneComponent.init((canvas, width, height) => {
                        const chart = echarts.init(canvas, null, {
                          width: width,
                          height: height
                        });
                        this.setOption(chart, this.data.Price, this.data.unitPrice, this.data.totalPrice);
                        //this.chart = chart;
                        //return chart;
                      });
                } else {
                    wx.showModal({
                        title: '提示',
                        content: '获取详情失败'
                    })
                }
            }
而view页面定义为:
    <view class="box">
        <ec-canvas id="mychart-dom-bar" canvas-id="mychart-bar" ec="{{ ec }}"></ec-canvas>
    </view>
css为:
.box {
    width:98%;
    height:200px;
}
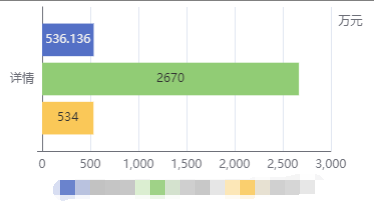
效果如下:

 浙公网安备 33010602011771号