


03.调色盘的使用.html
<!DOCTYPE html>
<html lang="en">
<head>
<meta charset="UTF-8">
<meta name="viewport" content="width=device-width, initial-scale=1.0">
<meta http-equiv="X-UA-Compatible" content="ie=edge">
<title>Document</title>
<script src="lib/echarts.min.js"></script>
<script src="theme/itcast.js"></script>
</head>
<body>
<div style="width: 600px;height:400px"></div>
<script>
var mCharts = echarts.init(document.querySelector("div"), 'itcast')
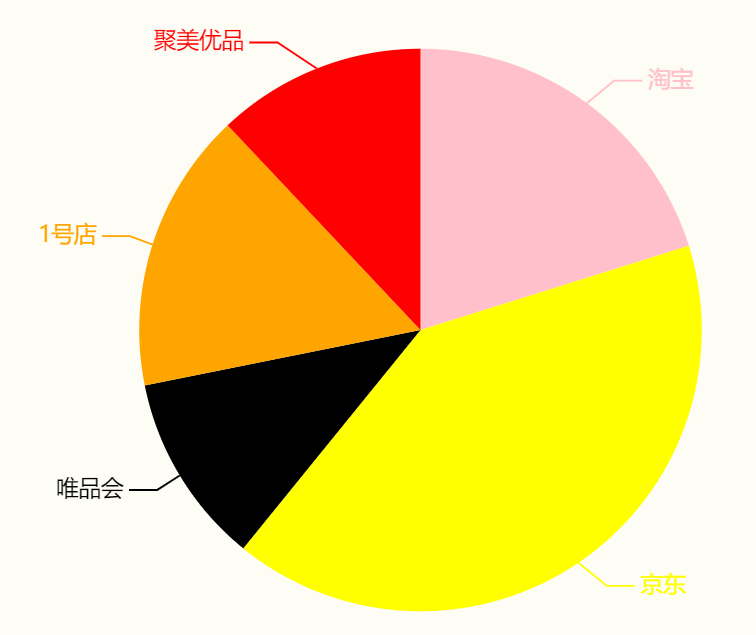
var pieData = [
{
value: 11231,
name: "淘宝",
},
{
value: 22673,
name: "京东"
},
{
value: 6123,
name: "唯品会"
},
{
value: 8989,
name: "1号店"
},
{
value: 6700,
name: "聚美优品"
}
]
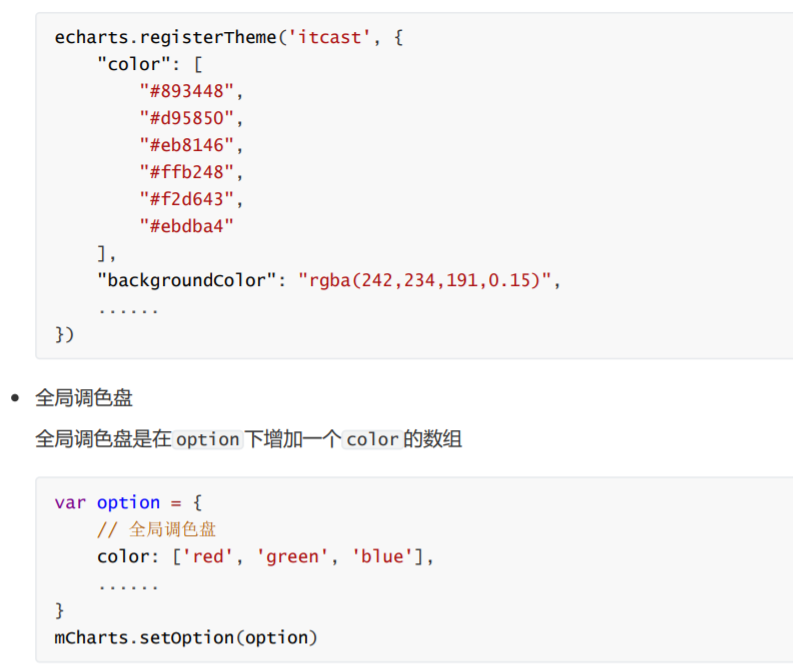
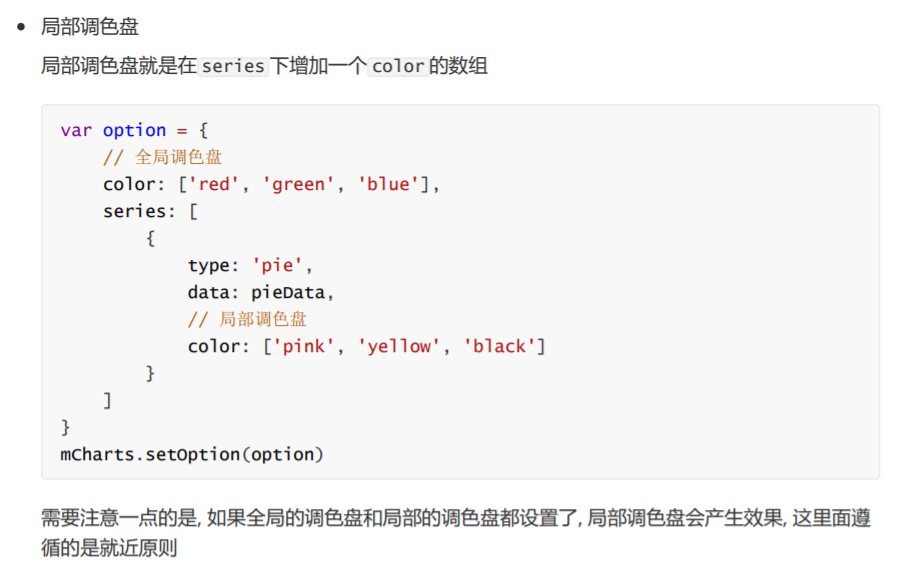
var option = {
color: ['red', 'green', 'blue', 'skyblue', 'purple'],
series: [
{
type: 'pie',
data: pieData,
color: ['pink', 'yellow', 'black', 'orange', 'red']
}
]
};
mCharts.setOption(option)
</script>
</body>
</html>
04.颜色渐变的使用.html
<!DOCTYPE html>
<html lang="en">
<head>
<meta charset="UTF-8">
<meta name="viewport" content="width=device-width, initial-scale=1.0">
<meta http-equiv="X-UA-Compatible" content="ie=edge">
<title>Document</title>
<script src="lib/echarts.min.js"></script>
</head>
<body>
<div style="width: 600px;height:400px"></div>
<script>
var mCharts = echarts.init(document.querySelector("div"))
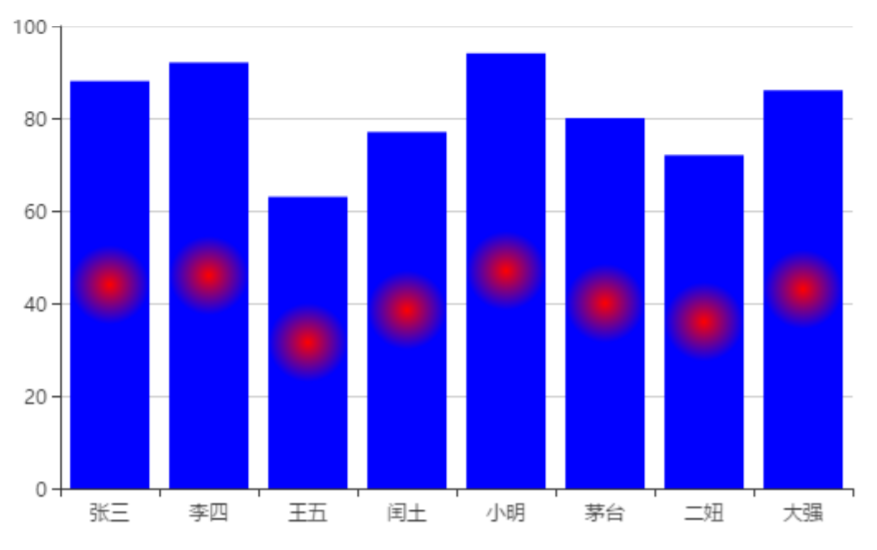
var xDataArr = ['张三', '李四', '王五', '闰土', '小明', '茅台', '二妞', '大强']
var yDataArr = [88, 92, 63, 77, 94, 80, 72, 86]
var option = {
xAxis: {
type: 'category',
data: xDataArr
},
yAxis: {
type: 'value'
},
series: [
{
type: 'bar',
data: yDataArr,
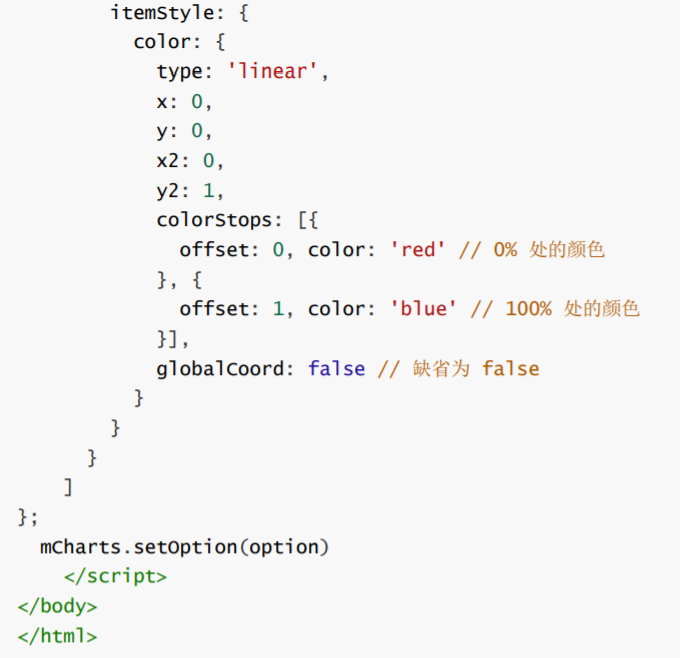
itemStyle: {
color: {
type: 'linear', // 线性渐变
// 【方向】
x: 0,
y: 0,
x2: 0,
// y2: 1, // 【经试验,柱状条从上到下,全部渐变】
y2: 0.5, // 【经试验,柱状条从上到下,50%的高度渐变】
colorStops: [
{
offset: 0, color: '#f99' // 0%处的颜色为红色
},
{
offset: 1, color: 'yellowgreen' // 100%处的颜色为红色
},
// {
// offset: 0.7, color: 'skyblue' // 100%处的颜色为蓝
// },
// {
// offset: 1, color: 'teal' // 100%处的颜色为蓝
// }
]
},
/* color: {
type: 'radial', // 径向渐变
x: 0.5,
y: 0.5,
r: 0.5,
colorStops: [
{
offset: 0, color: 'red' // 0%处的颜色为红色
},
{
offset: 1, color: 'blue' // 100%处的颜色为蓝
}
]
} */
}
}
]
}
mCharts.setOption(option)
</script>
</body>
</html>


 浙公网安备 33010602011771号