第二章 Promethus-2.26和Grafana集成
官网:https://prometheus.io/

下载地址:https://prometheus.io/download/
一、环境设置
| 名称 | 公网IP | 内网IP | 主机名 |
|---|---|---|---|
| Prometheus、Grafana、node_exporter | 139.196.79.176 | 172.19.90.51 | ga002 |
| node_exporter | 139.224.227.189 | 172.19.72.206 | ga001 |
| node_exporter | 139.224.223.153 | 172.19.72.207 | gw001 |
| node_exporter、mysqld_exporter | 47.100.226.16 | 172.19.54.147 | gd001 |
| node_exporter | 47.102.86.70 | 172.19.90.50 | ga003 |
二、下载相关软件(全部安装在/opt路径)
从 https://prometheus.io/download/ 下载相应版本,安装到服务器上官网提供的是二进制版,解压就能用,不需要编译。
[root@ga002 ~]# cd /opt
[root@ga002 opt]# wget https://github.com/prometheus/prometheus/releases/download/v2.26.0/prometheus-2.26.0.linux-amd64.tar.gz
[root@ga002 opt]# wget https://github.com/prometheus/mysqld_exporter/releases/download/v0.12.1/mysqld_exporter-0.12.1.linux-amd64.tar.gz
[root@ga002 opt]# wget https://github.com/prometheus/node_exporter/releases/download/v1.1.2/node_exporter-1.1.2.linux-amd64.tar.gz
[root@ga002 opt]# wget https://dl.grafana.com/oss/release/grafana-7.5.5-1.x86_64.rpm
三、安装Promethus
1.安装Promethus
#1.解压Promethus安装包到/opt目录下
[root@ga002 opt]# tar xf prometheus-2.26.0.linux-amd64.tar.gz -C /opt

#2.创建Prometheus数据存储路径
[root@ga002 opt]# mkdir /data/prometheus

#3.配置数据源
[root@ga002 opt]# vim /opt/prometheus-2.17.1.linux-amd64/prometheus.yml
修改job内容,并且保存

scrape_configs:
  # The job name is added as a label `job=<job_name>` to any timeseries scraped from this config.
  - job_name: 'prometheus'

    # metrics_path defaults to '/metrics'
    # scheme defaults to 'http'.

    static_configs:
    - targets: ['ga002:9090']

#4.创建system启动
[root@ga002 opt]# vim /etc/systemd/system/prometheus.service
[Unit]
Description=Prometheus Server
Documentation=https://prometheus.io/
After=network.target
[Service]
Type=simple
User=root
Restart=on-failure
ExecStart=/opt/prometheus-2.26.0.linux-amd64/prometheus --config.file=/opt/prometheus-2.26.0.linux-amd64/prometheus.yml --storage.tsdb.path=/data/prometheus --storage.tsdb.retention=60d
Restart=on-failure
[Install]
WantedBy=multi-user.target

或者直接启动
[root@ga001 opt]# nohup /opt/prometheus-2.26.0.linux-amd64/prometheus --config.file=/opt/prometheus-2.26.0.linux-amd64/prometheus.yml --storage.tsdb.path=/data/prometheus --storage.tsdb.retention=60d &

#5.启动服务
[root@ga002 opt]# systemctl daemon-reload
[root@ga002 opt]# systemctl enable --now prometheus

#6.查看服务状态以及端口
[root@ga002 opt]# systemctl status prometheus

[root@ga002 opt]# netstat -lntp
Active Internet connections (only servers)
Proto Recv-Q Send-Q Local Address           Foreign Address         State       PID/Program name
tcp6       0      0 :::9090                 :::*                    LISTEN      3373/prometheus
2.测试连接
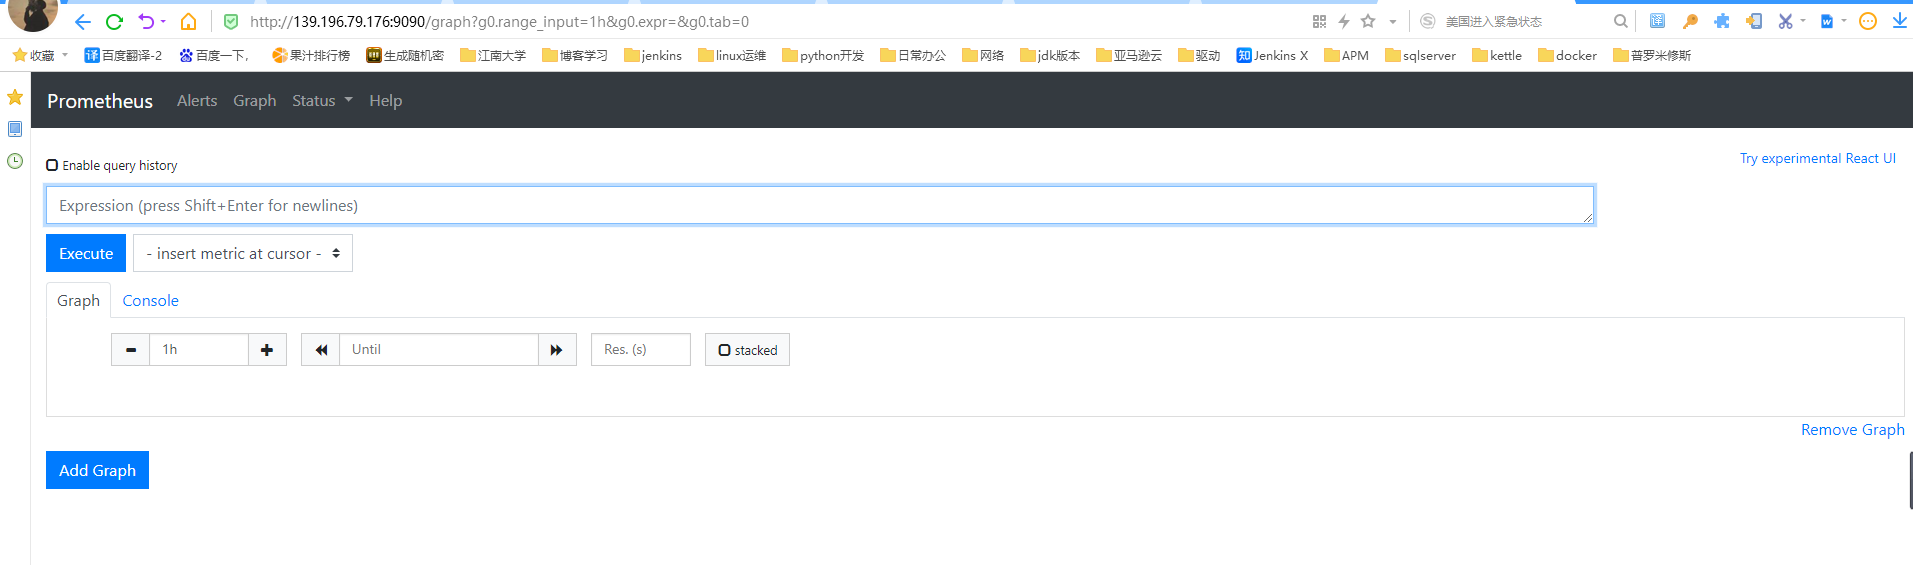
在浏览器上输入:`http://服务器IP:9090`,出现如下页面及表示启动成功。
http://139.196.79.176:9090
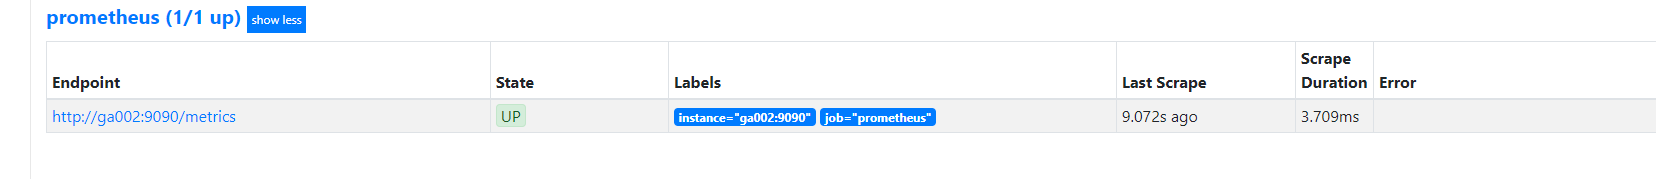
默认只监控了本机一台,点`Status -->`点`Targets -->`可以看到只监控了本机。
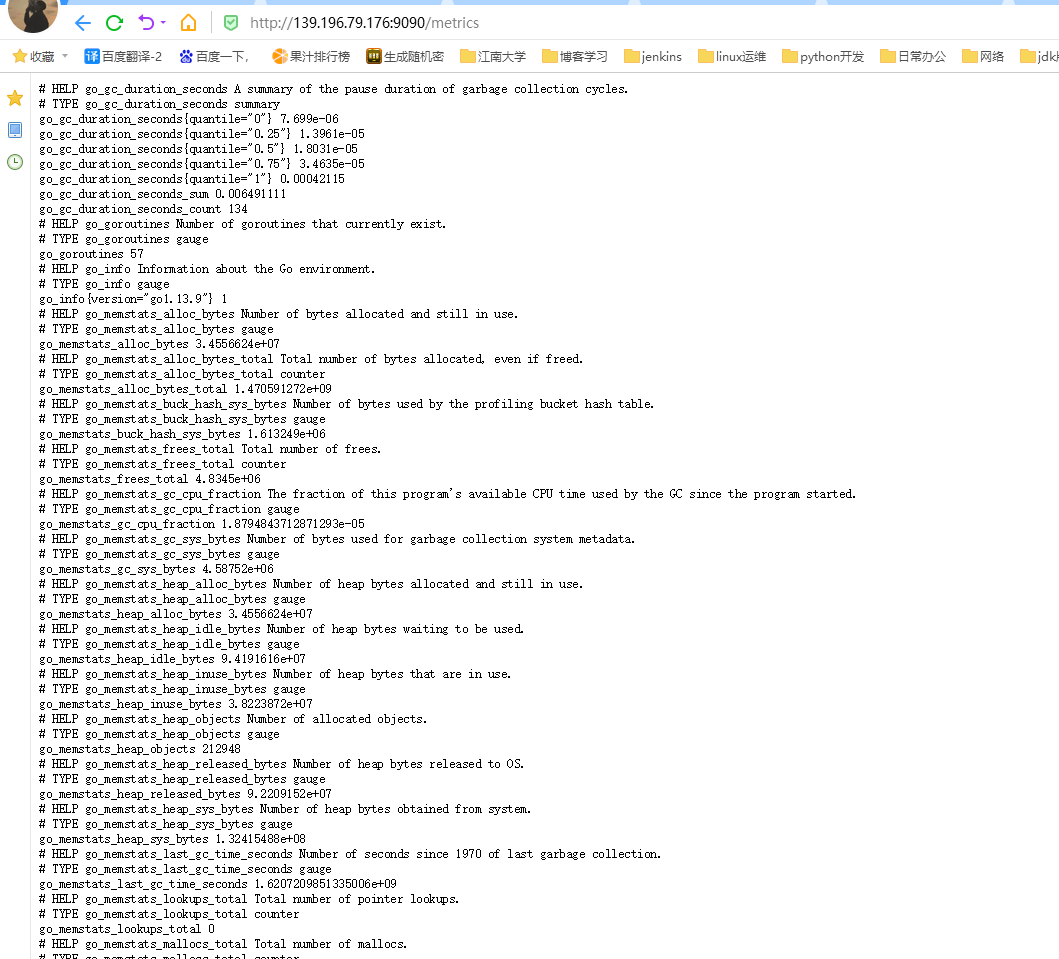
通过`http://服务器IP:9090/metrics`可以查看到监控的数据,在web主界面可以通过关键字查询监控项
http://139.196.79.176:9090/metrics
五、安装node_exporter
1.安装node_exporter
#被监控端都要执行,这里ga001为例

#1.下载node_exporter安装包
[root@ga001 ~o]# cd /opt
[root@ga001 opt]# wget https://github.com/prometheus/node_exporter/releases/download/v1.1.2/node_exporter-1.1.2.linux-amd64.tar.gz

#2.解压node_exporter安装包
[root@ga001 opt]# tar -xf node_exporter-1.1.2.linux-amd64.tar.gz

#3.创建system启动
[root@ga001 opt]# vim /etc/systemd/system/node_exporter.service
[Unit]
Description=Node Exporter
Wants=network-online.target
After=network-online.target
[Service]
User=root
ExecStart=/opt/node_exporter-1.1.2.linux-amd64/node_exporter
[Install]
WantedBy=default.target

或者直接启动
[root@ga001 opt]# nohup /opt/node_exporter-1.1.2.linux-amd64/node_exporter &

#4.启动服务
[root@ga001 opt]# systemctl daemon-reload
[root@ga001 opt]# systemctl enable --now node_exporter

#5.查看服务状态以及端口
[root@ga001 opt]# systemctl status node_exporter

[root@ga001 opt]# netstat -lntp
Active Internet connections (only servers)
Proto Recv-Q Send-Q Local Address           Foreign Address         State       PID/Program name
tcp6       0      0 :::9100                 :::*                    LISTEN      28829/node_exporter
2.测试连接
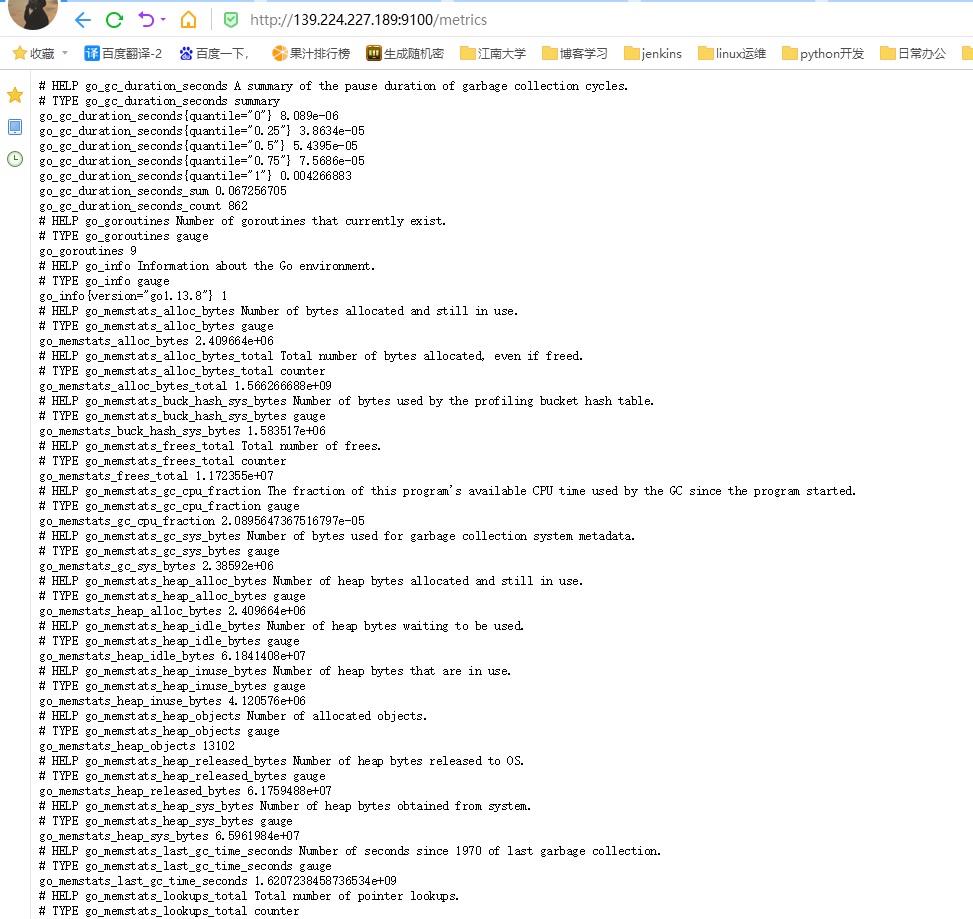
通过浏览器访问`http://被监控端IP:9100/metrics`就可以查看到node_exporter在被监控端收集的监控信息。
http://139.224.227.189:9100/metrics
六、配置Prometheus数据源
#1.配置Prometheus数据源
[root@ga002 opt]# vim /opt/prometheus-2.17.1.linux-amd64/prometheus.yml
添加如下job内容,并且保存
  - job_name: 'node_exporter' # 添加内容
    metrics_path: /metrics
    static_configs:
      - targets: ['ga002:9100','gd001:9100','ga001:9100','gw001:9100','ga003:9100'] # 多个监控数据源则 后⾯继续添加,数组形式'a','b'
改完配置文件后,重启服务

#2.重启服务
[root@ga002 opt]# systemctl restart prometheus

#3.验证服务
[root@ga002 opt]# netstat -lntp
Active Internet connections (only servers)
Proto Recv-Q Send-Q Local Address           Foreign Address         State       PID/Program name
tcp6       0      0 :::9100                 :::*                    LISTEN      21944/node_exporter
tcp6       0      0 :::9090                 :::*                    LISTEN      3373/prometheus

回到web管理界面 --> 点`Status --> 点Targets` --> 可以看到多了四台监控目标
七、安装mysqld_exporter
#在被管理机gd001上安装mysqld_exporter组件
#1.下载mysqld_exporter安装包
[root@gd001 ~o]# cd /opt
[root@gd001 opt]# wget https://github.com/prometheus/mysqld_exporter/releases/download/v0.12.1/mysqld_exporter-0.12.1.linux-amd64.tar.gz
#2.解压mysqld_exporter安装包
[root@gd001 opt]# tar -xf mysqld_exporter-0.12.1.linux-amd64.tar.gz
#3.数据库授权
[root@gd001 opt]# mysql
mysql > GRANT REPLICATION CLIENT, PROCESS ON *.* TO 'mysqlexporter'@'localhost' identified by 'mysqlexporter@dataxgroup';
mysql > GRANT SELECT ON performance_schema.* TO 'mysqlexporter'@'localhost';
mysql > flush privileges;
Query OK, 0 rows affected (0.01 sec)
mysql > quit;
Bye
# (注意:授权ip为localhost,因为不是prometheus服务器来直接找mysql获取数据,而是prometheus服务器找mysql_exporter,mysql_exporter 再找mysql。所以这个localhost是指的mysql_exporter的IP)
#4.创建一个mysql配置文件,写上连接的用户名与密码(和上面的授权的用户名 和密码要对应)
[root@gd001 opt]# vim /opt/mysqld_exporter-0.12.1.linux-amd64/.my.cnf
[client]
user=mysqlexporter
password=mysqlexporter@dataxgroup
#5.创建system启动mysqld_exporter
[root@gd001 opt]# vim /etc/systemd/system/mysql_exporter.service
#添加如下内容
[Unit]
Description=Mysql Exporter
Wants=network-online.target
After=network-online.target
[Service]
User=root
ExecStart=/opt/mysqld_exporter-0.12.1.linux-amd64/mysqld_exporter --config.my-cnf=/opt/mysqld_exporter-0.12.1.linux-amd64/.my.cnf
[Install]
WantedBy=default.target
或者直接命令行启动:
[root@gd001 opt]# nohup /opt/mysqld_exporter-0.12.1.linux-amd64/mysqld_exporter --config.my-cnf=/opt/mysqld_exporter-0.12.1.linux-amd64/.my.cnf &
#6.重载并启动服务
[root@gd001 opt]# systemctl daemon-reload
[root@gd001 opt]# systemctl enable --now mysql_exporter
[root@gd001 opt]# systemctl status mysql_exporter
#7.查看服务状态,确认端口(9104)
[root@gd001 ~]# netstat -lntp
Active Internet connections (only servers)
Proto Recv-Q Send-Q Local Address Foreign Address State PID/Program name
tcp 0 0 0.0.0.0:22 0.0.0.0:* LISTEN 2260/sshd
tcp6 0 0 :::3306 :::* LISTEN 2133/mysqld
tcp6 0 0 :::9100 :::* LISTEN 28829/node_exporter
tcp6 0 0 :::9104 :::* LISTEN 1894/mysqld_exporte
#8.回到prometheus服务器的配置文件里添加被监控的mysql的配置段
[root@ga002 opt]# vim /opt/prometheus-2.17.1.linux-amd64/prometheus.yml
# 最后加上以下内容
- job_name: 'mysql_exporter'
metrics_path: /metrics
static_configs:
- targets: ['gd001:9104']
labels:
instance: gatorade
#9.重启prometheus
[root@gd001 opt]# systemctl restart prometheus
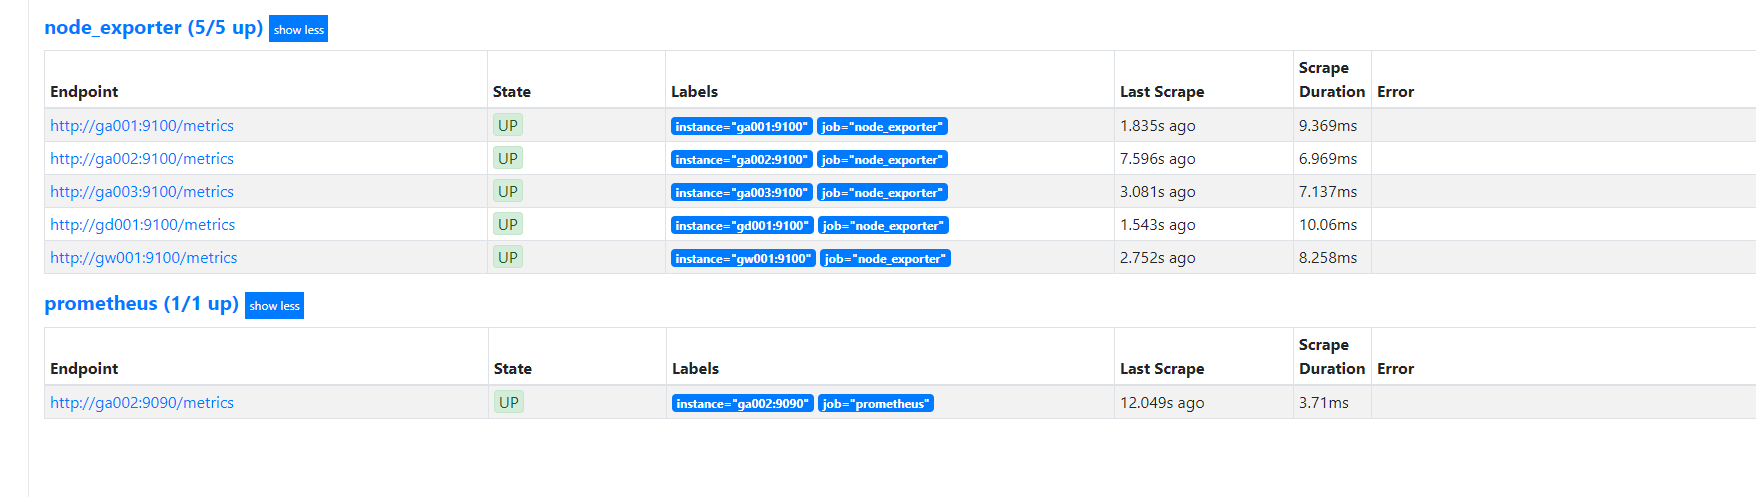
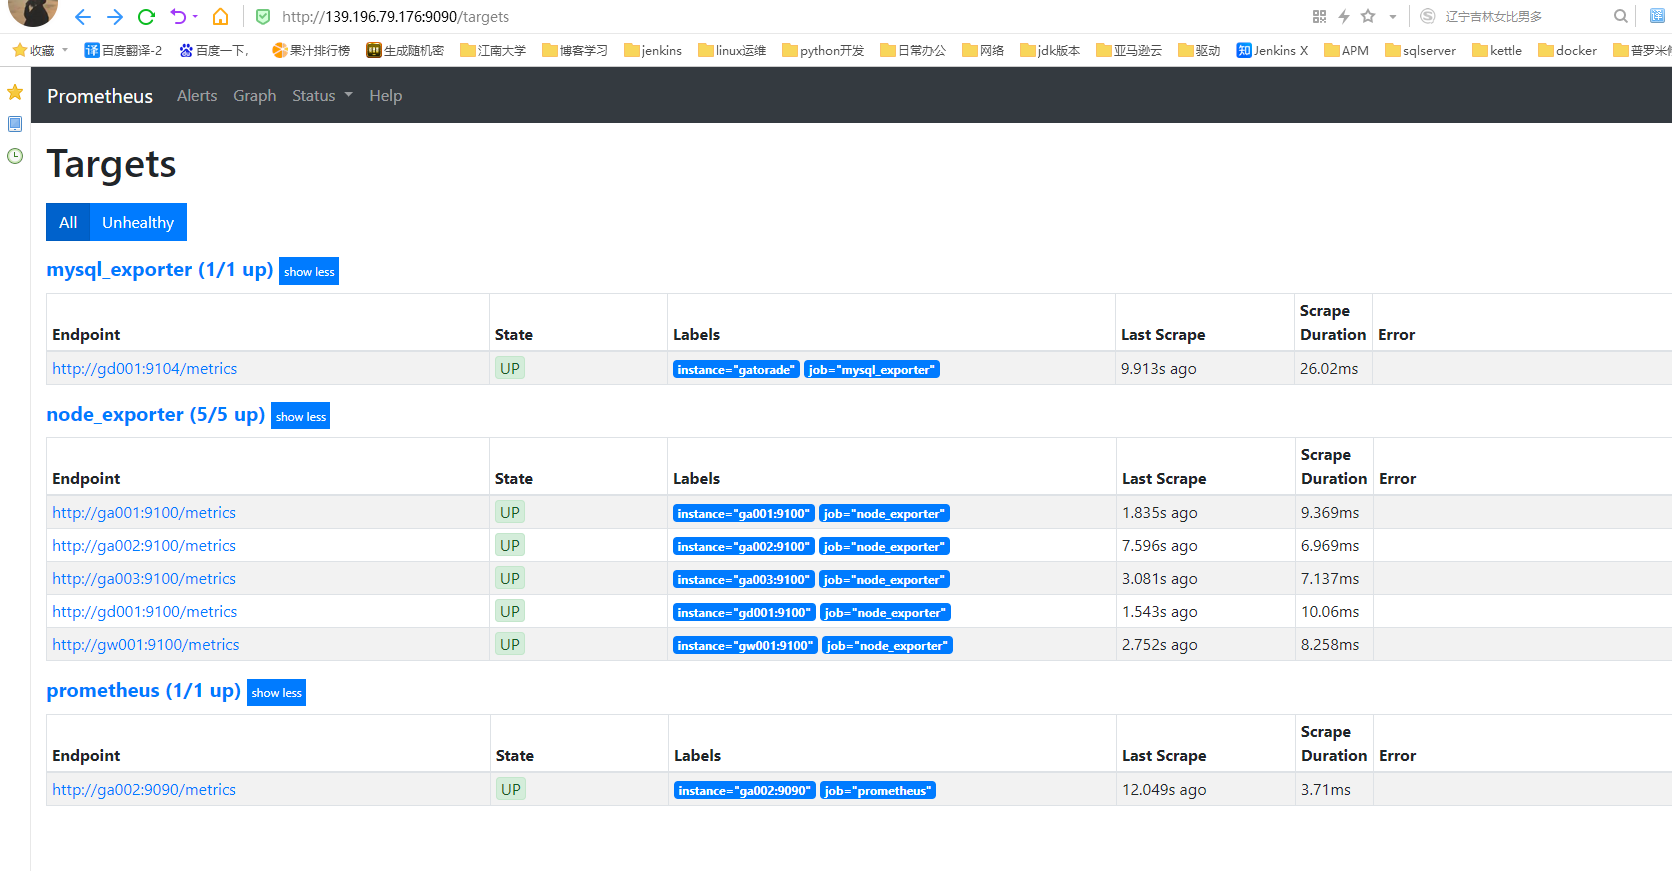
#10.web界面验证服务
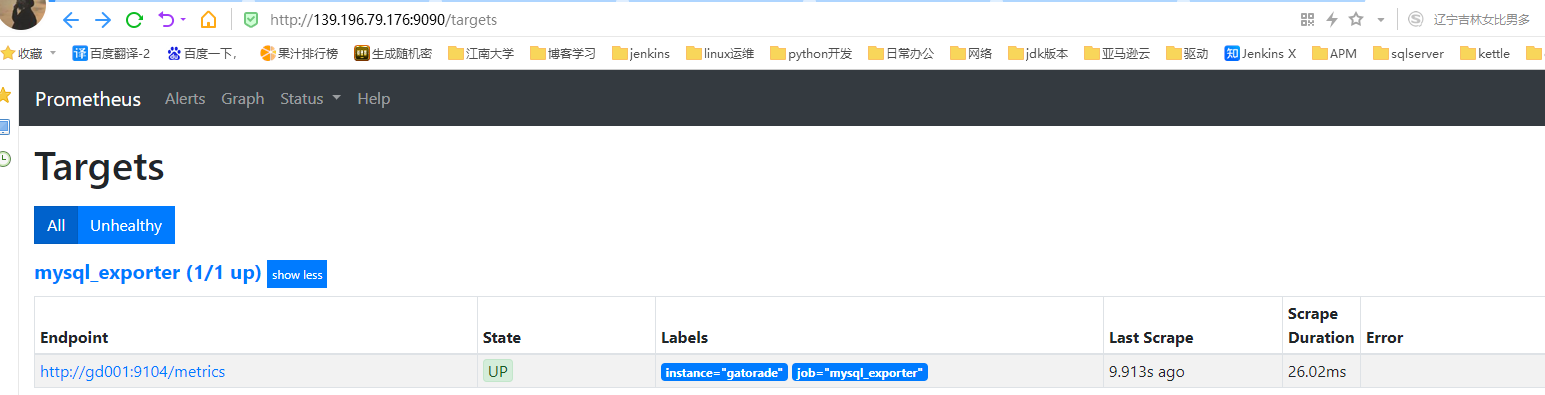
八、最终Prometheus监控效果
九、安装Grafana
1.什么是Grafana
grafana 是一款采用 Go 语言编写的开源应用,主要用于大规模指标数据的可视化展现, 是网络架构和应用分析中最流行的时序数据展示工具,目前已经支持绝大部分常用的时序数据库。下载地址:https://grafana.com/grafana/download
2.使用Grafana连接Prometheus
#1.下载grafana
[root@ga002 ~]# cd /opt
[root@ga002 opt]# wget https://dl.grafana.com/oss/release/grafana-7.5.5-1.x86_64.rpm

#2.安装grafana
[root@ga002 opt]# yum install grafana-7.5.5-1.x86_64.rpm

#3.启动服务
[root@ga002 opt]# systemctl enable --now grafana-server
3.web界面访问验证
通过浏览器访问 `http:// grafana服务器IP:3000`就到了登录界面,使用默认的admin用户,admin密码就可以登陆了。
http://139.196.79.176:3000

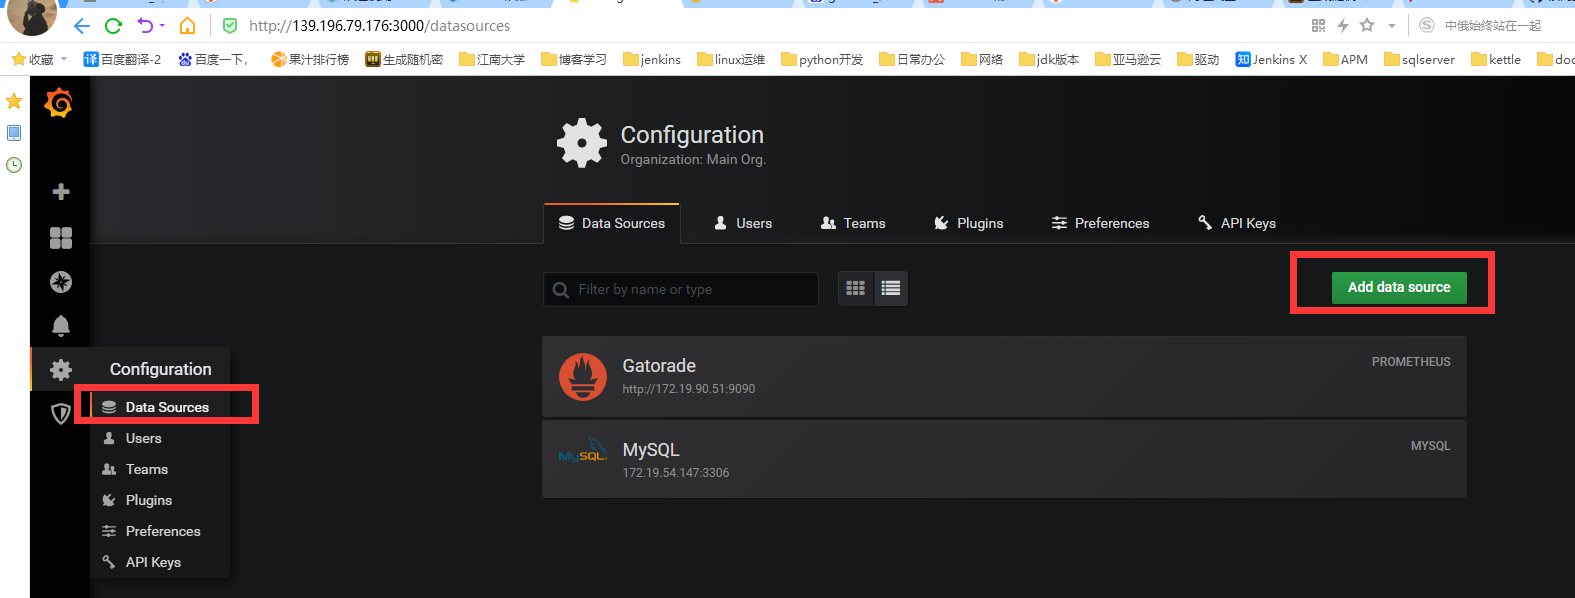
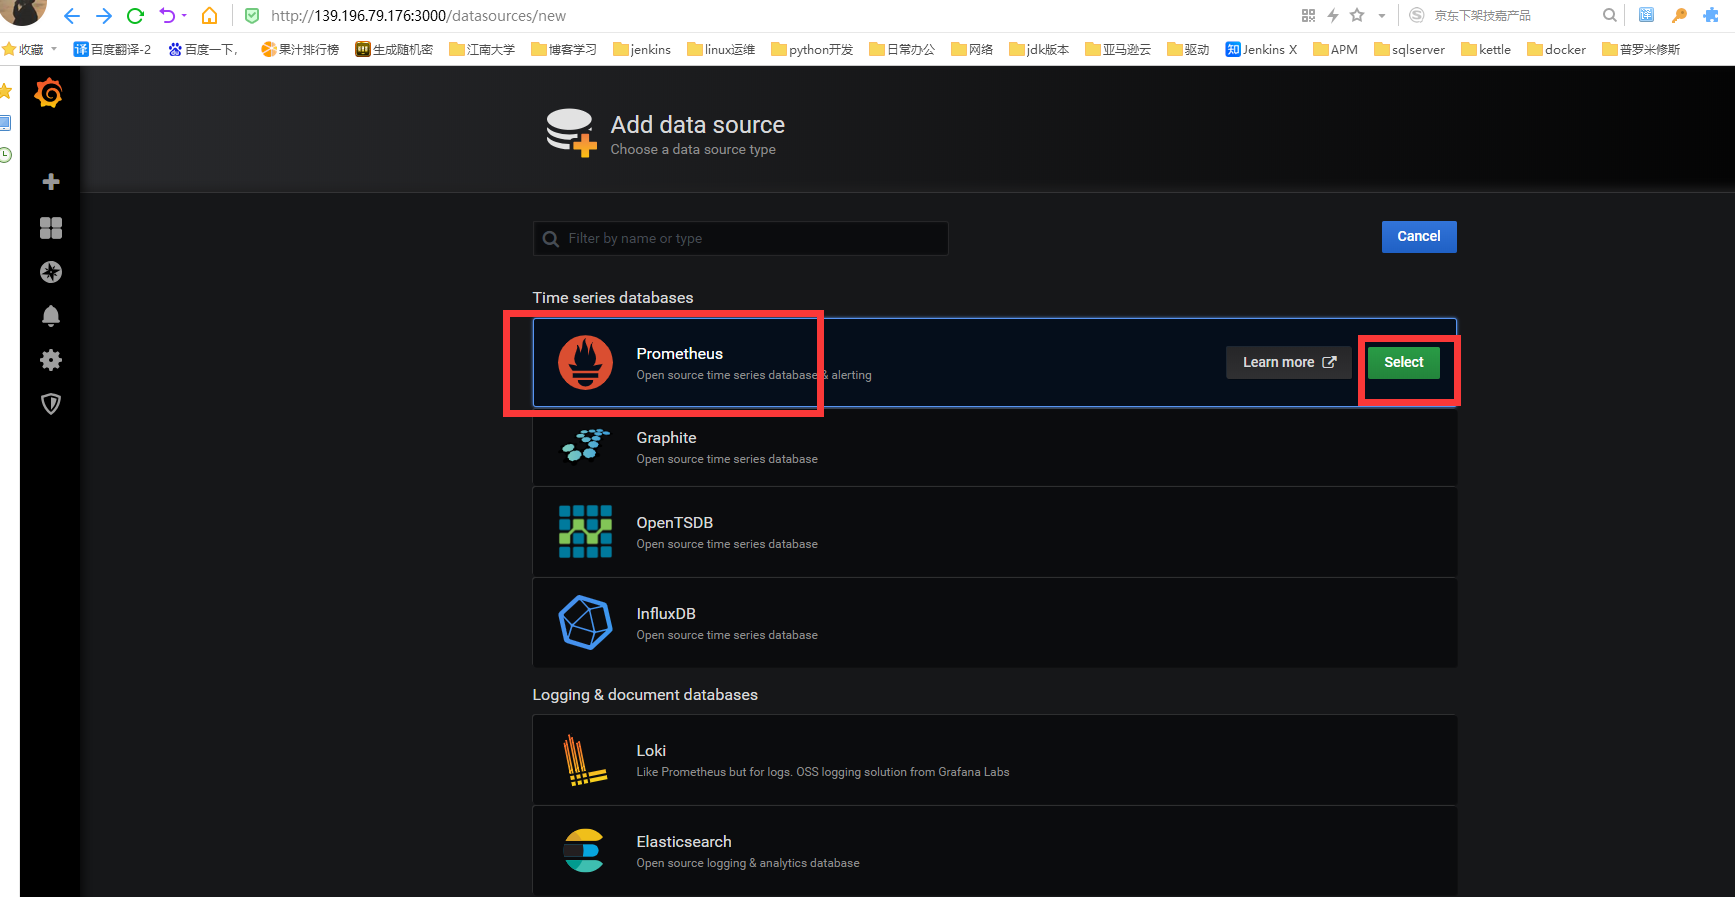
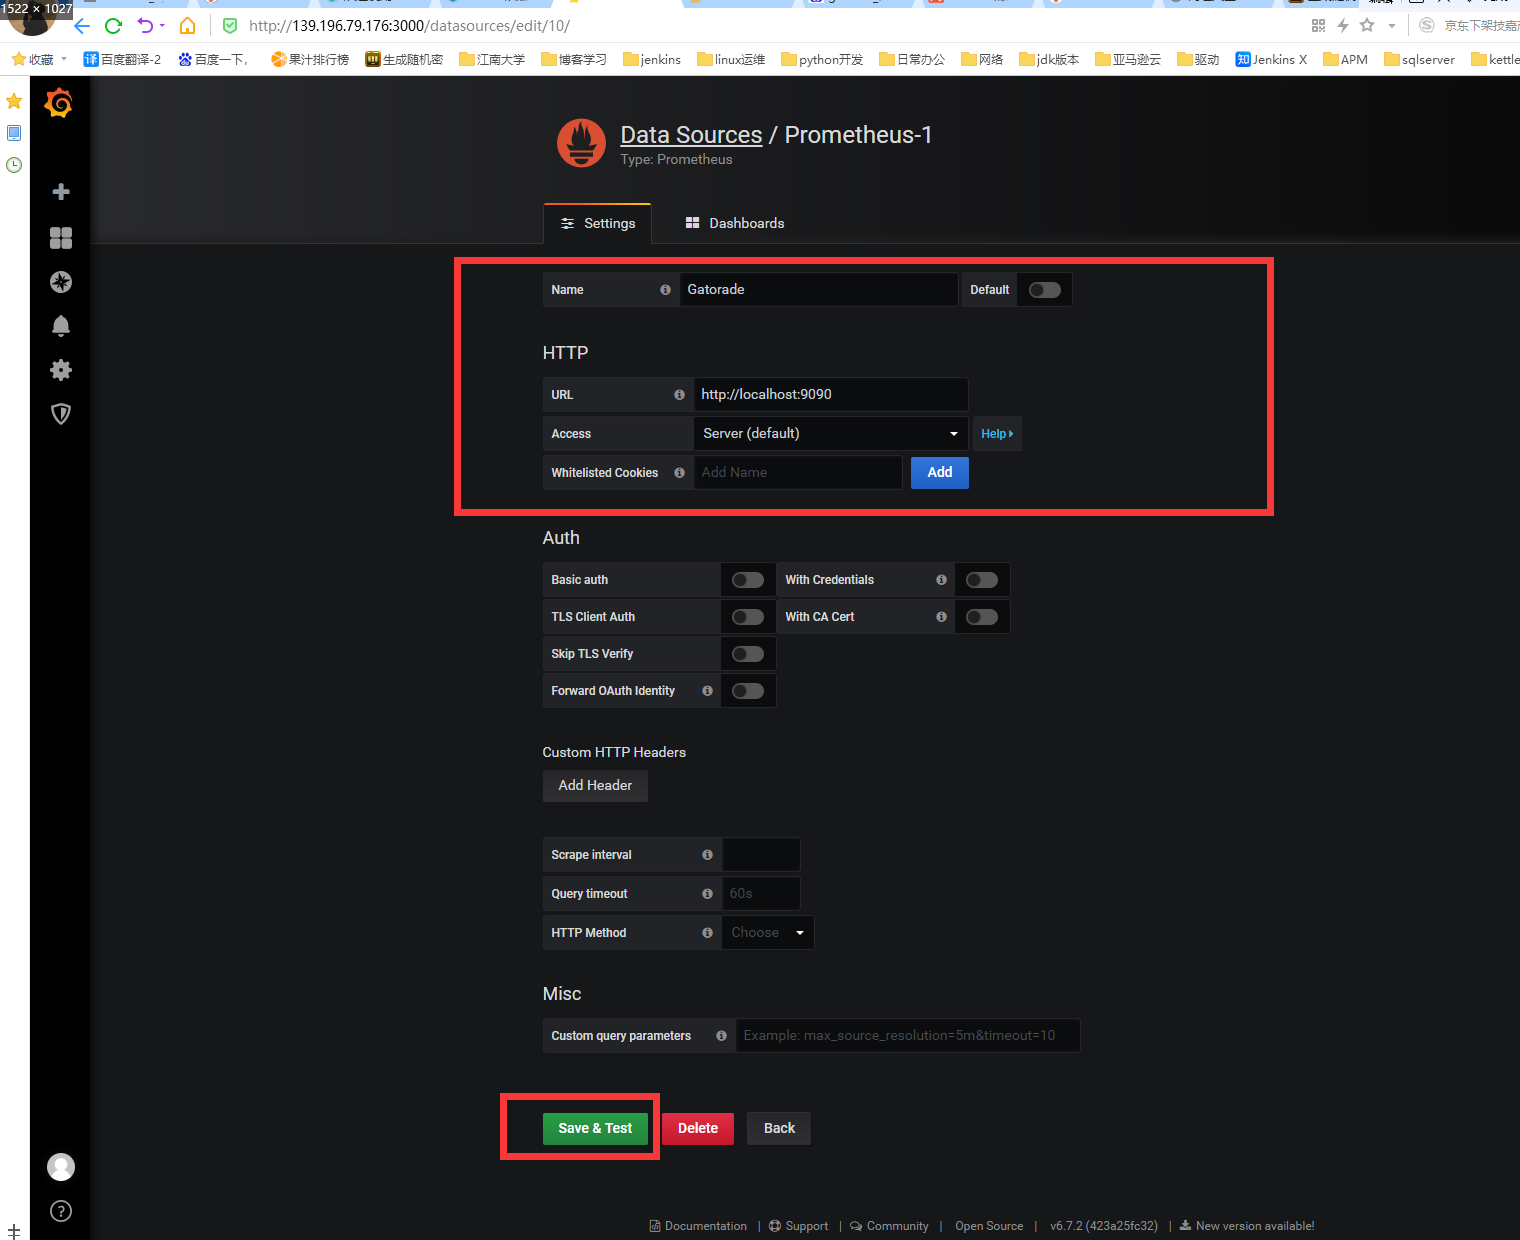
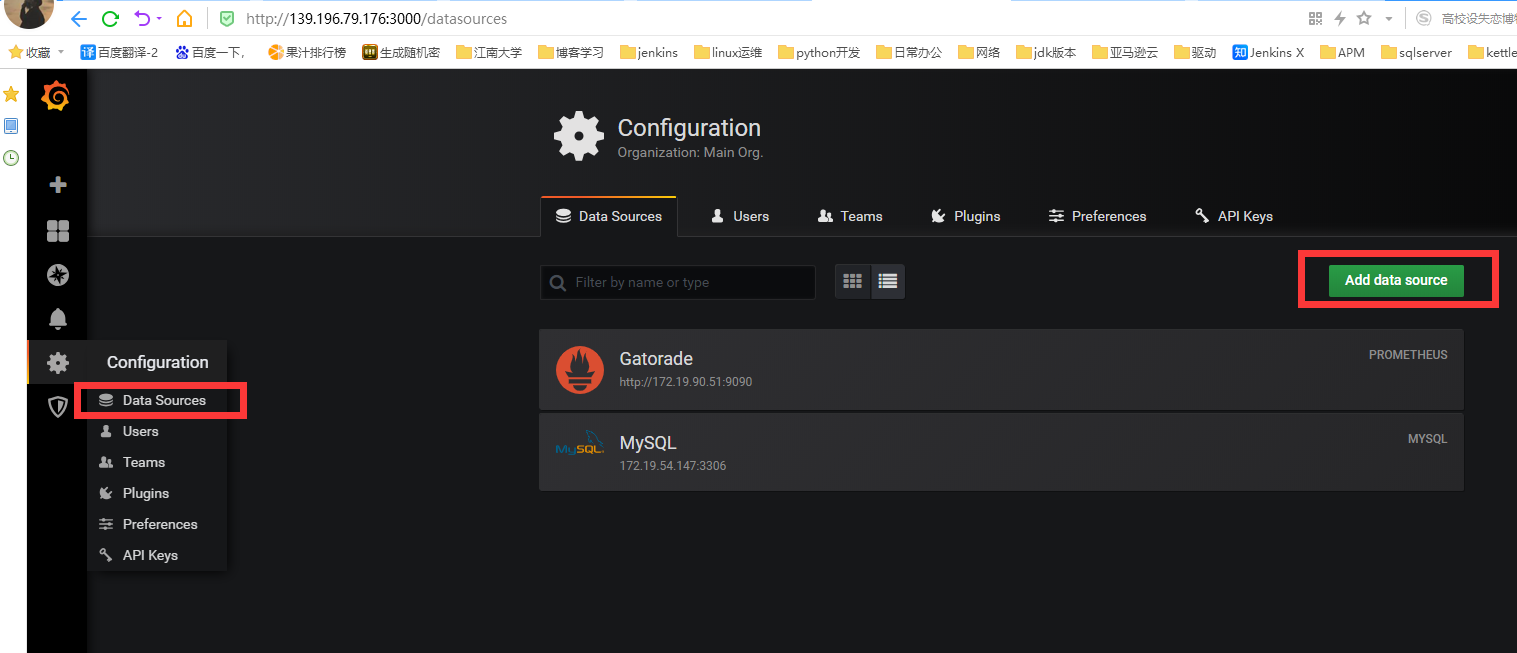
4.添加Prometheus数据源
下面我们把prometheus服务器收集的数据做为一个数据源添加到grafana,让grafana可以得到prometheus的数据。
5.监控node_exporter节点
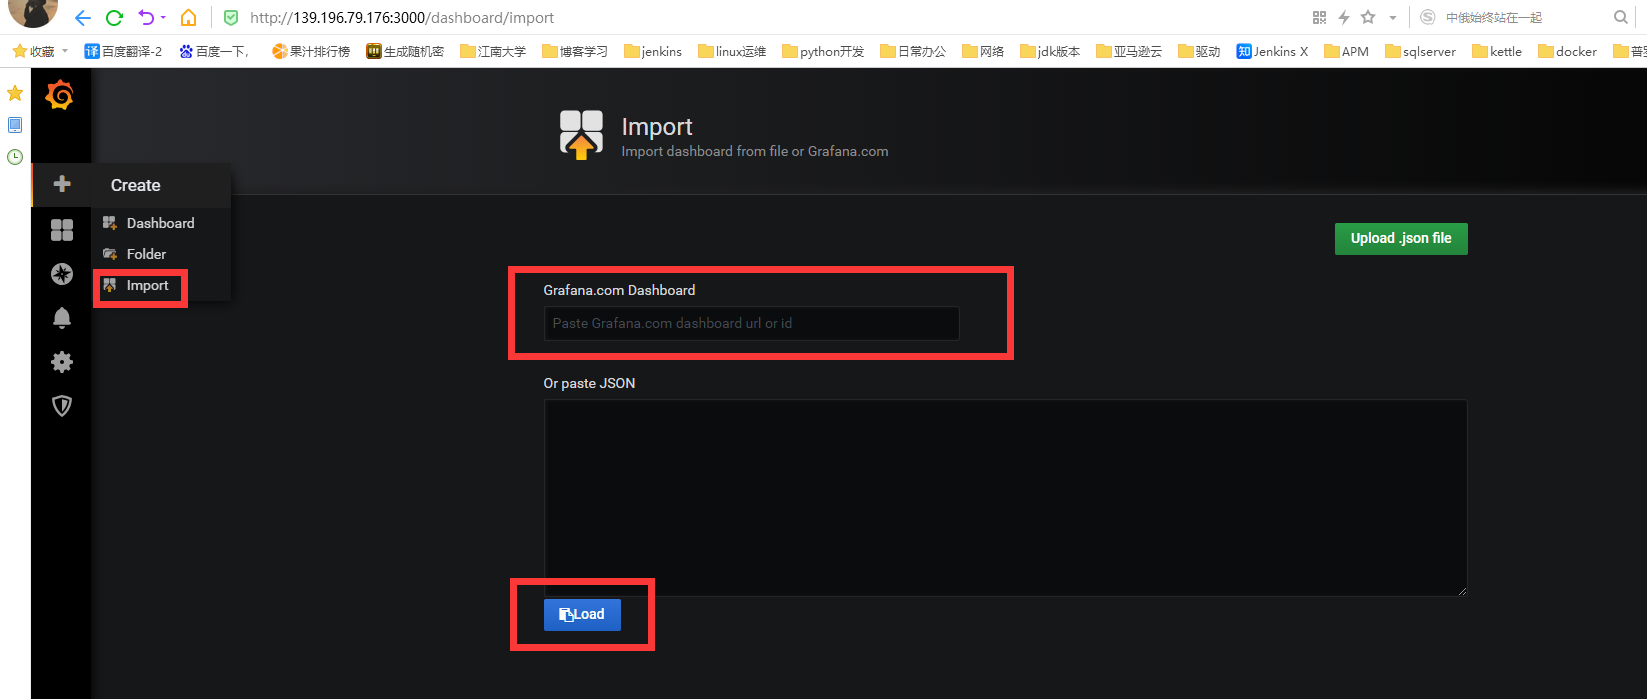
1.配置数据源后导入监控node_exporter节点的模板,
填写模板ID 11074 对应link https://grafana.com/grafana/dashboards/11074
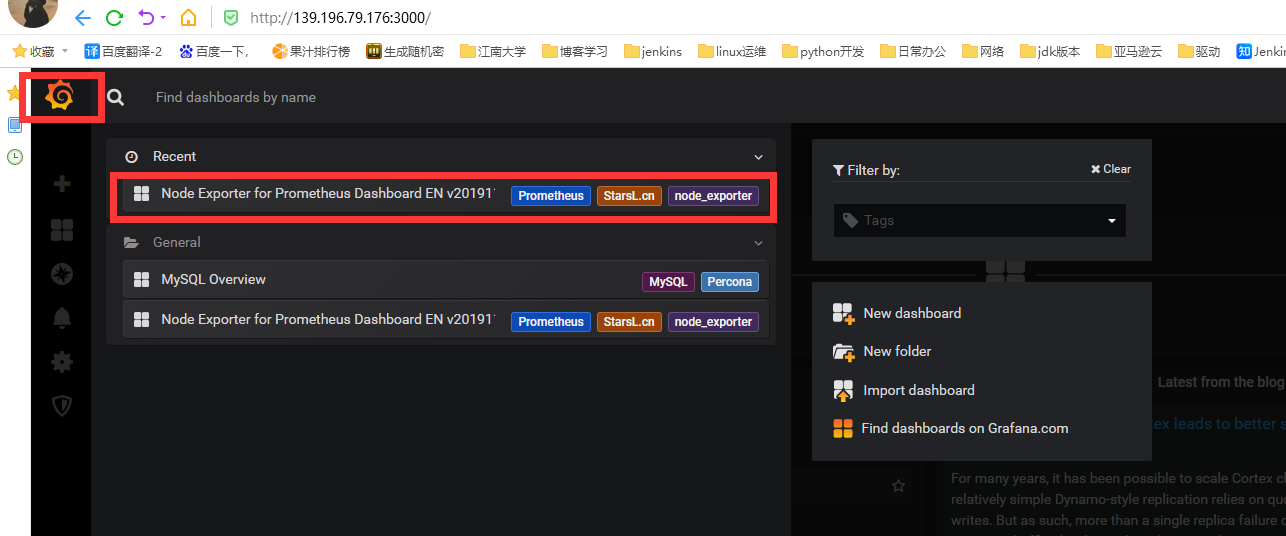
2.点击grafana图标,点击home,选择Node Exporter for Prometheus Dashboard EN v20191102
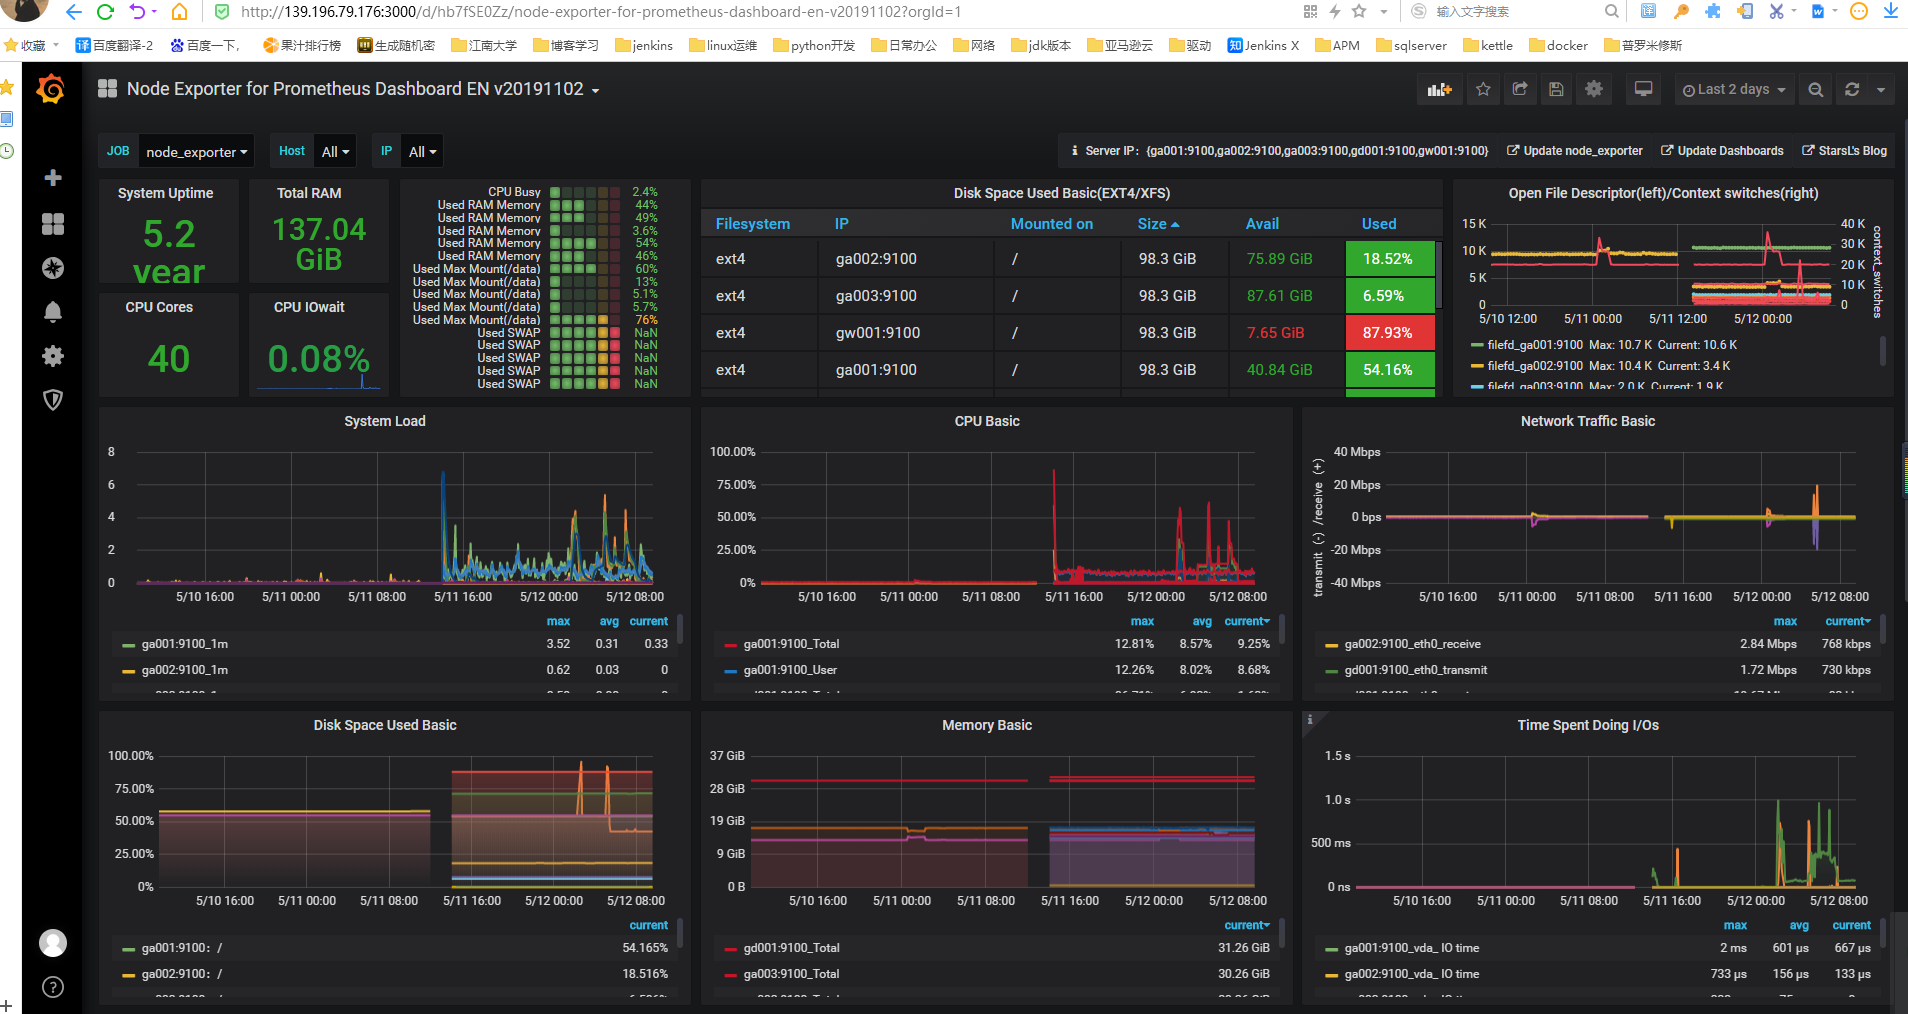
3.最终显示界面如下:
6.监控MYSQL节点(mysqld_exporter)
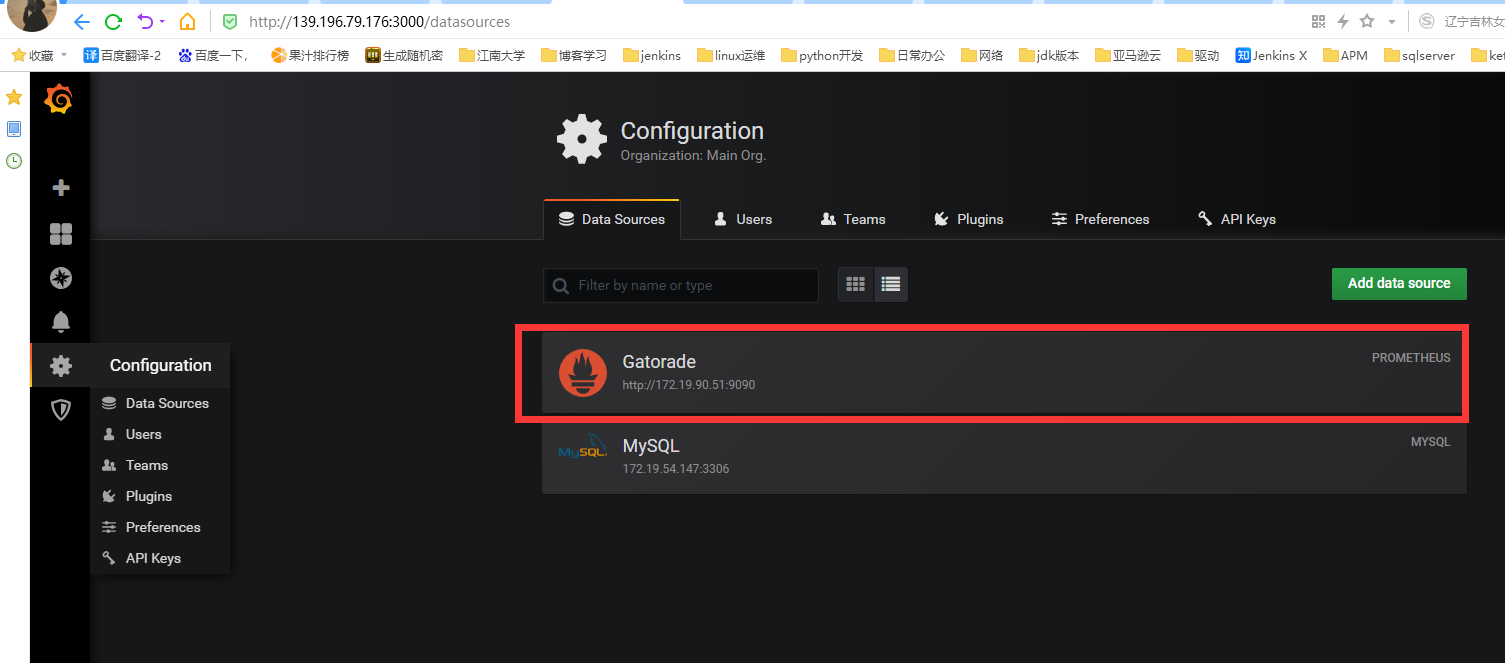
1)配置数据源
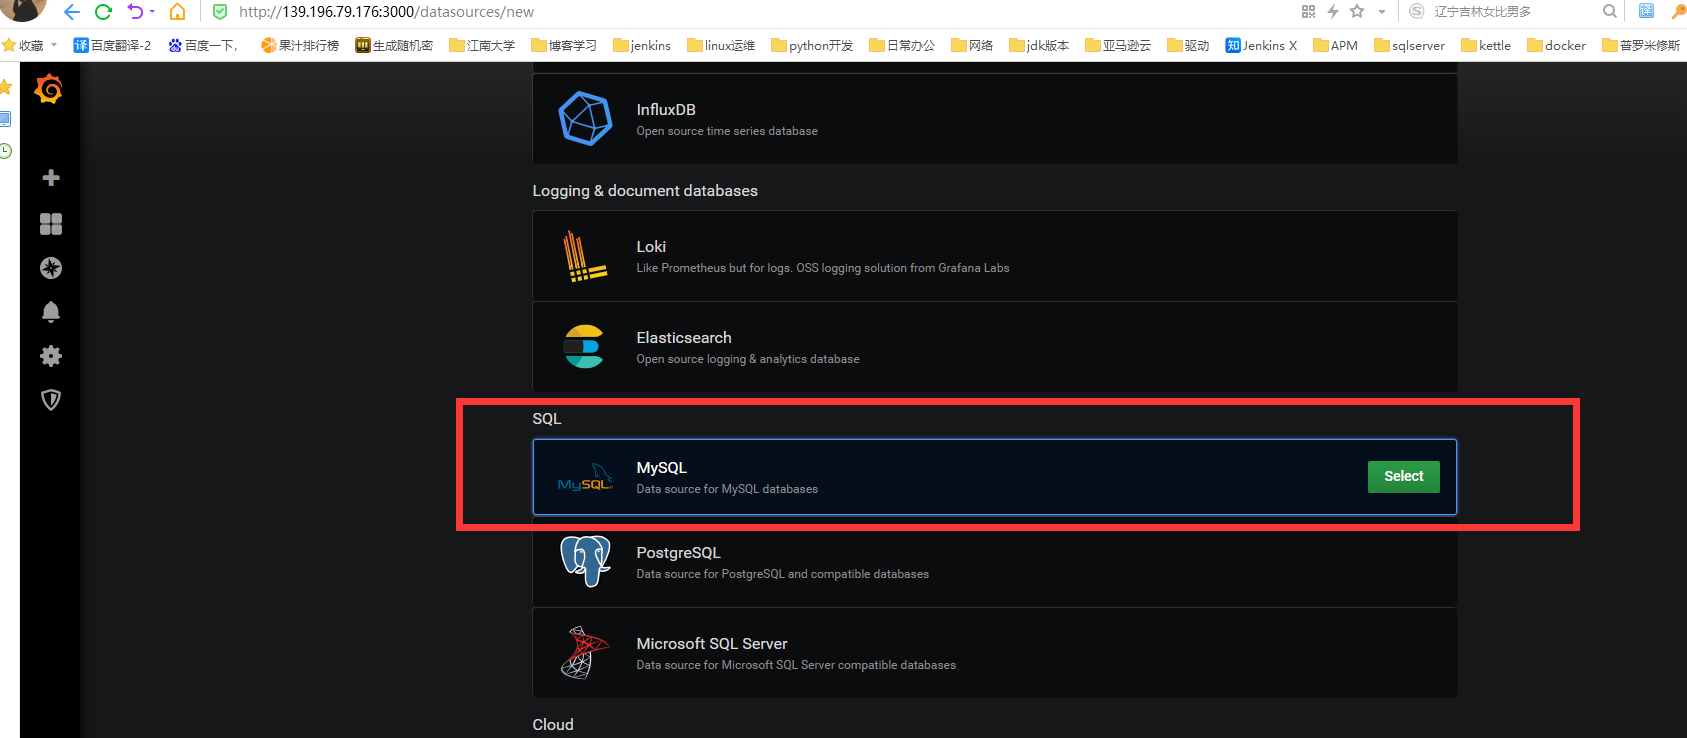
2)选择mysql数据库
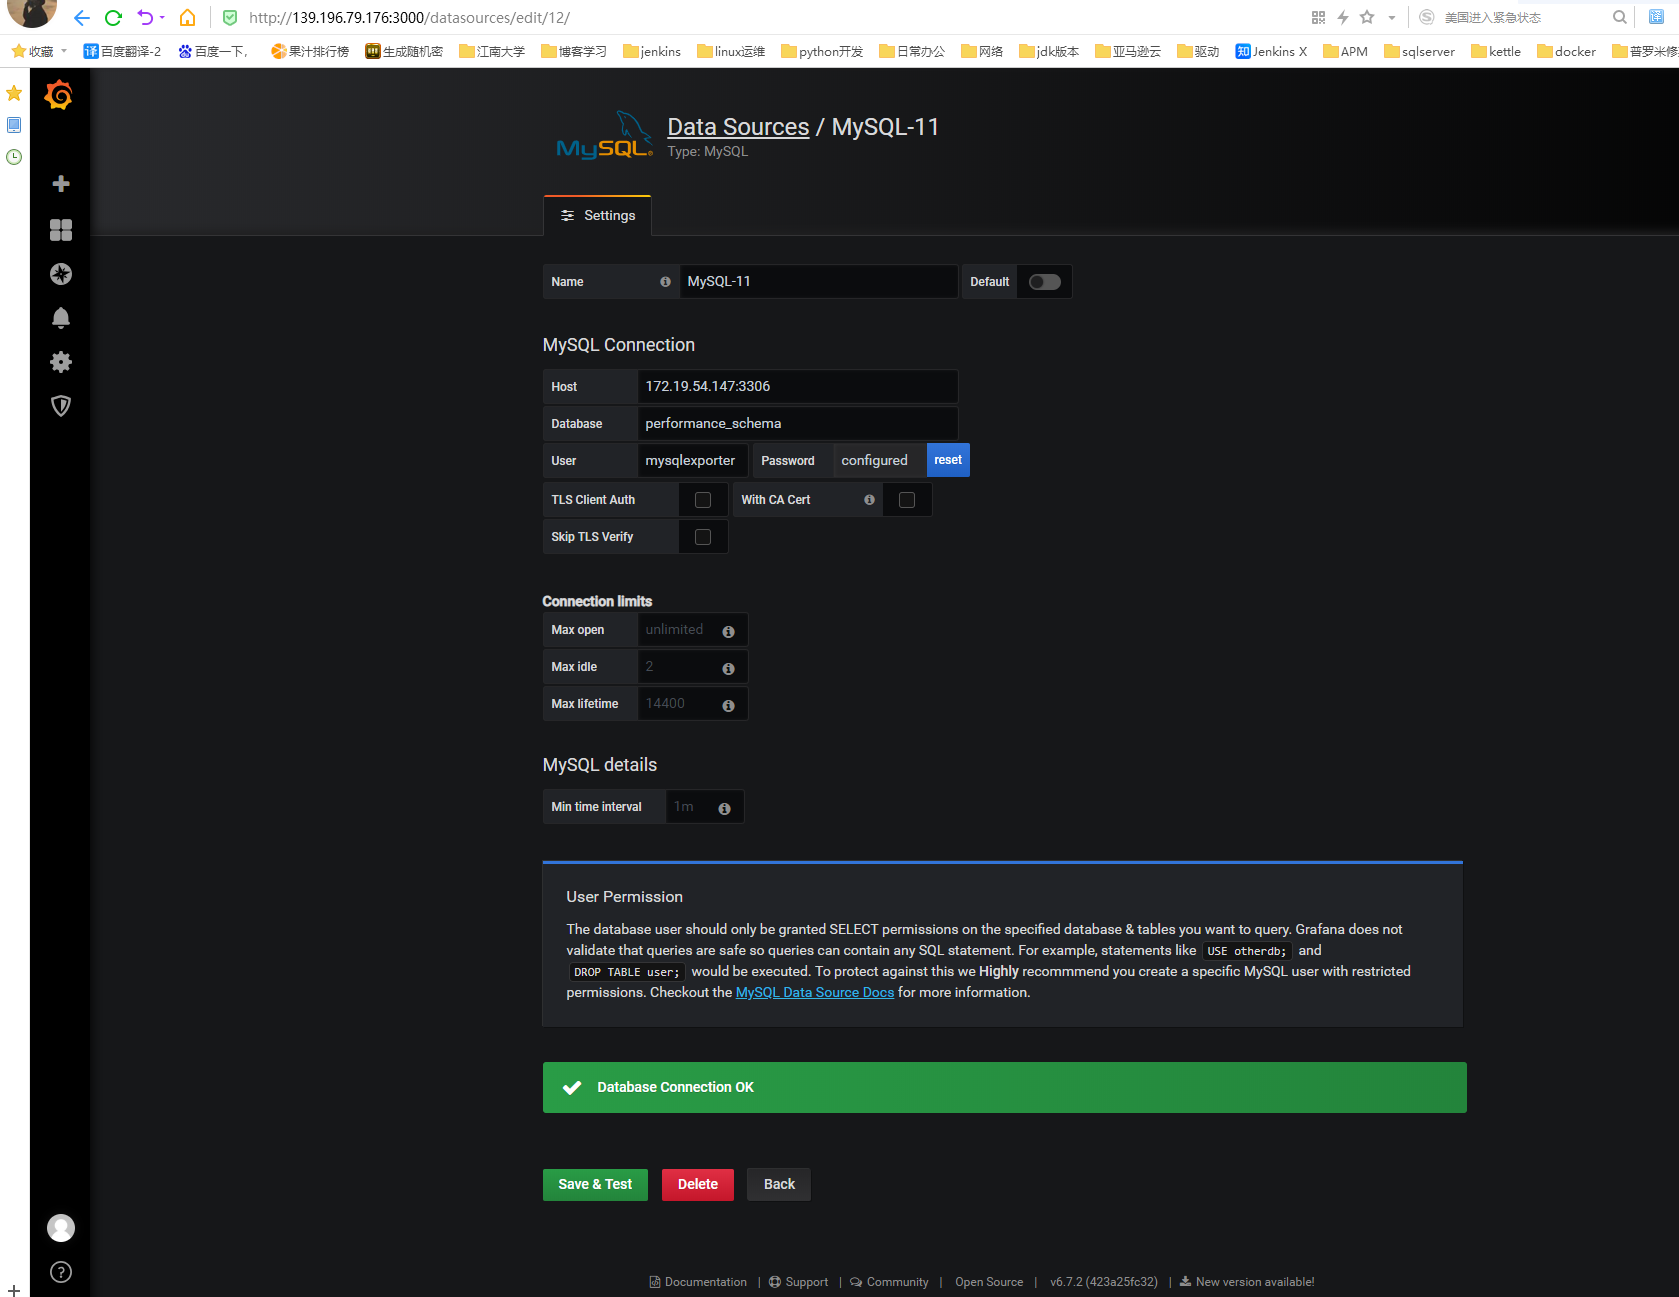
3)添加如下配置,并保存
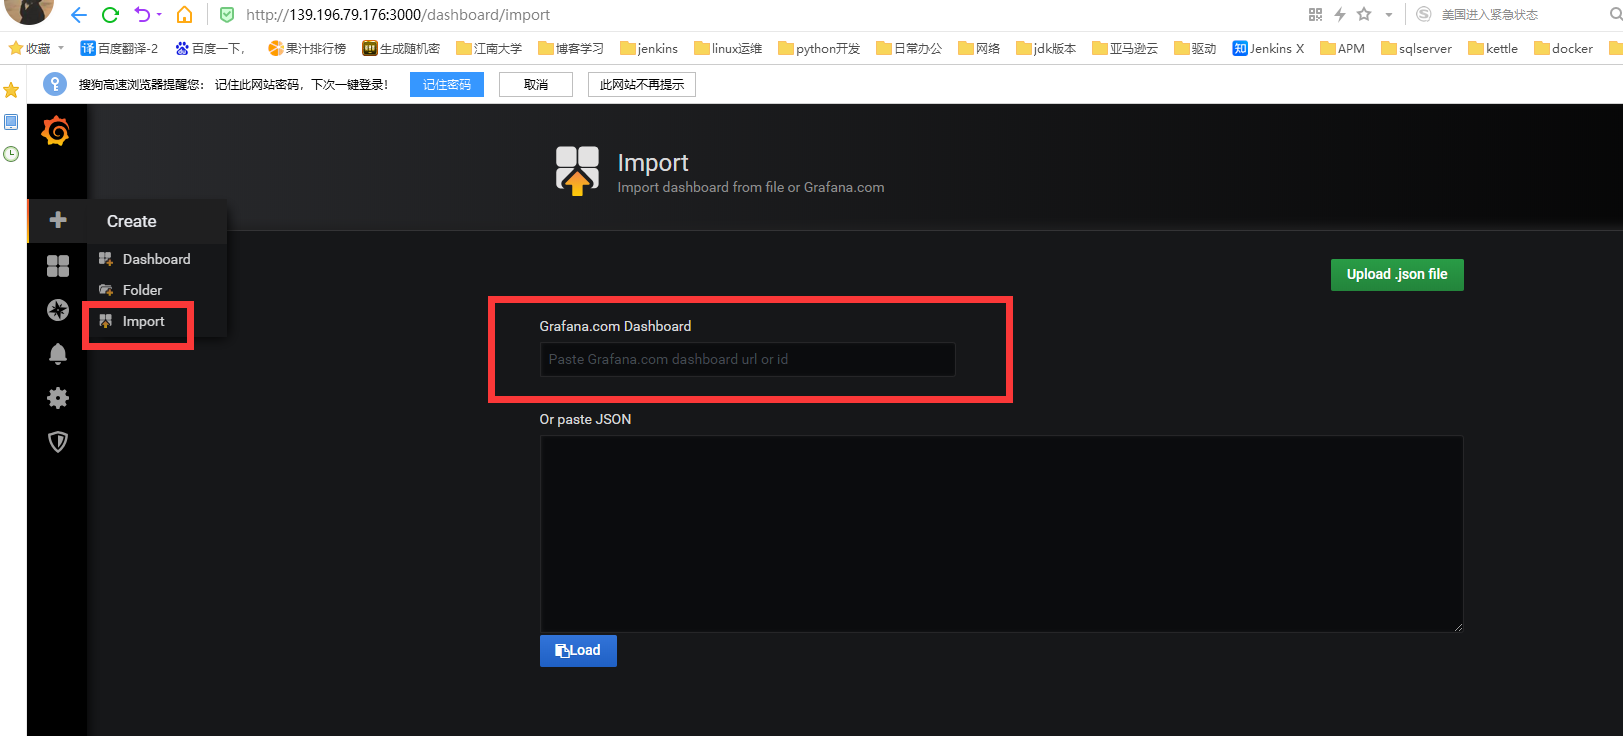
4)导⼊MySQL监控模板 7362
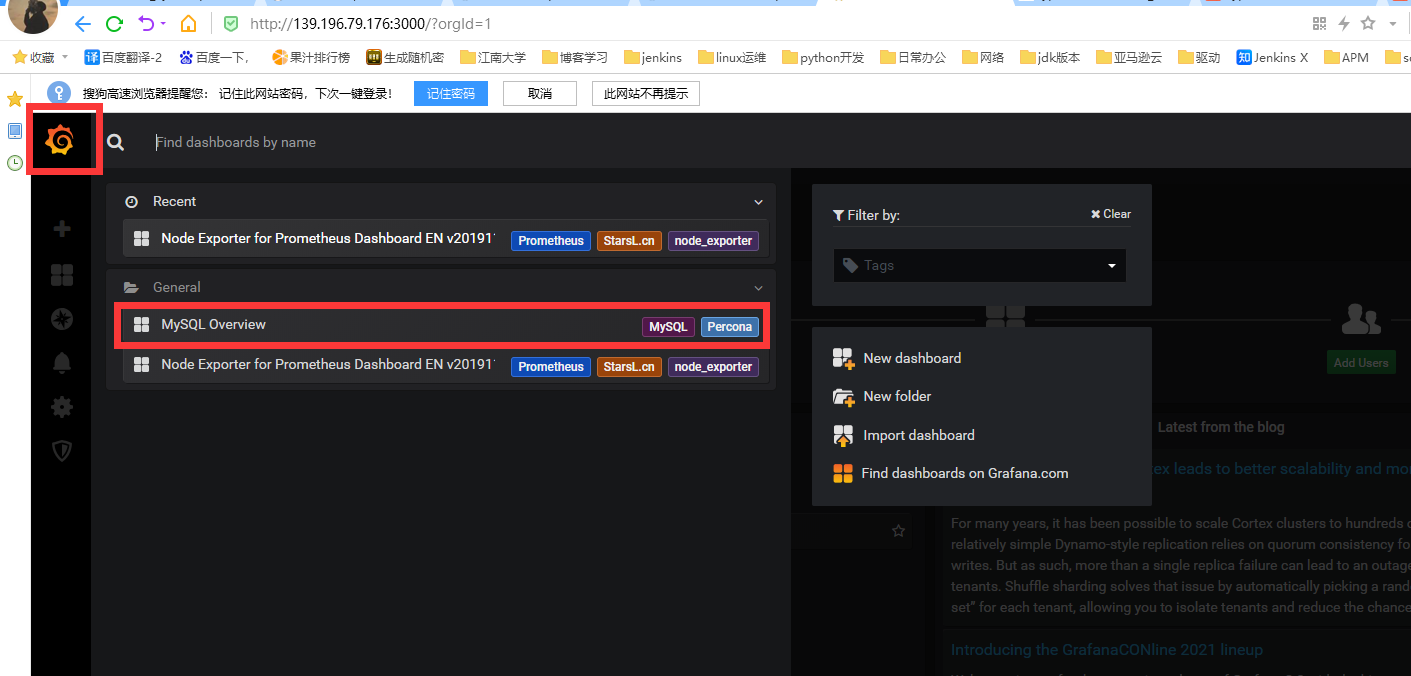
5)查看mysql界面
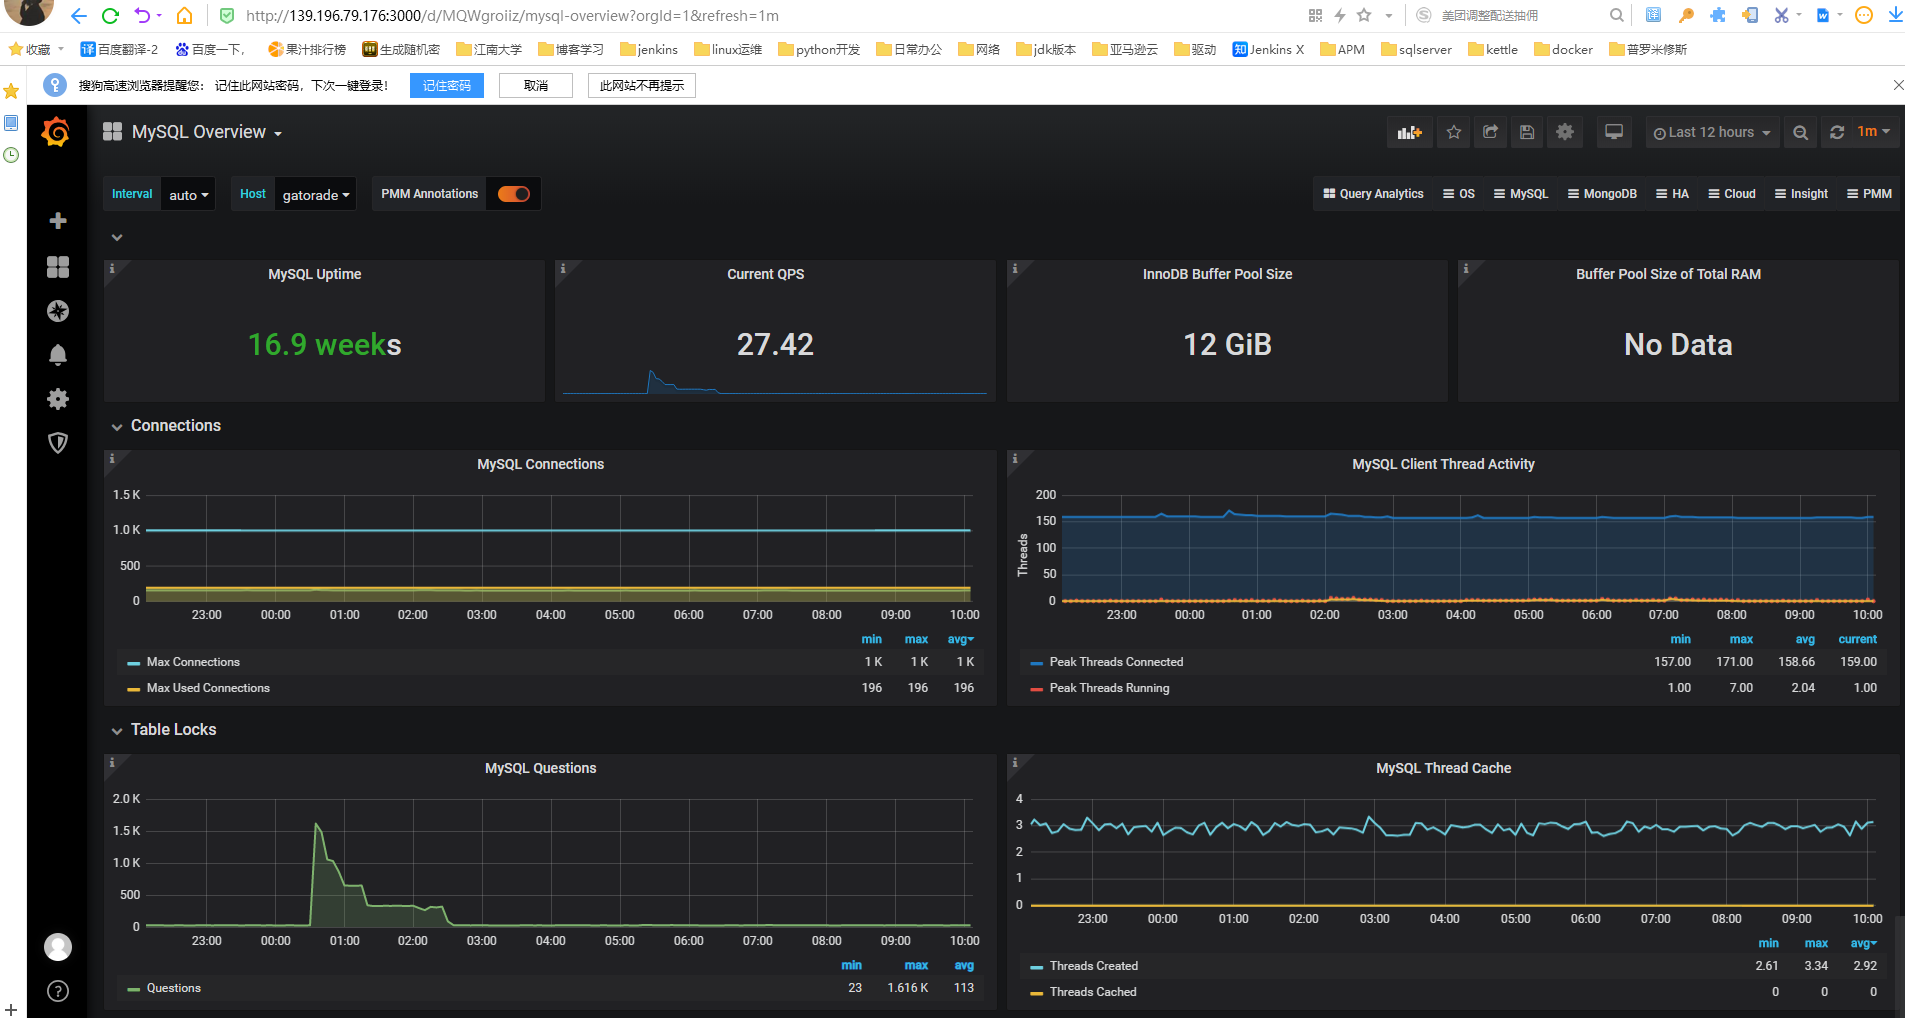
7.另一种方式监控mysql节点
在grafana上修改配置文件,并下载安装mysql监控的dashboard(包含相关json文件,这些json文件可以看作是开发人员开发的一个监控模板)

[root@ga002 opt]# vim /etc/grafana/grafana.ini
[dashboards.json]
enabled=true
path=/var/lib/grafana/dashboards


[root@ga002 ~]# cd /var/lib/grafana/
[root@ga002 grafana]# git clone https://github.com/percona/grafana-dashboards.git
[root@ga002 grafana]# cp -r grafana-dashboards/dashboards/ /var/lib/grafana/ 重启grafana服务
[root@ga002 grafana]# systemctl restart grafana-server

 浙公网安备 33010602011771号