
Promethues 和 Grafana 监控 Linux 进程
安装 Pushgateway
Prometheus 采用定时 Pull 模式,可能由于子网络或者防火墙的原因,不能直接拉取各个 Target 的指标数据,此时可以采用各个 Target 往 PushGateway 上 Push 数据,然后 Prometheus 去 PushGateway 上定时 pull。 其次在监控各个业务数据时,需要将各个不同的业务数据进行统一汇总,此时也可以采用 PushGateway 来统一收集,然后 Prometheus 来统一拉取。
- 获取程序包
~]# wget https://github.com/prometheus/pushgateway/releases/download/v1.1.0/pushgateway-1.1.0.linux-amd64.tar.gz
- 安装程序
src]# tar -xf pushgateway-1.1.0.linux-amd64.tar.gz -C /usr/local/
src]# cd /usr/local/
local]# ln -sv pushgateway-1.1.0.linux-amd64/ pushgateway
- 启动程序
这里使用 screen 将应用放到后台运行, pushgateway 默认监听 9091 端口
local]# cd /usr/local/pushgateway
pushgateway]# screen
pushgateway]# ./pushgateway  # 使用 ctrip+a,d退出
- 重连会话
pushgateway]# screen  -ls
There is a screen on:
        120592.pts-0.master     (Detached)
1 Socket in /var/run/screen/S-root.
pushgateway]# screen  -r 120592
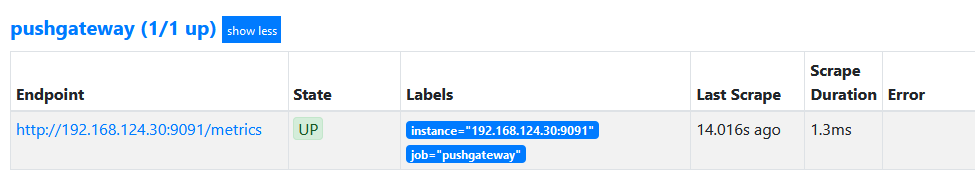
修改prometheus.yml
~]# vim /usr/local/prometheus/prometheus.yml
  - job_name: 'pushgateway'
    static_configs:
    - targets: ['192.168.124.30:9091']
~]# curl -X POST http://localhost:9090/-/reload
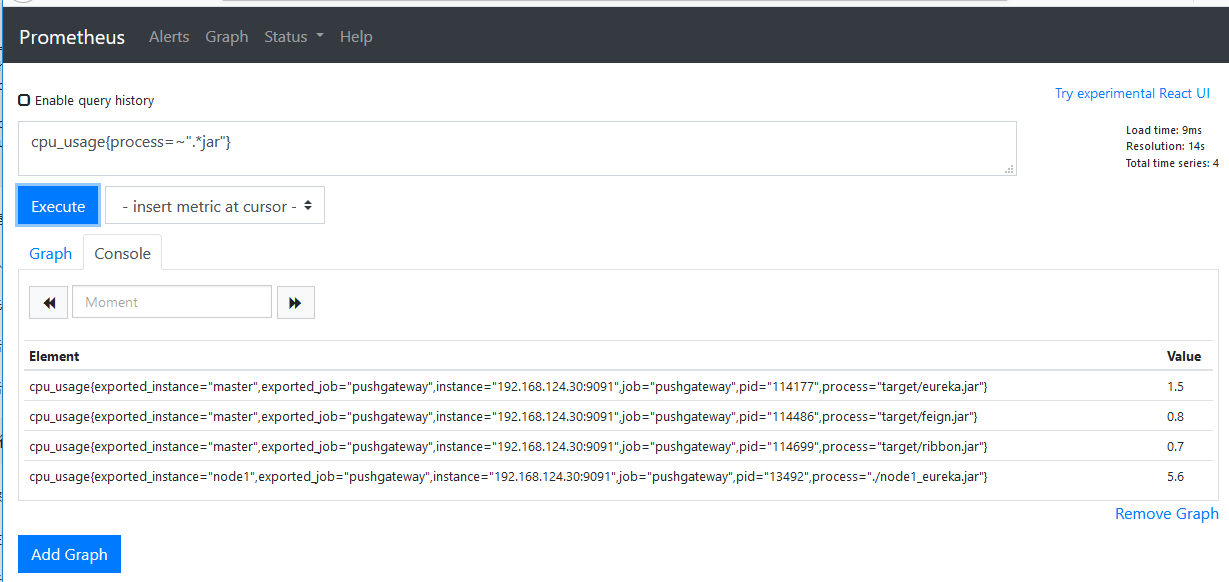
编写 bash 脚本构建指标数据
pushgateway]# cat top.sh
#!/bin/bash
#

z=$(ps aux)
while read -r z
do
   var=$var$(awk '{print "cpu_usage{process=\""$NF"\", pid=\""$2"\"}", $3z}');
done <<< "$z"
curl -X POST -H  "Content-Type: text/plain" --data "$var
" http://localhost:9091/metrics/job/top/instance/machine
如果想获取内存使用情况,我们需要把 cpu_usage 修改为 memory_usage, $3 修改成 $4 即可
pushgateway]# screen
pushgateway]# while sleep 1; do ./better-top; done
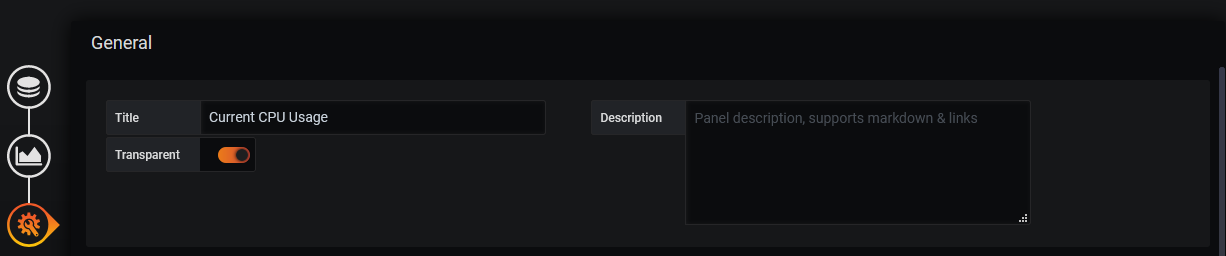
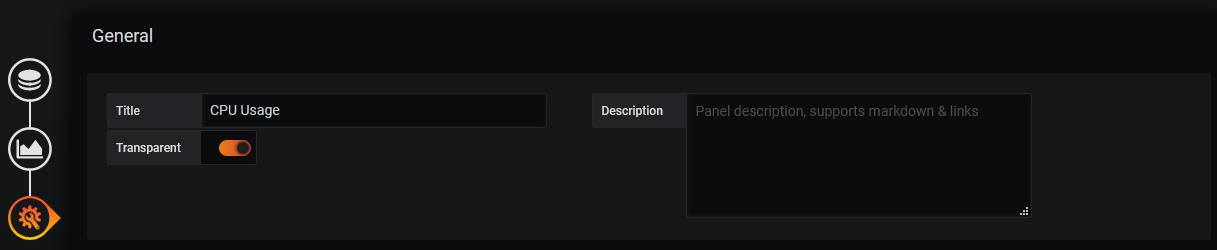
配置 Grafana 展示面板
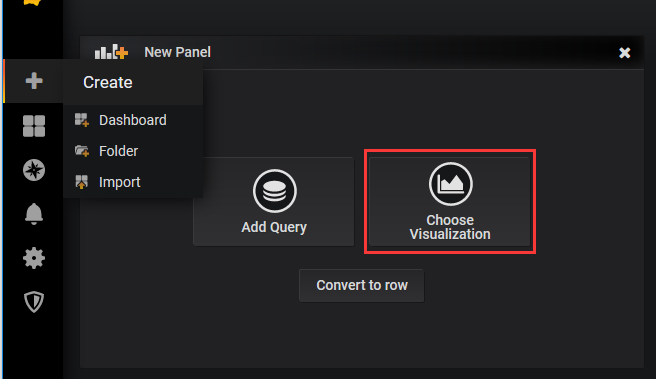
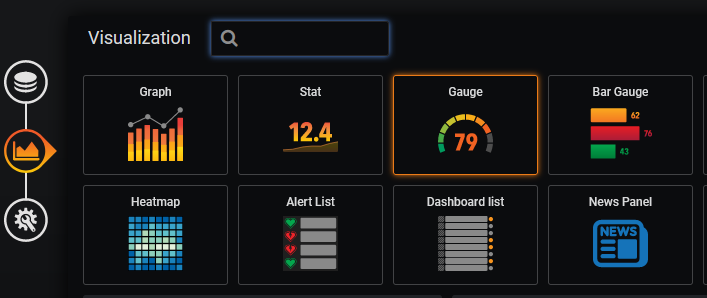
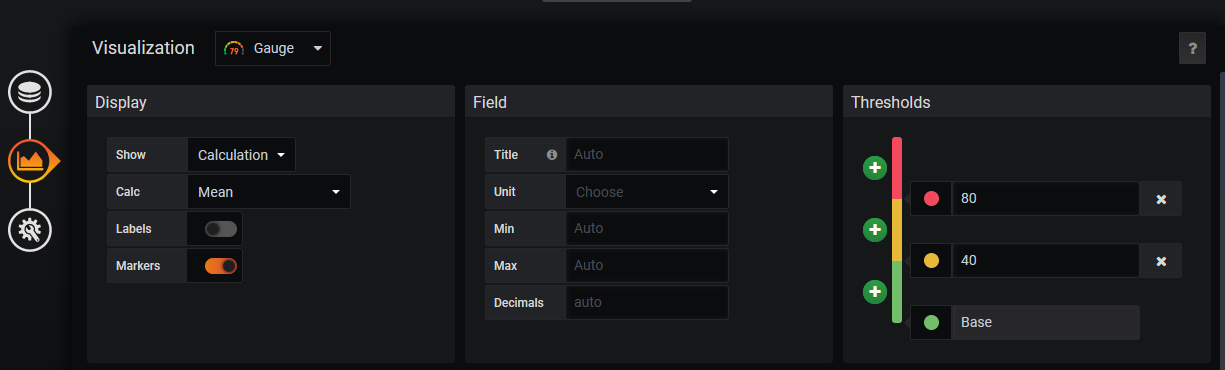
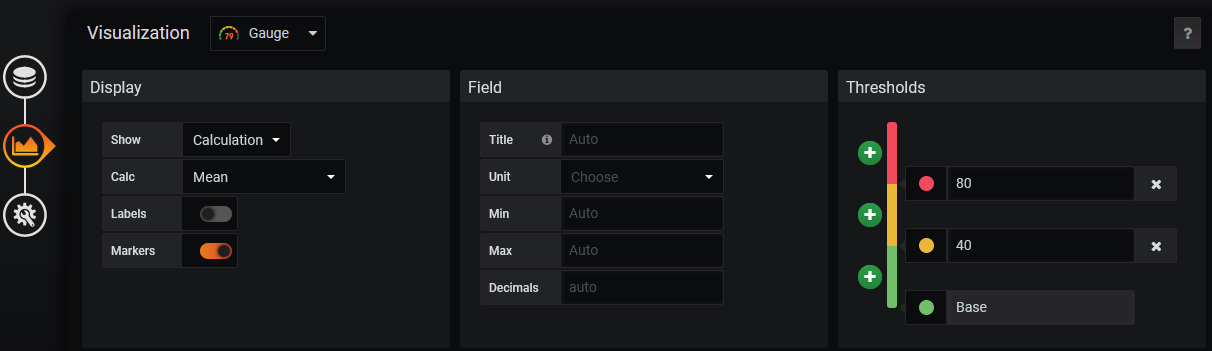
- 添加 Gauges 数据
- 点击
+,选择Choose Visualization
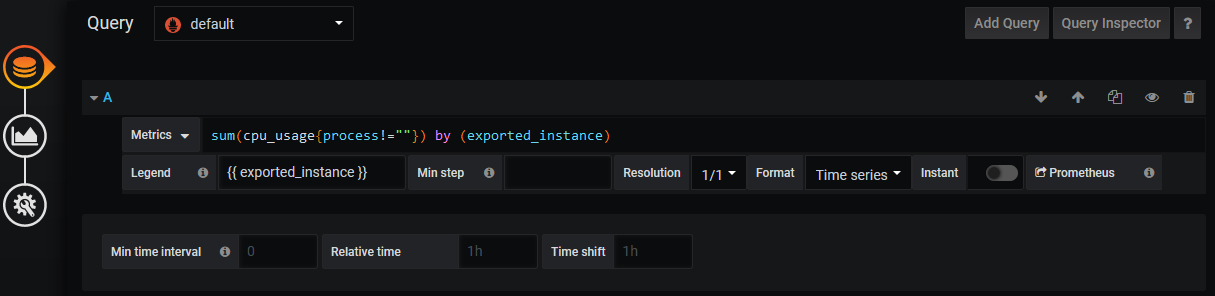
- 当前总体 CPU 使用率(PromQL query):
sum(cpu_usage{process!=""}) by (exported_instance)
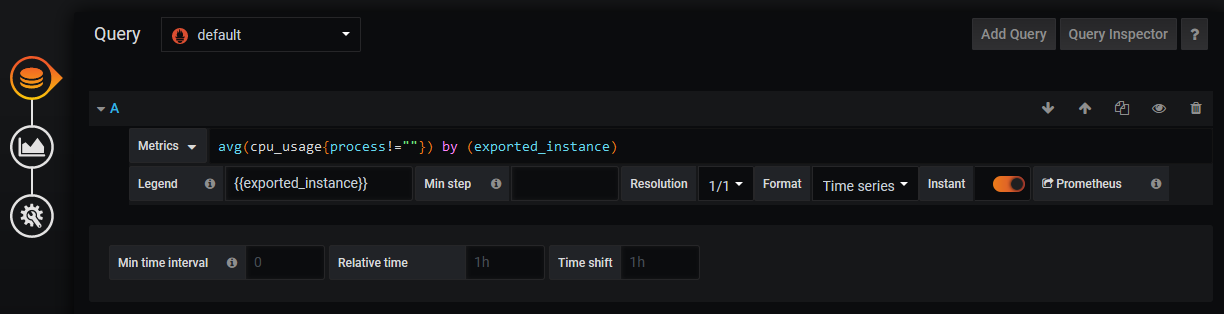
- 平均 CPU 使用率(PromQL query):
avg(cpu_usage{process!=""}) by (exported_instance)
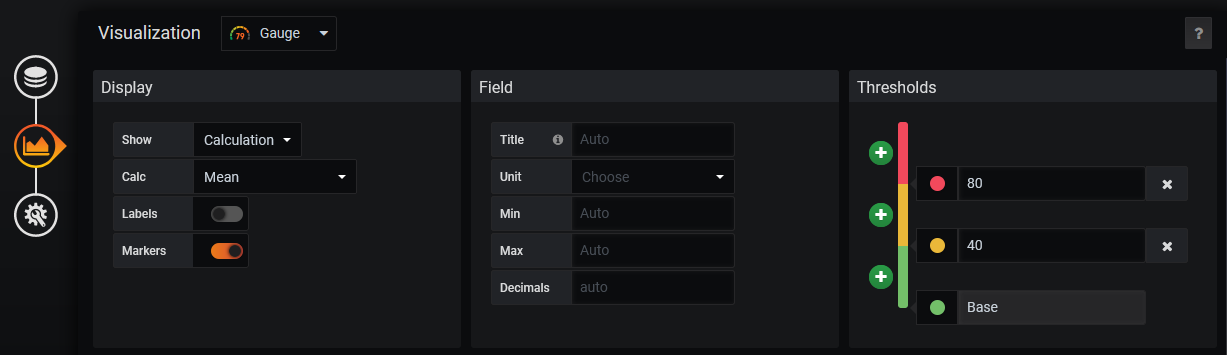

- 当前 CPU 使用率(PromQL query):
sum(memory_usage) by (exported_instance)


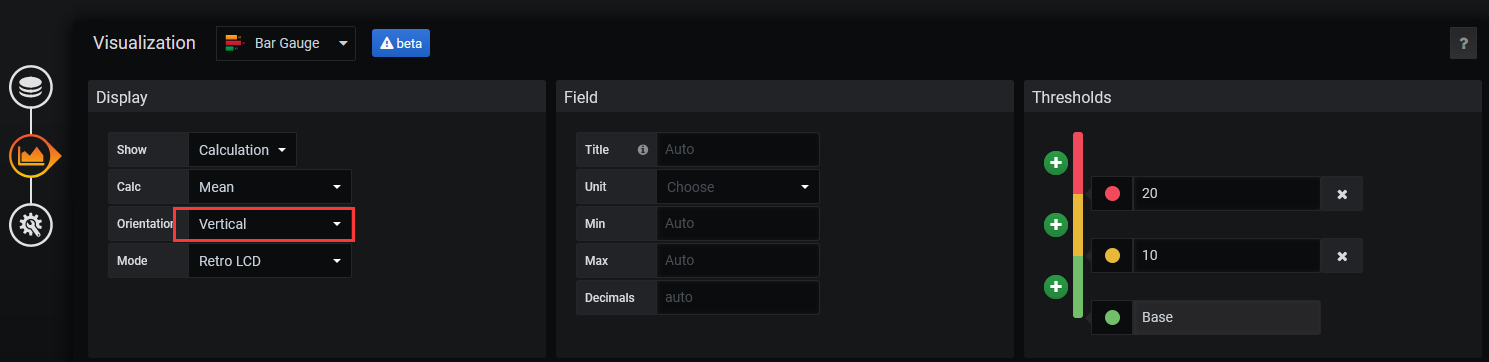
- 添加 Bar Gauges 数据
- 选择 Bar Gauges

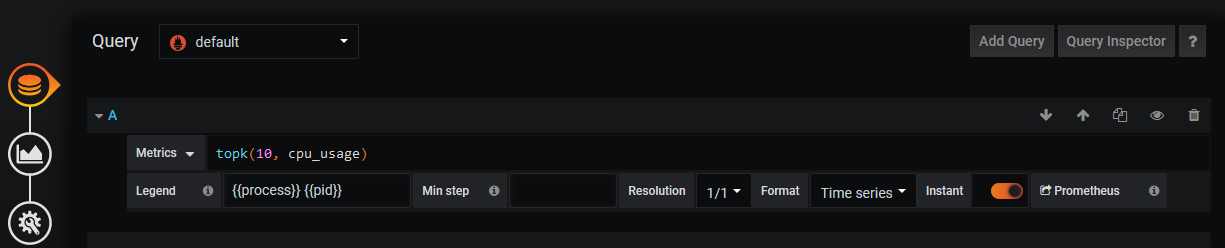
- 当前 cpu 使用率前10的进程指标数据:
topk(10, cpu_usage)
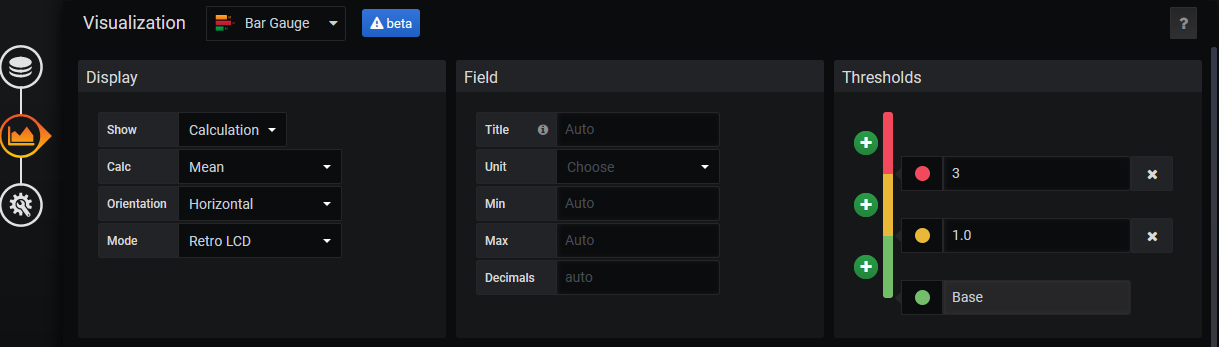
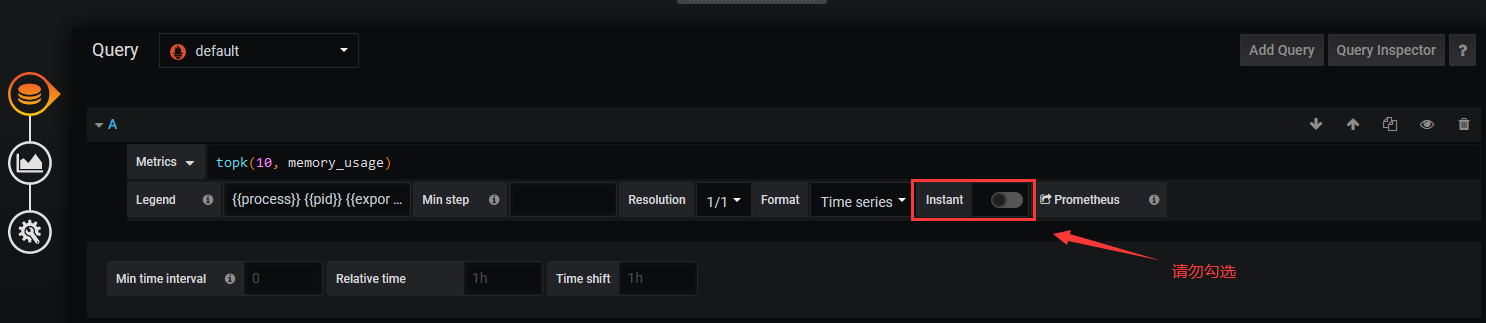
- 当前 memory 使用率前 10 的进程指标数据:
topk(10, memory_usage)

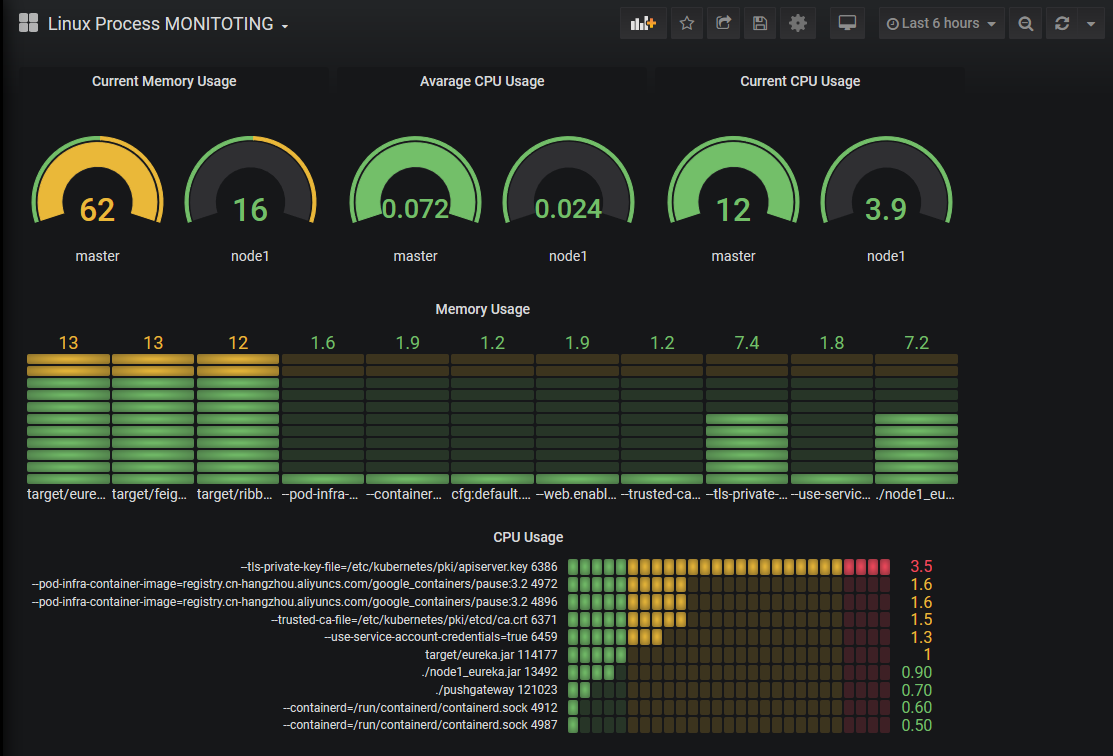
最终效果图

 浙公网安备 33010602011771号