cs152 lab1
the report finished in first time
the report finished in first time
3.4
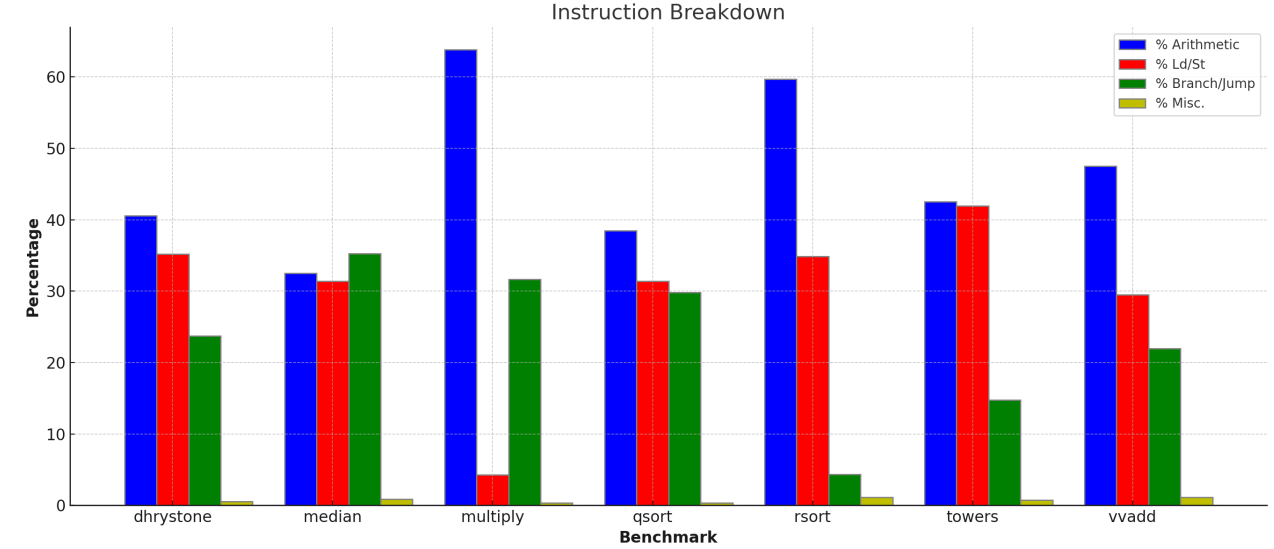
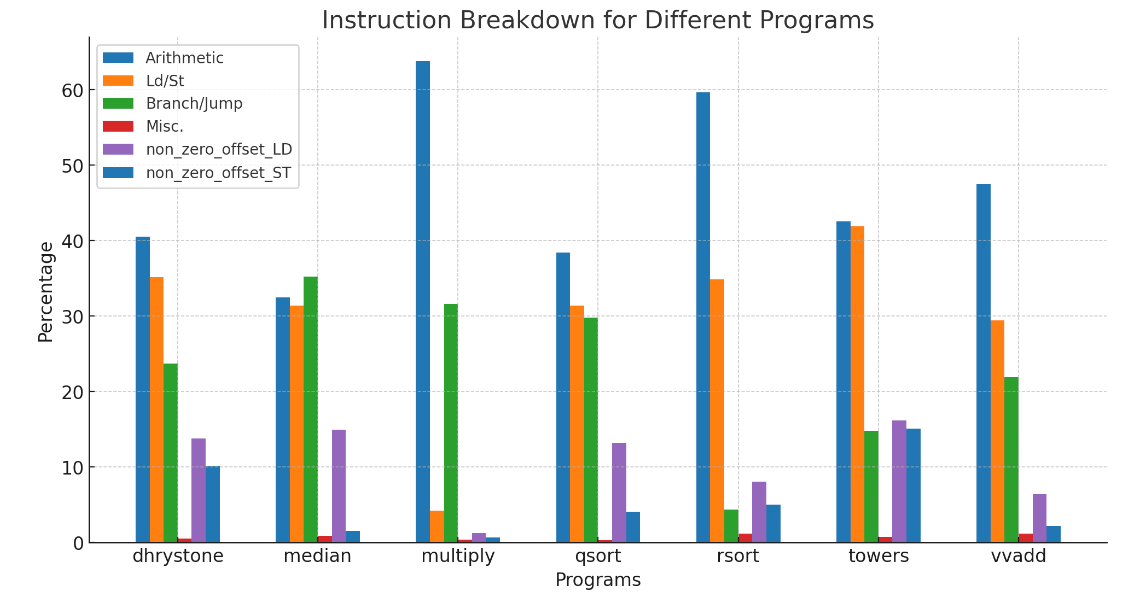
Note how the mix of different types of instructions vary between benchmarks. Record the mix
for each benchmark. (Remember: Do not provide raw dumps. A good way to visualize this kind
of data would be a bar graph.) Which benchmark has the highest arithmetic intensity? Which
benchmark seems most likely to be memory bound? Which benchmark seems most likely to be
dependent on branch predictor performance?
multiply这个benchmark的计算强度最高;
因为在roofline模型中,越低的计算强度越有可能会在脊点的左侧,即是memory bound。因此,先计算一下(计算指令/存储加载指令),median这个benchmark为31.845/32.147=0.9906; towers这个benchmark为41.702÷42.197=0.9882. 所以,结论为towers
median这个benchmark最有可能依赖branch predictor,因为这个benchmark中的branch/jump指令占比最高,最容易受branch predictor影响

3.5
Consider the results gathered from the RV32 1-stage processor. Suppose you were to design a
new machine such that the average CPI of loads and stores is 2 cycles, integer arithmetic
instructions take 1 cycle, and other instructions take 1.5 cycles on average. What is the overall
CPI of the machine for each benchmark?
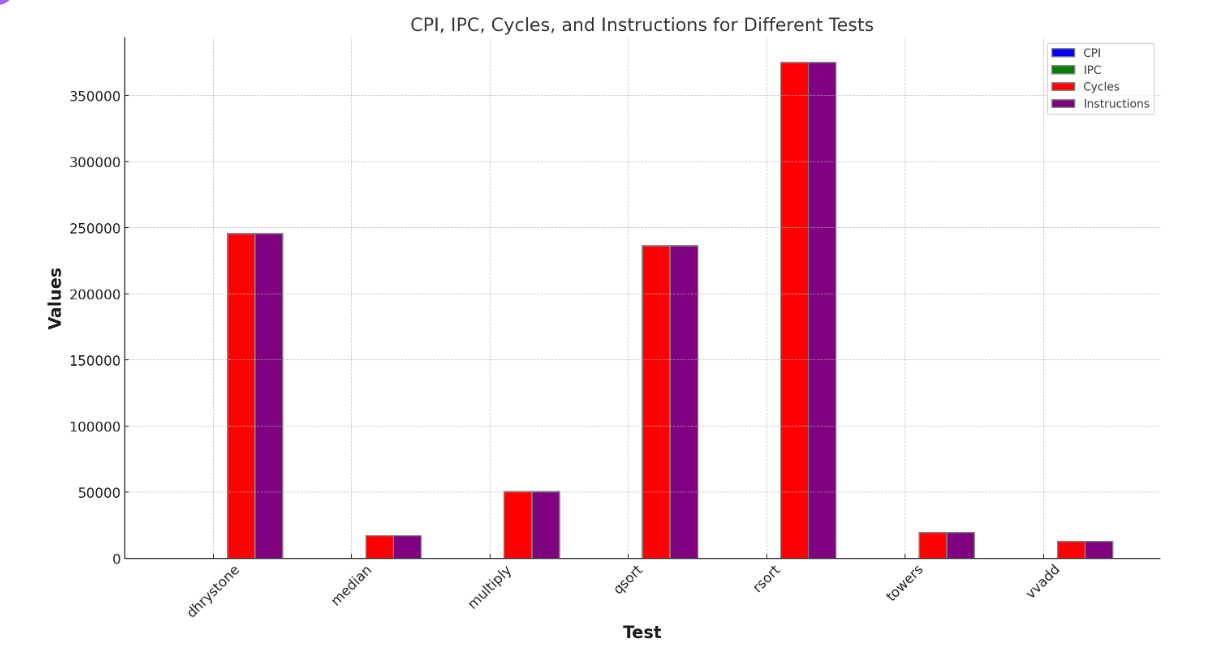
dhrystone这个benchmark在RV32 1stage processor的结果:
Stats:

CPI          : 1.000
IPC          : 1.000
Cycles       : 245738
Instructions : 245739
Bubbles      : 0

Instruction Breakdown:
% Arithmetic  : 40.379 %
% Ld/St       : 35.324 %
% Branch/Jump : 23.757 %
% Misc.       : 0.541 %
这里INST=245739, arithmetic占40.379%,约为99227条arithmetic指令; 同理,ld/st约为86804条指令,branch/jump约为58380条指令, misc约为1329条指令
在新的CPI条件下,大约\(cycles=99227*1 + 86804*2+ 58380*1.5 + 1329*1.5=362398\),这样CPI=362398/245739=1.475
What is the relative performance for each benchmark if loads/stores are sped up to have an
average CPI of 1? Is this still a worthwhile modification if it means that the cycle time increases
30%? Is it worthwhile for all benchmarks or only a subset? Explain.
那么时钟周期的计算公式改为:
\(cycles=99227*1 + 86804*1+ 58380*1.5 + 1329*1.5=275594\),这样CPI=275594/245739=1.121
如果时钟周期的时间增加30%,可以计算一下275594*1.3 - 362398 = −4125.8,因此可以得知虽然减少了时间周期数,但增加了时钟时间,经过转换计算,总体的执行时间应该是可以降低的,因此是值得在增加30%时钟时间条件下,加速ld/st指令的CPI到1的。
至于其他的benchmark,也可以采取相同的计算方法来回答3.5
3.6
SETTING1
- full bypass
- 5stage
SETTING2
- interlock
- 5stage
How does full bypassing perform
compared to full interlocking? If adding full bypassing would hurt the cycle time of the processor
by 25%, would it be worth it? Argue your case quantitatively.
因为full interlock和full bypass都是在相同的处理器中进行测试,因此时钟周期的时间是相等的,那么直接比较cycles:
全互锁的Cycles数值:
Dhrystone: 481129
Median: 30490
Multiply: 94867
Qsort: 456100
Rsort: 869612
Towers: 30930
Vvadd: 21906
全旁路的Cycles数值:
Dhrystone: 321955
Median: 24274
Multiply: 78291
Qsort: 335258
Rsort: 405558
Towers: 23604
Vvadd: 16578
现在,我们比较这两组数据来看哪一组的Cycles数值更低:
Dhrystone:全旁路较低。
Median:全旁路较低。
Multiply:全旁路较低。
Qsort:全旁路较低。
Rsort:全旁路较低。
Towers:全旁路较低。
Vvadd:全旁路较低。
对于其他指标:
CPI(Clock Cycles per Instruction):全旁路的测试中,CPI普遍较低,这表示每条指令需要更少的时钟周期来完成。这是因为全旁路减少了由于数据冒险导致的暂停。
IPC(Instructions per Cycle):全旁路的IPC值普遍较高,表明每个时钟周期内完成的指令数更多。这是高效流水线操作的直接结果,减少了因数据依赖导致的等待。
Cycles(总时钟周期数):尽管总指令数相似,但全旁路在大多数测试中展示了更少的总时钟周期数,这表明整体上执行更快。
Bubbles(气泡数):全旁路技术的测试中,气泡数通常较低,这表明因数据冒险导致的暂停更少。
因此得出结论:full bypass性能更好
如果full bypass使得cycle time增加25%,那么可以再次计算一下等效耗时
- dhrystone:
321955 * 1.25 - 481129 = -78,685.25 - median:
24274 * 1.25 - 30490 = -147.5 - multiply:
78291 * 1.25 - 94867 = 2,996.75 - qsort:
335258 * 1.25 - 456100 = -37,027.5 - rsort:
405558 *1.25 - 869612 = -362,664.5 - towers:
23604 * 1.25 - 30930 = -1,425 - vvadd:
16578 * 1.25 - 21906 = -1,183.5
因此,结论是值得的
3.7
增加指令数量的比较为:
What percentages of the instruction mix do the various types of load and store instructions make
up? Evaluate the new design in terms of the percentage increase in the number of instructions
that will have to be executed. Which design would you advise your employer to adopt? Justify
your position quantitatively.
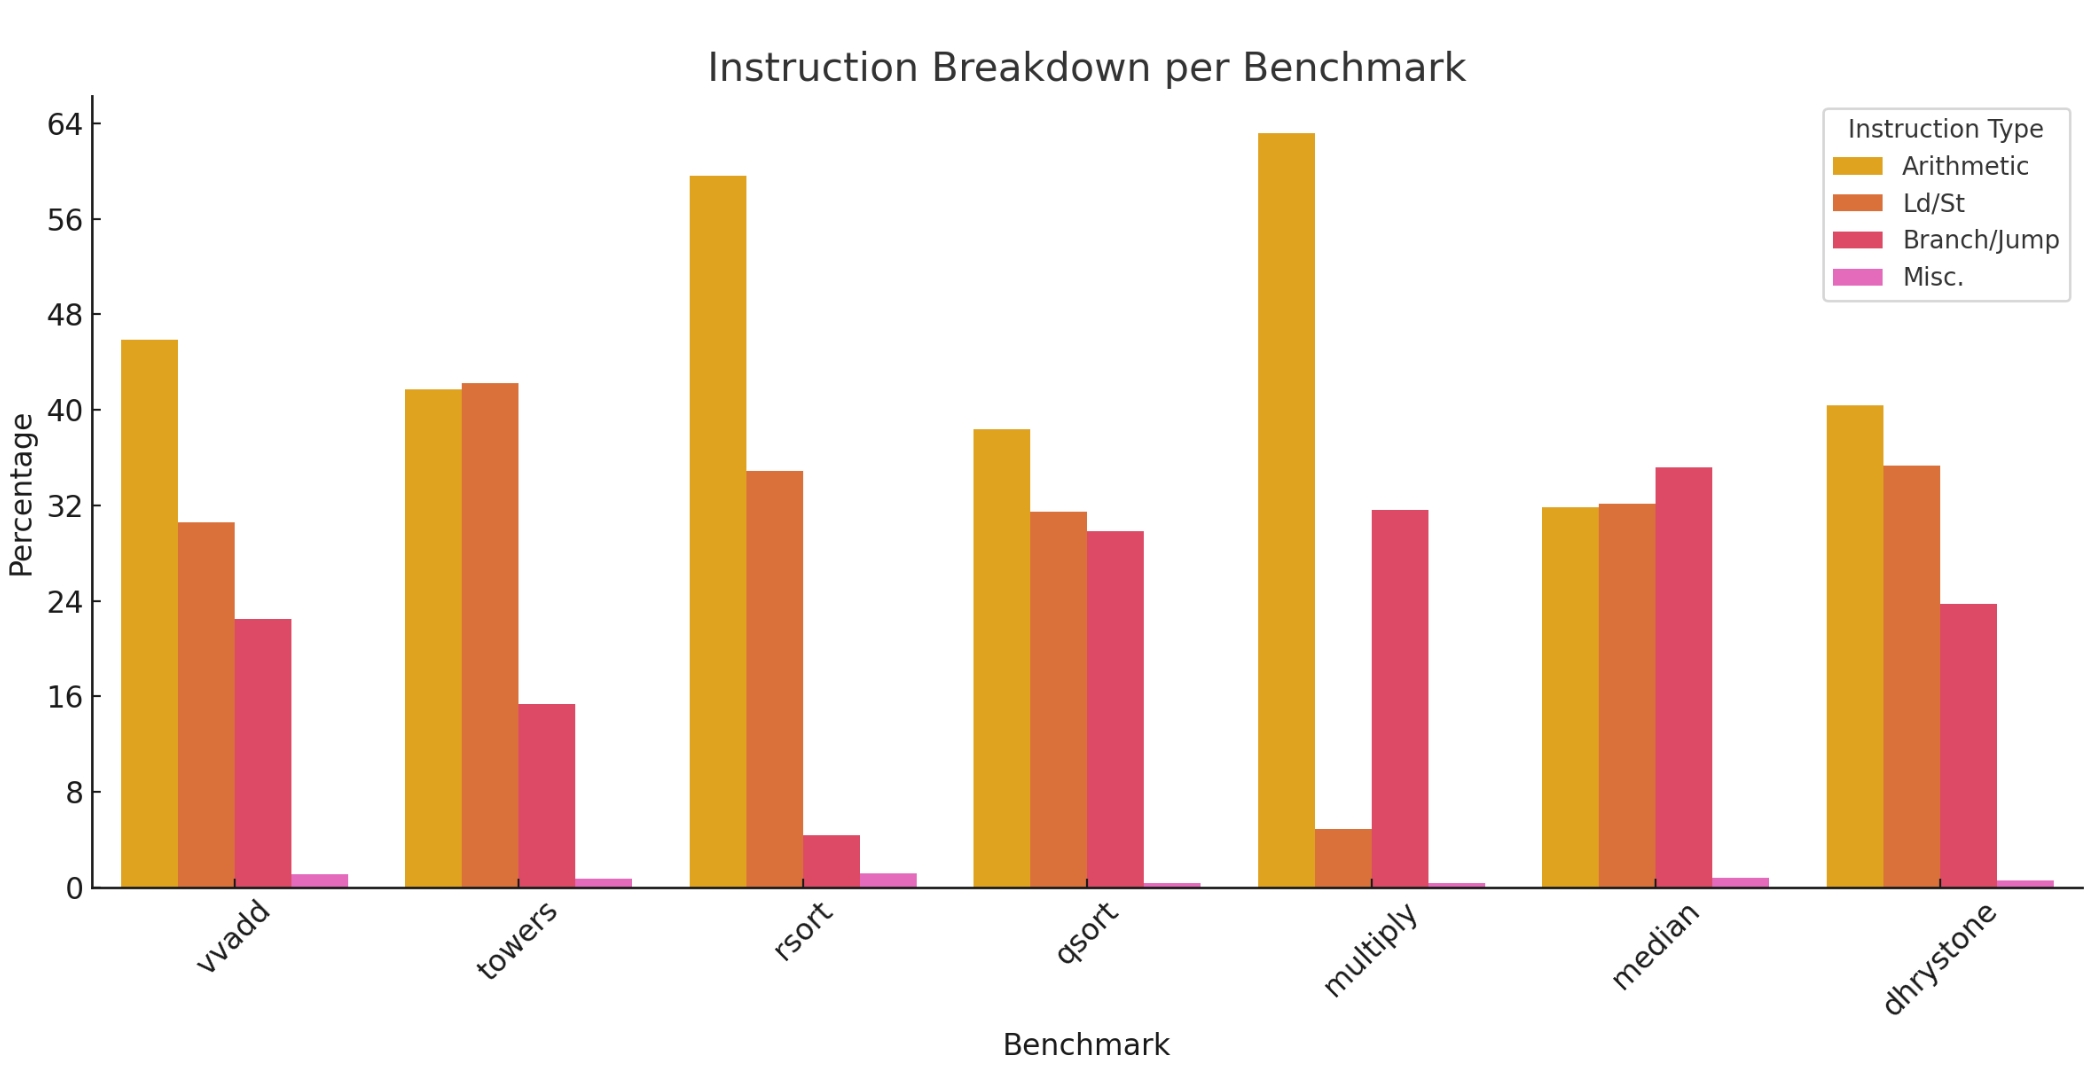
图中,黄色Ld/St指令是各类load store指令的占比;
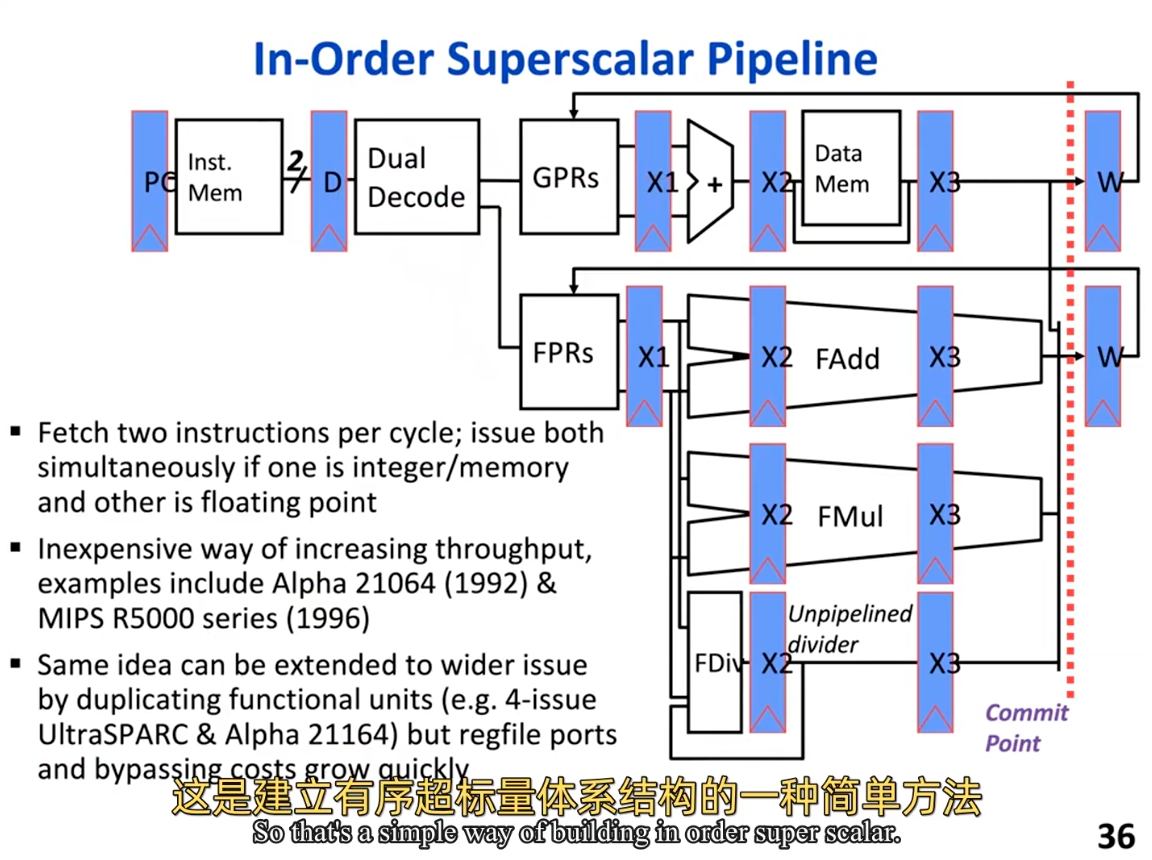
根据所提出的设计,这些non zero offset的LD/ST指令会被分成两个指令。
原始设计是5stage,新的设计为4stage,指令数量增加了,每个stage的cycle并没有减少(因为仍然要与最慢的mem这个stage的cycle time对齐。
由于是流水线处理器设计,所以每一个cycle完成一条指令,第一条指令的latency由5减少为4,但是后续指令仍然是每一个cycle完成一条。
指令数量的增加,明显增加了总周期数量,因此新的设计看起来并没有比5stage这种旧的设计好。
但是,如果可以增加一个解码器,那么在一个时钟周期内可以发射两条指令,一条指令是alu(比如计算non zero offset),不涉及mem的,另一条是只设计mem(已经把non zero offset计算好了,可以直接读mem),而不涉及alu的。这样,在理想情况下可以抵消掉non zero offset所增加的指令数量,带来的总周期数增加。
the report finished in second time @2025.7.20
the report finished in second time @2025.7.20
first settle the environment according to the instruction, then start off with chapter 3.4. run each benchmark with 1stage process simulation, along with tracer.py generating the statistics.
3.4
Note how the mix of different types of instructions vary between benchmarks. Record the mix for each benchmark. (Remember: Do not provide raw dumps. A good way to visualize this kind of data would be a bar graph.) Which benchmark has the highest arithmetic intensity? Which benchmark seems most likely to be memory bound? Which benchmark seems most likely to be dependent on branch predictor performance?
the simulation report is
vvadd
Stats:

CPI          : 1.000
IPC          : 1.000
Cycles       : 12955
Instructions : 12956
Bubbles      : 0

Instruction Breakdown:
% Arithmetic  : 45.878 %
% Ld/St       : 30.573 %
% Branch/Jump : 22.468 %
% Misc.       : 1.081 %
% non_zero_Offset LD  : 7.402 %
% non_zero_Offset_ST  : 2.061 %


towers
Stats:

CPI          : 1.000
IPC          : 1.000
Cycles       : 19612
Instructions : 19613
Bubbles      : 0

Instruction Breakdown:
% Arithmetic  : 41.702 %
% Ld/St       : 42.197 %
% Branch/Jump : 15.388 %
% Misc.       : 0.714 %
% non_zero_Offset LD  : 16.515 %
% non_zero_Offset_ST  : 14.516 %

rsort
Stats:

CPI          : 1.000
IPC          : 1.000
Cycles       : 375222
Instructions : 375223
Bubbles      : 0

Instruction Breakdown:
% Arithmetic  : 59.580 %
% Ld/St       : 34.870 %
% Branch/Jump : 4.398 %
% Misc.       : 1.152 %
% non_zero_Offset LD  : 8.120 %
% non_zero_Offset_ST  : 5.010 %


qsort
Stats:

CPI          : 1.000
IPC          : 1.000
Cycles       : 236620
Instructions : 236621
Bubbles      : 0

Instruction Breakdown:
% Arithmetic  : 38.382 %
% Ld/St       : 31.471 %
% Branch/Jump : 29.825 %
% Misc.       : 0.322 %
% non_zero_Offset LD  : 13.253 %
% non_zero_Offset_ST  : 4.059 %

multiply
Stats:

CPI          : 1.000
IPC          : 1.000
Cycles       : 50619
Instructions : 50620
Bubbles      : 0

Instruction Breakdown:
% Arithmetic  : 63.151 %
% Ld/St       : 4.883 %
% Branch/Jump : 31.618 %
% Misc.       : 0.348 %
% non_zero_Offset LD  : 1.588 %
% non_zero_Offset_ST  : 0.626 %


median
Stats:

CPI          : 1.000
IPC          : 1.000
Cycles       : 17173
Instructions : 17174
Bubbles      : 0

Instruction Breakdown:
% Arithmetic  : 31.845 %
% Ld/St       : 32.147 %
% Branch/Jump : 35.193 %
% Misc.       : 0.815 %
% non_zero_Offset LD  : 15.366 %
% non_zero_Offset_ST  : 1.508 %


dhrystone
Stats:

CPI          : 1.000
IPC          : 1.000
Cycles       : 245738
Instructions : 245739
Bubbles      : 0

Instruction Breakdown:
% Arithmetic  : 40.379 %
% Ld/St       : 35.324 %
% Branch/Jump : 23.757 %
% Misc.       : 0.541 %
% non_zero_Offset LD  : 13.904 %
% non_zero_Offset_ST  : 10.081 %
the bar graph related to this data
since the highest arithmetic intensity depends on \(number of arithmetic insts / number of insts related to memory operations\), thus multiply benchmark has highest arithmetic intensity
the more insts related to memory operations, the more likely memory bound it seems to be. thus towers benchmark seems most likely to be memory bound.
the more branch/jump insts it has, the more likely it is dependent on branch predicator
3.5
Consider the results gathered from the RV32 1-stage processor. Suppose you were to design a new machine such that the average CPI of loads and stores is 2 cycles, integer arithmetic instructions take 1 cycle, and other instructions take 1.5 cycles on average. What is the overall CPI of the machine for each benchmark?
answer
🔧 Context Recap
You said:
The statistics data is gathered from an RV32 1-stage processor, where CPI = 1 for all instructions.
You’re now designing a new machine with:
- Arithmetic = 1.0 cycle
- Load/Store (Ld/St) = 2.0 cycles
- Other instructions (Branch + Misc) = 1.5 cycles
The question is:
Given the instruction breakdown percentages, what would be the new average CPI for each benchmark?
🧠 Step-by-Step Thought Process
Step 1: Understand what the instruction breakdown percentages mean
You provided, for each benchmark, the percentage of instructions that are:
- Arithmetic
- Load/Store (Ld/St)
- Branch/Jump
- Misc.
These are mutually exclusive categories, and together they add up to ~100%.
So for each benchmark, we can use this data to weight the execution time per instruction type.
Step 2: Map execution time per instruction type on the new machine
| Instruction Type | Latency (in cycles) on New Machine |
|---|---|
| Arithmetic | 1.0 |
| Ld/St | 2.0 |
| Branch/Jump | 1.5 |
| Misc. | 1.5 |
Why branch/misc is grouped:
- The problem says “other instructions take 1.5 cycles on average,” so we combine
Branch/JumpandMisc.into one category with cost 1.5.
Step 3: Use the weighted average CPI formula
The formula is:
This gives you:
- Total cycles per 100 instructions (since percentages are out of 100)
- Dividing by 100 gives the average cycles per instruction (CPI)
Step 4: Apply the formula to each benchmark
Let's do an example manually:
🧪 Example: vvadd
From your data:
- Arithmetic: 45.878%
- Ld/St: 30.573%
- Branch/Jump: 22.468%
- Misc.: 1.081%
✅ This gives a new CPI of 1.423 for vvadd.
I repeated this computation for each benchmark program using the data and same formula.
Step 5: Summarize the results
Here’s what we get:
| Benchmark | Arithmetic % | Ld/St % | Branch+Misc % | New CPI (calc) |
|---|---|---|---|---|
| vvadd | 45.878 | 30.573 | 23.549 | 1.423 |
| towers | 41.702 | 42.197 | 16.102 | 1.502 |
| rsort | 59.580 | 34.870 | 5.550 | 1.376 |
| qsort | 38.382 | 31.471 | 30.147 | 1.465 |
| multiply | 63.151 | 4.883 | 31.966 | 1.209 |
| median | 31.845 | 32.147 | 36.008 | 1.502 |
| dhrystone | 40.379 | 35.324 | 24.298 | 1.475 |
Benchmarks with:
- More arithmetic and fewer Ld/St → lower CPI (e.g.
multiply,rsort) - More memory and branch → higher CPI (e.g.
median,towers)
What is the relative performance for each benchmark if loads/stores are sped up to have an average CPI of 1?Is this still a worthwhile modification if it means that the cycle time increases 30%? Is it worthwhile for all benchmarks or only a subset? Explain.
answer
speedup is a reflection on relative performance
speedup = old execution time / new execution time.
execution time = insts count x cpi x cycle time. since for each benchmark, inits count and cycle time is unchanged, we get speedup = old cpi / new cpi
for exmaple:
towers
Stats:

CPI          : 1.000
IPC          : 1.000
Cycles       : 19612
Instructions : 19613
Bubbles      : 0

Instruction Breakdown:
% Arithmetic  : 41.702 %
% Ld/St       : 42.197 %
% Branch/Jump : 15.388 %
% Misc.       : 0.714 %
% non_zero_Offset LD  : 16.515 %
% non_zero_Offset_ST  : 14.516 %
speedup of towers = (41.7 x 1 + 42.197 x 2 + (15.388+0.714) x 1.5) / (41.7 x 1 + 42.197 x 1 + (15.388+0.714) x 1.5) = 150.247 / 108.05 = 1.3905
consider optimizing the ld/st inst has an average cpi of 1 but with cycle time increasing 30%. we get the relative speedup with 30% slower clock
we have the new speedup of towers = old cpi x old cyctime / new cpi x new cyctime = 150.247 x 1 / 108.05 x 1.3 = 1.069 (this calculation reflects we have 30% slower clock if optimize ld/st inst to 1cycle )
apply to all benchmarks, we get the result as following:
| Benchmark | Original CPI | Optimized CPI | Relative Speedup (no penalty) | Relative Speedup (with 30% slower clock) |
|---|---|---|---|---|
| vvadd | 1.423 | 1.118 | 1.274 | 0.980 |
| towers | 1.502 | 1.081 | 1.391 | 1.070 |
| rsort | 1.376 | 1.028 | 1.339 | 1.030 |
| qsort | 1.465 | 1.151 | 1.273 | 0.980 |
| multiply | 1.209 | 1.160 | 1.042 | ❌ 0.802 |
| median | 1.502 | 1.180 | 1.272 | 0.979 |
| dhrystone | 1.475 | 1.122 | 1.315 | 1.012 |
according to the result, it's not worthwhile(if we have to slow 30% clock to acquire optimization in cpi of ld/st inst ) if last column has speedup lower than 1.
3.6
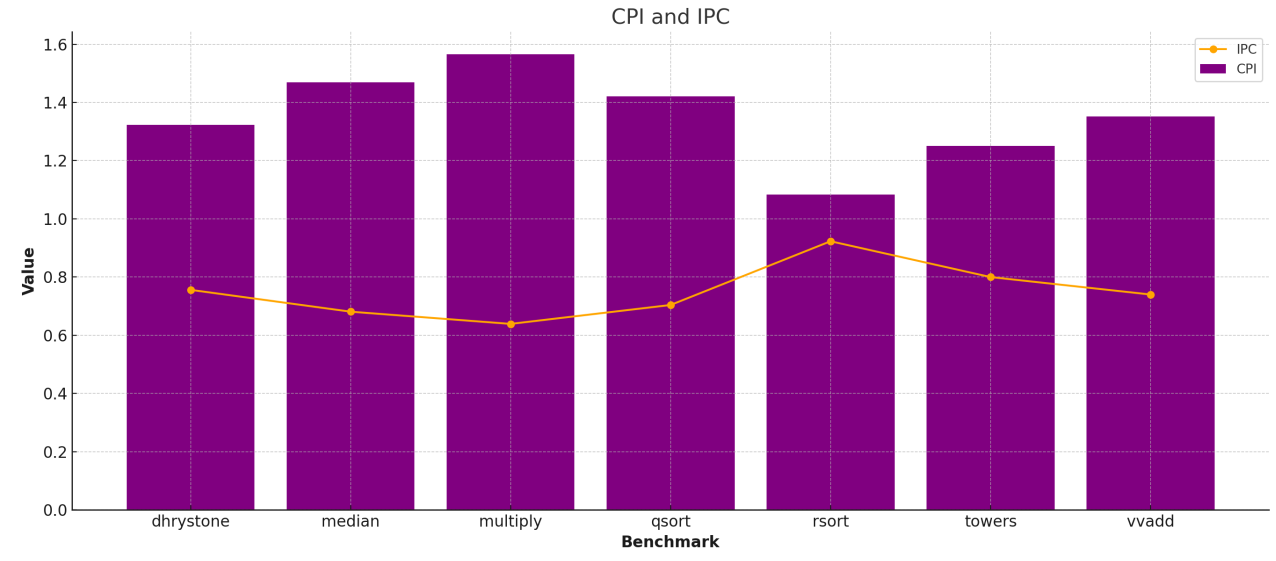
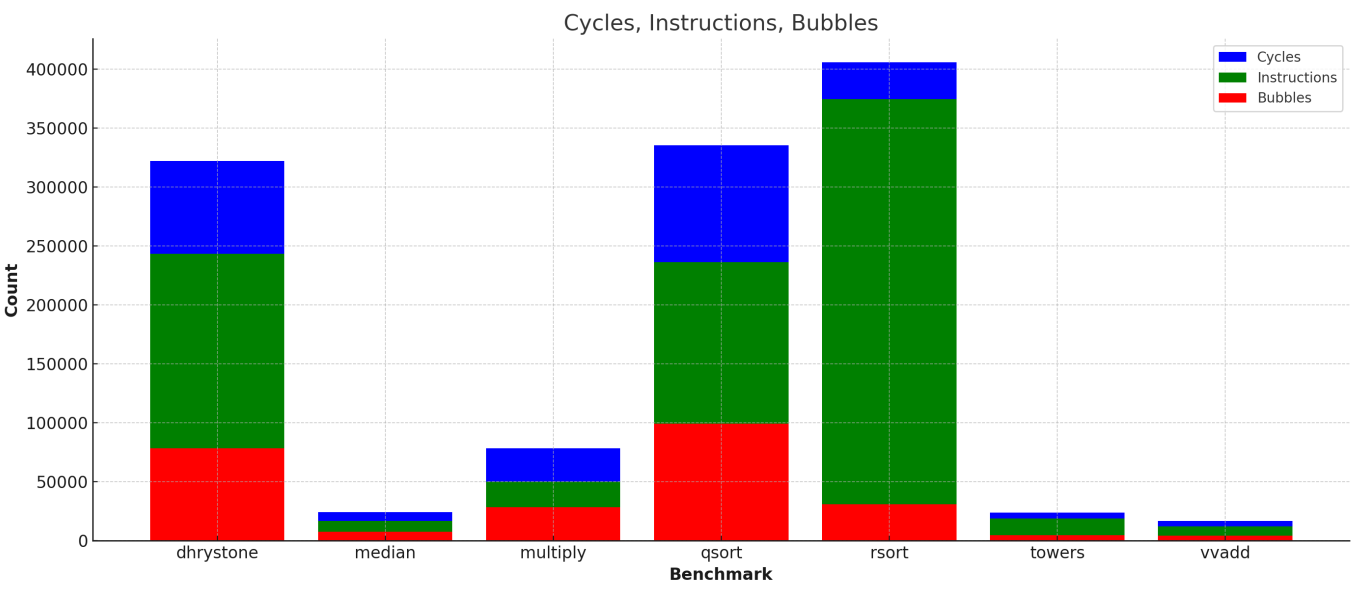
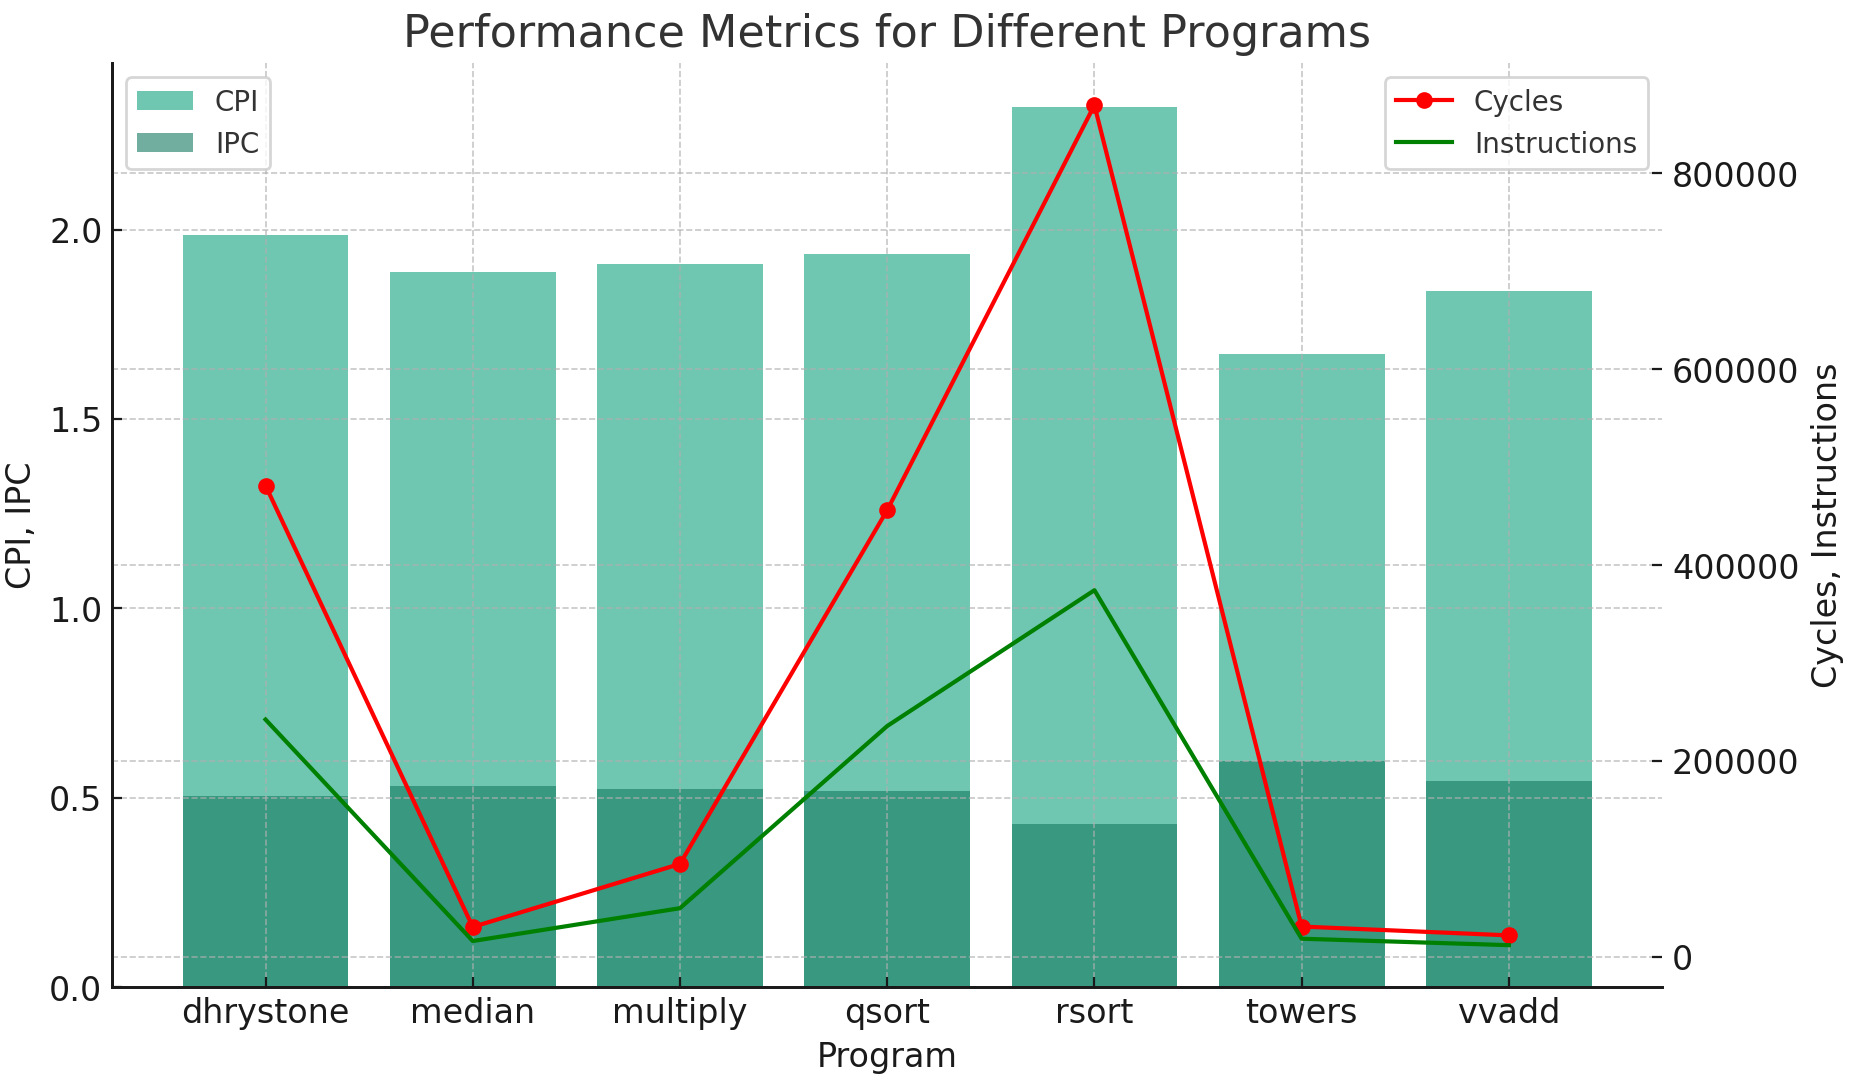
Record the CPI values for all benchmarks. Are they what you expected?
default config: with full bypass enabled
(/home/tangke/cs152/chipyard/.conda-env) tangke@tangke:~/cs152/chipyard-cs152-sp23/sims/verilator$ ${SCRIPTS}/tracer.py output/chipyard.TestHarness.Sodor5StageConfig/vvadd.out

Stats:

CPI          : 1.352
IPC          : 0.740
Cycles       : 16578
Instructions : 12264
Bubbles      : 4315

Instruction Breakdown:
% Arithmetic  : 47.472 %
% Ld/St       : 29.460 %
% Branch/Jump : 21.926 %
% Misc.       : 1.142 %
% non_zero_Offset LD  : 6.401 %
% non_zero_Offset_ST  : 2.177 %


(/home/tangke/cs152/chipyard/.conda-env) tangke@tangke:~/cs152/chipyard-cs152-sp23/sims/verilator$ ${SCRIPTS}/tracer.py output/chipyard.TestHarness.Sodor5StageConfig/towers.out

Stats:

CPI          : 1.250
IPC          : 0.800
Cycles       : 23604
Instructions : 18877
Bubbles      : 4728

Instruction Breakdown:
% Arithmetic  : 42.544 %
% Ld/St       : 41.935 %
% Branch/Jump : 14.780 %
% Misc.       : 0.742 %
% non_zero_Offset LD  : 16.205 %
% non_zero_Offset_ST  : 15.082 %

(/home/tangke/cs152/chipyard/.conda-env) tangke@tangke:~/cs152/chipyard-cs152-sp23/sims/verilator$ ${SCRIPTS}/tracer.py output/chipyard.TestHarness.Sodor5StageConfig/rsort.out

Stats:

CPI          : 1.083
IPC          : 0.923
Cycles       : 405558
Instructions : 374484
Bubbles      : 31075

Instruction Breakdown:
% Arithmetic  : 59.661 %
% Ld/St       : 34.844 %
% Branch/Jump : 4.340 %
% Misc.       : 1.155 %
% non_zero_Offset LD  : 8.089 %
% non_zero_Offset_ST  : 5.020 %

(/home/tangke/cs152/chipyard/.conda-env) tangke@tangke:~/cs152/chipyard-cs152-sp23/sims/verilator$ ${SCRIPTS}/tracer.py output/chipyard.TestHarness.Sodor5StageConfig/qsort.out

Stats:

CPI          : 1.421
IPC          : 0.704
Cycles       : 335258
Instructions : 235998
Bubbles      : 99261

Instruction Breakdown:
% Arithmetic  : 38.448 %
% Ld/St       : 31.403 %
% Branch/Jump : 29.826 %
% Misc.       : 0.323 %
% non_zero_Offset LD  : 13.212 %
% non_zero_Offset_ST  : 4.070 %

(/home/tangke/cs152/chipyard/.conda-env) tangke@tangke:~/cs152/chipyard-cs152-sp23/sims/verilator$ ${SCRIPTS}/tracer.py output/chipyard.TestHarness.Sodor5StageConfig/multiply.out

Stats:

CPI          : 1.565
IPC          : 0.639
Cycles       : 78291
Instructions : 50024
Bubbles      : 28268

Instruction Breakdown:
% Arithmetic  : 63.791 %
% Ld/St       : 4.238 %
% Branch/Jump : 31.619 %
% Misc.       : 0.352 %
% non_zero_Offset LD  : 1.255 %
% non_zero_Offset_ST  : 0.634 %

(/home/tangke/cs152/chipyard/.conda-env) tangke@tangke:~/cs152/chipyard-cs152-sp23/sims/verilator$ ${SCRIPTS}/tracer.py output/chipyard.TestHarness.Sodor5StageConfig/median.out

Stats:

CPI          : 1.469
IPC          : 0.681
Cycles       : 24274
Instructions : 16523
Bubbles      : 7752

Instruction Breakdown:
% Arithmetic  : 32.470 %
% Ld/St       : 31.405 %
% Branch/Jump : 35.278 %
% Misc.       : 0.847 %
% non_zero_Offset LD  : 14.967 %
% non_zero_Offset_ST  : 1.568 %

(/home/tangke/cs152/chipyard/.conda-env) tangke@tangke:~/cs152/chipyard-cs152-sp23/sims/verilator$ ${SCRIPTS}/tracer.py output/chipyard.TestHarness.Sodor5StageConfig/dhrystone.out

Stats:

CPI          : 1.323
IPC          : 0.756
Cycles       : 321955
Instructions : 243390
Bubbles      : 78566

Instruction Breakdown:
% Arithmetic  : 40.531 %
% Ld/St       : 35.198 %
% Branch/Jump : 23.725 %
% Misc.       : 0.546 %
% non_zero_Offset LD  : 13.805 %
% non_zero_Offset_ST  : 10.178 %
I dive into the absolute count of arithmetic insts in the first place. for vvadd benchmark, it has $12956×0.45878 = 5943.95368 $ arithmetic insts in 1-stage processor. but $12264×0.47472 = 5821.96608 $ arithmetic insts in 5-stage processor. besides, count of total instructions has changed between 1-stage and 5-stage in the same benchmark.
Specifically, pipelined processor has to insert some NOP to avoid hazard that cannot be dealt with by bypass, leading to more total number of instructions. but regarding to vvadd benchmark, the 5-stage processor has 12264 total insts which is lower than 12956 total insts in 1-stage. the result is really weired and far from what i expected
Now disable full bypassing in consts.scala, and re-run the build (check that your Chisel code recompiles).Record the new CPI values for all benchmarks. How does full bypassing perform compared to full interlocking?
with full bypass disabled
(/home/tangke/cs152/chipyard/.conda-env) tangke@tangke:~/cs152/chipyard-cs152-sp23/sims/verilator$ ${SCRIPTS}/tracer.py output/chipyard.TestHarness.Sodor5StageConfig/vvadd.out

Stats:

CPI          : 1.839
IPC          : 0.544
Cycles       : 21906
Instructions : 11912
Bubbles      : 9995

Instruction Breakdown:
% Arithmetic  : 48.212 %
% Ld/St       : 28.601 %
% Branch/Jump : 22.011 %
% Misc.       : 1.175 %
% non_zero_Offset LD  : 5.725 %
% non_zero_Offset_ST  : 2.241 %

(/home/tangke/cs152/chipyard/.conda-env) tangke@tangke:~/cs152/chipyard-cs152-sp23/sims/verilator$ ${SCRIPTS}/tracer.py output/chipyard.TestHarness.Sodor5StageConfig/towers.out

Stats:

CPI          : 1.672
IPC          : 0.598
Cycles       : 30930
Instructions : 18503
Bubbles      : 12428

Instruction Breakdown:
% Arithmetic  : 43.009 %
% Ld/St       : 41.647 %
% Branch/Jump : 14.587 %
% Misc.       : 0.757 %
% non_zero_Offset LD  : 15.965 %
% non_zero_Offset_ST  : 15.387 %

(/home/tangke/cs152/chipyard/.conda-env) tangke@tangke:~/cs152/chipyard-cs152-sp23/sims/verilator$ ${SCRIPTS}/tracer.py output/chipyard.TestHarness.Sodor5StageConfig/rsort.out

Stats:

CPI          : 2.323
IPC          : 0.430
Cycles       : 869612
Instructions : 374344
Bubbles      : 495269

Instruction Breakdown:
% Arithmetic  : 59.695 %
% Ld/St       : 34.807 %
% Branch/Jump : 4.343 %
% Misc.       : 1.155 %
% non_zero_Offset LD  : 8.067 %
% non_zero_Offset_ST  : 5.022 %

(/home/tangke/cs152/chipyard/.conda-env) tangke@tangke:~/cs152/chipyard-cs152-sp23/sims/verilator$ ${SCRIPTS}/tracer.py output/chipyard.TestHarness.Sodor5StageConfig/qsort.out

Stats:

CPI          : 1.935
IPC          : 0.517
Cycles       : 456100
Instructions : 235665
Bubbles      : 220436

Instruction Breakdown:
% Arithmetic  : 38.475 %
% Ld/St       : 31.363 %
% Branch/Jump : 29.839 %
% Misc.       : 0.323 %
% non_zero_Offset LD  : 13.189 %
% non_zero_Offset_ST  : 4.076 %

(/home/tangke/cs152/chipyard/.conda-env) tangke@tangke:~/cs152/chipyard-cs152-sp23/sims/verilator$ ${SCRIPTS}/tracer.py output/chipyard.TestHarness.Sodor5StageConfig/multiply.out

Stats:

CPI          : 1.910
IPC          : 0.524
Cycles       : 94867
Instructions : 49663
Bubbles      : 45205

Instruction Breakdown:
% Arithmetic  : 64.136 %
% Ld/St       : 3.870 %
% Branch/Jump : 31.639 %
% Misc.       : 0.354 %
% non_zero_Offset LD  : 1.065 %
% non_zero_Offset_ST  : 0.638 %

(/home/tangke/cs152/chipyard/.conda-env) tangke@tangke:~/cs152/chipyard-cs152-sp23/sims/verilator$ medi^C
(/home/tangke/cs152/chipyard/.conda-env) tangke@tangke:~/cs152/chipyard-cs152-sp23/sims/verilator$ ${SCRIPTS}/tracer.py output/chipyard.TestHarness.Sodor5StageConfig/median.out

Stats:

CPI          : 1.888
IPC          : 0.530
Cycles       : 30490
Instructions : 16146
Bubbles      : 14345

Instruction Breakdown:
% Arithmetic  : 32.726 %
% Ld/St       : 30.862 %
% Branch/Jump : 35.544 %
% Misc.       : 0.867 %
% non_zero_Offset LD  : 14.679 %
% non_zero_Offset_ST  : 1.604 %

(/home/tangke/cs152/chipyard/.conda-env) tangke@tangke:~/cs152/chipyard-cs152-sp23/sims/verilator$ ${SCRIPTS}/tracer.py output/chipyard.TestHarness.Sodor5StageConfig/dhrystone.out

Stats:

CPI          : 1.986
IPC          : 0.504
Cycles       : 481129
Instructions : 242303
Bubbles      : 238827

Instruction Breakdown:
% Arithmetic  : 40.631 %
% Ld/St       : 35.092 %
% Branch/Jump : 23.729 %
% Misc.       : 0.549 %
% non_zero_Offset LD  : 13.735 %
% non_zero_Offset_ST  : 10.224 %
Under the hypothesis of with and without full bypass running on the same 5-stage processor have the same clock time, Execution time = Instructions x CPI.
Collect the result as follow:
full bypass / full interlock recorded in chart
| benchmark | insts | cpi | execution time |
|---|---|---|---|
| vvadd | 12264/11912 | 1.352/1.839 | 16580.9/21906.1 |
| towers | 18877/18503 | 1.250/1.672 | 23596.25/30937.0 |
| rsort | 374484/374344 | 1.083/2.323 | 405566.172/869601.112 |
| qsort | 235998/235665 | 1.421/1.935 | 335353.1/456011.775 |
| multiply | 50024/49663 | 1.565/1.910 | 78287.56/94856.33 |
| median | 16523/16146 | 1.469/1.888 | 24272.287/30483.648 |
| dhrystone | 243390/242303 | 1.323/1.986 | 322004.97/481213.758 |
compared to the full bypass disabled, enabling the full bypass can outperform markedly, in the context of Execution time. And cycles for each instruction is more since there are more stalls in pipeline without bypass.
If adding full bypassing would hurt the cycle time of the processor by 25%, would it be worth it? Argue your case quantitatively.
assuming the count of instruction unchanged, if full bypass increase cycle time by 25%:
vvadd takes 20725, towers takes 29495, rsort takes 506957, qsort takes 419191, multiply takes 97858.7 is slower than interlock, median takes 30340, dhrystone takes 402505.
in general full bypass is worthy of it even when it hurts the cycle time by 25%.
3.7
What percentages of the instruction mix do the various types of load and store instructions make up? Evaluate the new design in terms of the percentage increase in the number of instructions that will have to be executed. Which design would you advise your employer to adopt? Justify your position quantitatively.
the stats is as follow, ordered in vvadd, towers, rsort, qsort, multyply, median, dhrystone
Stats:
CPI : 1.352
IPC : 0.740
Cycles : 16578
Instructions : 12264
Bubbles : 4315
Instruction Breakdown:
% Arithmetic : 47.472 %
% Ld/St : 29.460 %
% Branch/Jump : 21.926 %
% Misc. : 1.142 %
% non_zero_Offset LD : 6.401 %
% non_zero_Offset_ST : 2.177 %
Stats:
CPI : 1.352
IPC : 0.740
Cycles : 16578
Instructions : 12264
Bubbles : 4315
Instruction Breakdown:
% Arithmetic : 47.472 %
% Ld/St : 29.460 %
% Branch/Jump : 21.926 %
% Misc. : 1.142 %
% non_zero_Offset LD : 6.401 %
% non_zero_Offset_ST : 2.177 %
Instruction Count Summary:
Total Instructions : 12264
Total LD/ST Instructions : 3613
Total Arithmetic Instructions: 5822
Total Branch/Jump Instructions: 2689
Total Misc Instructions : 140
Load/Store Offset Details:
Non-zero Offset Load Count : 785
Non-zero Offset Store Count : 267
% of Non-zero Offset Loads : 21.73 %
% of Non-zero Offset Stores : 7.39 %
Stats:
CPI : 1.250
IPC : 0.800
Cycles : 23604
Instructions : 18877
Bubbles : 4728
Instruction Breakdown:
% Arithmetic : 42.544 %
% Ld/St : 41.935 %
% Branch/Jump : 14.780 %
% Misc. : 0.742 %
% non_zero_Offset LD : 16.205 %
% non_zero_Offset_ST : 15.082 %
Stats:
CPI : 1.250
IPC : 0.800
Cycles : 23604
Instructions : 18877
Bubbles : 4728
Instruction Breakdown:
% Arithmetic : 42.544 %
% Ld/St : 41.935 %
% Branch/Jump : 14.780 %
% Misc. : 0.742 %
% non_zero_Offset LD : 16.205 %
% non_zero_Offset_ST : 15.082 %
Instruction Count Summary:
Total Instructions : 18877
Total LD/ST Instructions : 7916
Total Arithmetic Instructions: 8031
Total Branch/Jump Instructions: 2790
Total Misc Instructions : 140
Load/Store Offset Details:
Non-zero Offset Load Count : 3059
Non-zero Offset Store Count : 2847
% of Non-zero Offset Loads : 38.64 %
% of Non-zero Offset Stores : 35.97 %
Stats:
CPI : 1.083
IPC : 0.923
Cycles : 405558
Instructions : 374484
Bubbles : 31075
Instruction Breakdown:
% Arithmetic : 59.661 %
% Ld/St : 34.844 %
% Branch/Jump : 4.340 %
% Misc. : 1.155 %
% non_zero_Offset LD : 8.089 %
% non_zero_Offset_ST : 5.020 %
Stats:
CPI : 1.083
IPC : 0.923
Cycles : 405558
Instructions : 374484
Bubbles : 31075
Instruction Breakdown:
% Arithmetic : 59.661 %
% Ld/St : 34.844 %
% Branch/Jump : 4.340 %
% Misc. : 1.155 %
% non_zero_Offset LD : 8.089 %
% non_zero_Offset_ST : 5.020 %
Instruction Count Summary:
Total Instructions : 374484
Total LD/ST Instructions : 130485
Total Arithmetic Instructions: 223421
Total Branch/Jump Instructions: 16254
Total Misc Instructions : 4324
Load/Store Offset Details:
Non-zero Offset Load Count : 30291
Non-zero Offset Store Count : 18798
% of Non-zero Offset Loads : 23.21 %
% of Non-zero Offset Stores : 14.41 %
Stats:
CPI : 1.421
IPC : 0.704
Cycles : 335258
Instructions : 235998
Bubbles : 99261
Instruction Breakdown:
% Arithmetic : 38.448 %
% Ld/St : 31.403 %
% Branch/Jump : 29.826 %
% Misc. : 0.323 %
% non_zero_Offset LD : 13.212 %
% non_zero_Offset_ST : 4.070 %
Stats:
CPI : 1.421
IPC : 0.704
Cycles : 335258
Instructions : 235998
Bubbles : 99261
Instruction Breakdown:
% Arithmetic : 38.448 %
% Ld/St : 31.403 %
% Branch/Jump : 29.826 %
% Misc. : 0.323 %
% non_zero_Offset LD : 13.212 %
% non_zero_Offset_ST : 4.070 %
Instruction Count Summary:
Total Instructions : 235998
Total LD/ST Instructions : 74111
Total Arithmetic Instructions: 90737
Total Branch/Jump Instructions: 70388
Total Misc Instructions : 762
Load/Store Offset Details:
Non-zero Offset Load Count : 31181
Non-zero Offset Store Count : 9605
% of Non-zero Offset Loads : 42.07 %
% of Non-zero Offset Stores : 12.96 %
Stats:
CPI : 1.565
IPC : 0.639
Cycles : 78291
Instructions : 50024
Bubbles : 28268
Instruction Breakdown:
% Arithmetic : 63.791 %
% Ld/St : 4.238 %
% Branch/Jump : 31.619 %
% Misc. : 0.352 %
% non_zero_Offset LD : 1.255 %
% non_zero_Offset_ST : 0.634 %
Stats:
CPI : 1.565
IPC : 0.639
Cycles : 78291
Instructions : 50024
Bubbles : 28268
Instruction Breakdown:
% Arithmetic : 63.791 %
% Ld/St : 4.238 %
% Branch/Jump : 31.619 %
% Misc. : 0.352 %
% non_zero_Offset LD : 1.255 %
% non_zero_Offset_ST : 0.634 %
Instruction Count Summary:
Total Instructions : 50024
Total LD/ST Instructions : 2120
Total Arithmetic Instructions: 31911
Total Branch/Jump Instructions: 15817
Total Misc Instructions : 176
Load/Store Offset Details:
Non-zero Offset Load Count : 628
Non-zero Offset Store Count : 317
% of Non-zero Offset Loads : 29.62 %
% of Non-zero Offset Stores : 14.95 %
Stats:
CPI : 1.469
IPC : 0.681
Cycles : 24274
Instructions : 16523
Bubbles : 7752
Instruction Breakdown:
% Arithmetic : 32.470 %
% Ld/St : 31.405 %
% Branch/Jump : 35.278 %
% Misc. : 0.847 %
% non_zero_Offset LD : 14.967 %
% non_zero_Offset_ST : 1.568 %
Stats:
CPI : 1.469
IPC : 0.681
Cycles : 24274
Instructions : 16523
Bubbles : 7752
Instruction Breakdown:
% Arithmetic : 32.470 %
% Ld/St : 31.405 %
% Branch/Jump : 35.278 %
% Misc. : 0.847 %
% non_zero_Offset LD : 14.967 %
% non_zero_Offset_ST : 1.568 %
Instruction Count Summary:
Total Instructions : 16523
Total LD/ST Instructions : 5189
Total Arithmetic Instructions: 5365
Total Branch/Jump Instructions: 5829
Total Misc Instructions : 140
Load/Store Offset Details:
Non-zero Offset Load Count : 2473
Non-zero Offset Store Count : 259
% of Non-zero Offset Loads : 47.66 %
% of Non-zero Offset Stores : 4.99 %
Stats:
CPI : 1.323
IPC : 0.756
Cycles : 321955
Instructions : 243390
Bubbles : 78566
Instruction Breakdown:
% Arithmetic : 40.531 %
% Ld/St : 35.198 %
% Branch/Jump : 23.725 %
% Misc. : 0.546 %
% non_zero_Offset LD : 13.805 %
% non_zero_Offset_ST : 10.178 %
Stats:
CPI : 1.323
IPC : 0.756
Cycles : 321955
Instructions : 243390
Bubbles : 78566
Instruction Breakdown:
% Arithmetic : 40.531 %
% Ld/St : 35.198 %
% Branch/Jump : 23.725 %
% Misc. : 0.546 %
% non_zero_Offset LD : 13.805 %
% non_zero_Offset_ST : 10.178 %
Instruction Count Summary:
Total Instructions : 243390
Total LD/ST Instructions : 85668
Total Arithmetic Instructions: 98648
Total Branch/Jump Instructions: 57744
Total Misc Instructions : 1330
Load/Store Offset Details:
Non-zero Offset Load Count : 33600
Non-zero Offset Store Count : 24773
% of Non-zero Offset Loads : 39.22 %
% of Non-zero Offset Stores : 28.92 %
For vvadd benchmark, it has 3613 LD/ST instructions, of which 785+267=1052 is non-zero offset LD/ST instructions. we will have 12264+1052=13316 instructions if taking new design.
Taking new design also lead clock time increased since EX stage and MEM stage are combined, which increase critical path clock time.
Assume the first inst has 5 cycle and then each inst has 1 cycle. taking new design, first inst takes 4 cycle and then each inst takes 1 cycle. in general cycles don't changed much. we assume CPI = cycles/insts will decrease.
Speedup = (inst_old × CPI_old × T_old) / (inst_new × CPI_new × T_new)
= (inst_old x cycles / inst_old x cycle_old) / ((inst_old + 1052) x cycles / (inst_old+1052) x (cycle_old+delta))
where delta is the increase in clock time caused by combined stage.
so, we simplify the formula then get:
Speedup = cycles/(cycles+delta). which is lower than 1. so, i suppose taking new design won't bring in benefits.
本文来自博客园,作者:ijpq,转载请注明原文链接:https://www.cnblogs.com/ijpq/p/17893498.html

 浙公网安备 33010602011771号