
ECharts常用配置
ECharts的一些配置总是记不住,还要再去查官方API,很费时。
把常用的总结一下,比较零散,想到什么就写什么了,以后工作中遇到其他的再补进来。
1 颜色
定义一个数组,柱状图和饼图的颜色就会按这个顺序显示
color:['#1989FA','#91CC75','#EE6666','#FAC858','#EA7CCC','#3BA272','#FC8452']
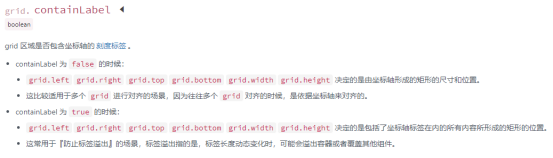
2 图表边距
grid: {
  top: '10%',
  right: '10%',
  bottom: '10%',
  left: '10%',,
  containLabel: true
}
containLabel 设为 true时 ,内容不会溢出
3 坐标轴xAxis和yAxis
xAxis: {
    data:[],

    //类型,'value'数值,'category'类目
    type: 'category',

    //轴线相关设置
    axisLine: {
        lineStyle: {
            //线颜色
            color: "blue"
        }
    },

    //刻度标签相关设置
    axisLabel: {
        textStyle: {
            //文字颜色
            color: 'red'
        },
        //显示间隔
        interval:0,
        //文字倾斜
        rotate:30
    },

    //网格线
    splitLine:{
        show: true,
        lineStyle:{
            //线颜色
            color: "rgba(64,158,255,0.2)",
          //虚线
       type:'dashed'
        }
    },
}
4 柱状图宽度(设置在series中)
series: [{
    barWidth: '30px'
}]
5 柱状图上显示数值(设置在series中)
series: [{
    itemStyle:{
        normal:{
            label:{
                show:true,
                position:'top',
                color:"#409EFF"
            }
        }
    }
}]
6 柱状图渐变色(设置在series中)
series: [{
    itemStyle: {
        normal: {
            color: new echarts.graphic.LinearGradient(
                0, 0, 0, 1,
                [{
                        offset: 0,
                        color: '#FF6C25'
                    },
                    {
                        offset: 1,
                        color: '#ffb025'
                    }
                ]
            )
        }
    }
}]
(横向渐变是将0, 0, 0, 1改成0, 0, 1, 0)
7 tooltip是鼠标放上去显示的数据信息(黑色透明)
8 屏幕变化时重置图表大小
window.addEventListener('resize',function(){
    chat.resize();  //chat是定义的图表对象
});

 浙公网安备 33010602011771号