


使用APICloud设计物联网APP
0、前言
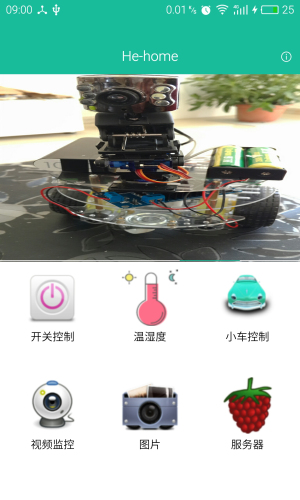
1)、APP功能:
1、控制室内插座的开关。
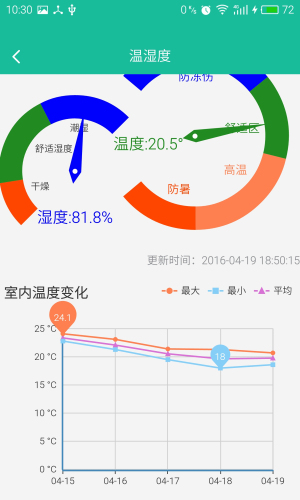
2、查看室内实时温湿度和温湿度趋势。
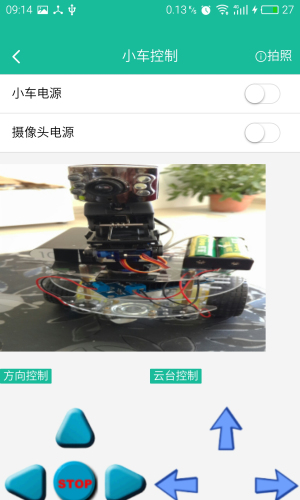
3、控制小车的行走,小车摄像头的开启/关闭、移动。
4、查看摄像头监控画面,可拍照并追溯。
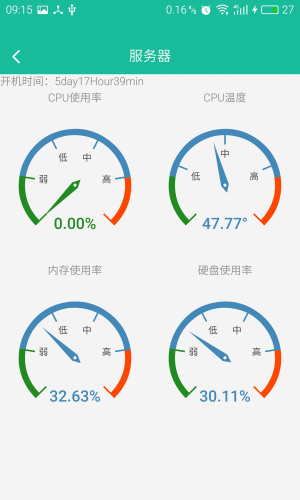
5、查看服务器资源消耗情况。
2)、设计此APP所需基础:
HTML:会使用前端框架。
js:基本语法。
APICloude IDE的使用。
3)、APP演示

1、关
使用标准WEB技术轻松开发iOS、Android原生应用;覆盖APP全生命周期,包括开发、API集成、测试、渠道打包、运营管理等.
2、JSON数据格式处理
服务器返回格式:
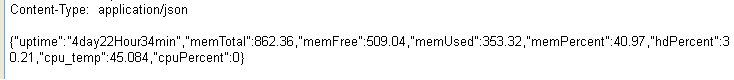
JS获取数据:
$.ajax({
	type : "GET",
	async : false,
	url : "http://api.php",
	data : {},
	dataType : "json", //返回数据形式为json
	success : function(result) {
		if (result) {
			data['uptime'] = result.uptime;
			data['memPercent'] = result.memPercent.toFixed(2);//.toFixed(2)小数点后保留两位
			data['cputemp'] = result.cpu_temp.toFixed(2);
			data['cpuPercent'] = result.cpuPercent.toFixed(2);
			data['hdPercent'] = result.hdPercent.toFixed(2);
		}
		}
	});
3、ECharts图表组件
1)、关于ECharts
商业级数据图表,一个纯Javascript的图表库,可以流畅的运行在PC和移动设备上,提供直观,生动,可交互,可高度个性化定制的数据可视化图表。参考手册:http://echarts.baidu.com/echarts2/doc/doc.html
2)、为ECharts准备一个具备大小(宽高)的Dom
<div id="pi_cpu_Percent_gauge" style="height:200px"></div>
<div id="pi_cpu_temp_gauge" style="height:200px"></div>
<div id="pi_mem_gauge" style="height:200px"></div>
<div id="pi_disk_gauge" style="height:200px"></div>
3)、引入文件echarts.js
<script type="text/javascript" src="../script/echarts-all.js"></script>
4)、<script>标签内动态加载echarts和所需图表
var pi_cpu_Percent_gauge = echarts.init(document.getElementById('pi_cpu_Percent_gauge'));
			var pi_cpu_temp_gauge = echarts.init(document.getElementById('pi_cpu_temp_gauge'));
			var pi_mem_gauge = echarts.init(document.getElementById('pi_mem_gauge'));
			var pi_disk_gauge = echarts.init(document.getElementById('pi_disk_gauge'));
//显示加载图画动画
pi_cpu_Percent_gauge.showLoading();
pi_cpu_temp_gauge.showLoading();
pi_mem_gauge.showLoading();
pi_disk_gauge.showLoading();
//仪表盘图表格式设置,4个图表共用样式
var gauge_option = {
		tooltip : {
		formatter : "{a} <br/>{b} : {c}%"
			},
		series : [{,
			type : 'gauge',
			splitNumber : 5, // 分割段数,默认为5
			axisLine : {// 坐标轴线
			lineStyle : {// 属性lineStyle控制线条样式
			color : [[0.2, '#228b22'], [0.8, '#48b'], [1, '#ff4500']],width : 8}},
			axisTick : {// 坐标轴小标记
			splitNumber : 5, // 每份split细分多少段
			length : 6, // 属性length控制线长
			lineStyle : {// 属性lineStyle控制线条样式
			color : 'auto'
			}
					},
			axisLabel : {// 坐标轴文本标签,详见axis.axisLabel
			show : true,
			formatter : function(v) {
			switch (v+'') {
								case '20':
									return '弱';
								case '40':
									return '低';
								case '60':
									return '中';
								case '80':
									return '高';
								default:
									return '';
							}
						},
						textStyle : {// 其余属性默认使用全局文本样式,详见TEXTSTYLE
							color : '#333'
						}
					},
					splitLine : {// 分隔线
						show : true, // 默认显示,属性show控制显示与否
						length : 20, // 属性length控制线长
						lineStyle : {// 属性lineStyle(详见lineStyle)控制线条样式
							color : 'auto'
						}
					},
					pointer : {
						width : 5
					},
					detail : {
						formatter : '{value}%',
						textStyle : {// 其余属性默认使用全局文本样式,详见TEXTSTYLE
							color : 'auto',
							fontWeight : 'bolder',
							fontSize : 20
						}
					},
					data : [{
						value : data['cpuPercent']
					}]
				}]
			};
//cpu温度图表单位和坐标轴标签更改
			var temp_gauge_option = {
				series : [{
					max : 70,
					min : 30,
					splitNumber : 4,
					axisLabel : {// 坐标轴文本标签,详见axis.axisLabel
						show : true,
						formatter : function(v) {
							switch (v+'') {
								case '40':
									return '低';
								case '50':
									return '中';
								case '60':
									return '高';
								default:
									return '';
							}
						}
					},
					detail : {
						formatter : '{value}°',
					},
					data : [{
						value : data['cputemp']
					}]
				}]
			};
//延时2秒后加载图表
			setTimeout(function() {
				//隐藏加载动画
				pi_cpu_Percent_gauge.hideLoading();
				pi_cpu_temp_gauge.hideLoading();
				pi_mem_gauge.hideLoading();
				pi_disk_gauge.hideLoading();
				//加载图表
				pi_cpu_Percent_gauge.setOption(gauge_option);
				pi_cpu_temp_gauge.setOption(gauge_option);
				pi_mem_gauge.setOption(gauge_option);
				pi_disk_gauge.setOption(gauge_option);
				//更新图表数据
				pi_cpu_Percent_gauge.setOption({
					series : [{
						data : [{
							value : data['cpuPercent']
						}]
					}]
				});
				pi_cpu_temp_gauge.setOption(temp_gauge_option);
				pi_mem_gauge.setOption({
					series : [{
						data : [{
							value : data['memPercent']
						}]
					}]
				});
				pi_disk_gauge.setOption({
					series : [{
						data : [{
							value : data['hdPercent']
						}]
					}]
				});
			}, 2000);

 浙公网安备 33010602011771号