Python网络爬虫——爬取哔哩哔哩网站原创视频以及其动漫视频
一、选题的背景
为什么要选择此选题?要达到的数据分析的预期目标是什么?(10 分)从社会、经济、技术、数据来源等方面进行描述(200 字以内)
选题原因:爬虫是指一段自动抓取互联网信息的程序,从互联网上抓取对于我们有价值的信息。选择此题正是因为随着信息化的发展,大数据时代对信息的采需求和集量越来越大,相应的处理量也越来越大,正是因为如此,爬虫相应的岗位也开始增多,因此,学好这门课也是为将来就业打下扎实的基础。B站在当今众多视频网站中,相对于年轻化较有爬取价值,可以进一步了解现阶段年轻人的观看喜好。
预期目标:熟悉地掌握爬取网页信息,将储存地信息进行清洗、查重并处理,并对其进行持久性可更新性地储存,然后对数据进行简单的可视化处理,最后再假设根据客户需求,提供快捷方便的相应的数据。
二、主题式网络爬虫设计方案(10 分)
1.主题式网络爬虫名称
爬取B站原创视频以及其动漫视频相关信息并反馈处理的程序
2.主题式网络爬虫爬取的内容与数据特征分析
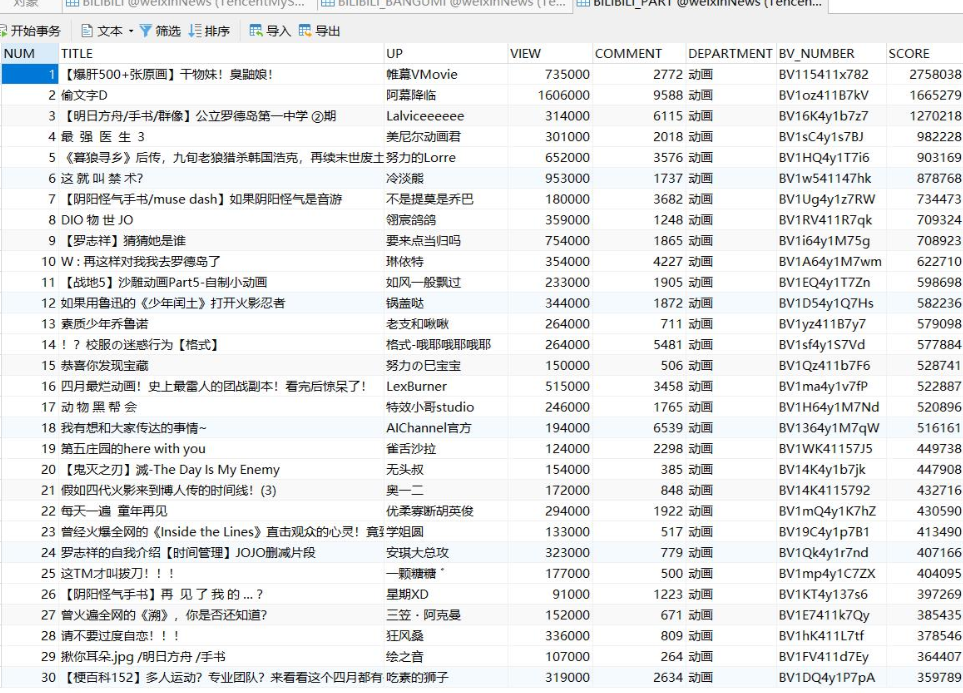
内容:B站热门原创视频排名(视频标题、排名、播放量、弹幕量、作者网络名称、视频播放地址、作者空间地址);B站热门动漫的排名(排名,动漫标题,播放量,弹幕量,更新至集数,动漫播放地址)
数据特征分析:对前十名的视频进行制作柱状图(视频标题与播放量,视频排名与弹幕量,动漫标题与播放量,动漫排名与弹幕量)
3.主题式网络爬虫设计方案概述(包括实现思路与技术难点)
实现思路:
1.网络爬虫爬取B站的内容与数据进行分析
2.数据清洗和统计
3.mysql数据库的数据储存
技术难点:网页各信息上的标签属性查找,def自定义函数的建立,对存储至csv文件的数据进行清理查重,并且对其特点数据进行数据整数化(如:排名,播放量,弹幕量),对网址进行添加删除(如:添加“https://”,删除多余的“//”),机器学习sklearn库的学习与调用,selenium库的学习与调用。
三、主题页面的结构特征分析(10 分)
本次爬取两个同网址不同排行榜的主题页面(B站的原创视频排行榜、B站的动漫排行榜)的URL,分别为:“https://www.bilibili.com/v/popular/rank/all”与“https://www.bilibili.com/v/popular/rank/bangumi”。
Schema : https
Host : www.bilibili.com
Path : /v/popular/rank/all
/v/popular/rank/bangumi
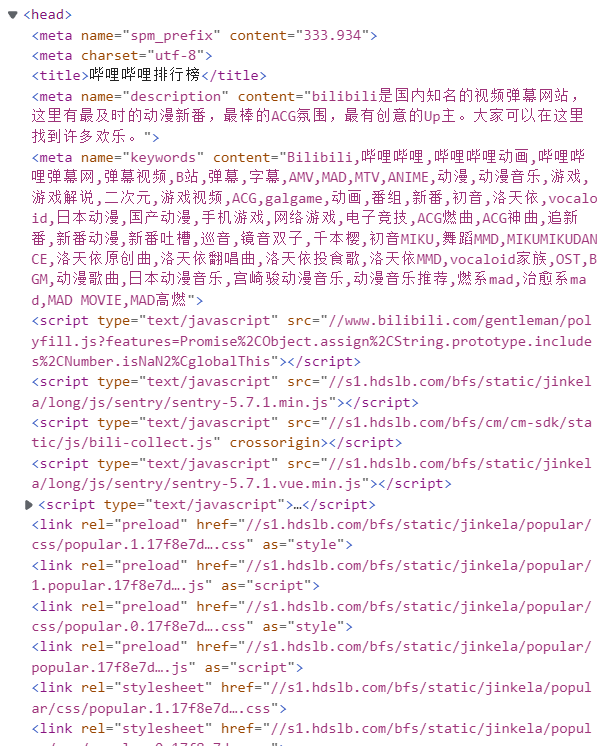
主题页面组成为:<html>
<head>...</head>
<body class="header-v2">...<body>
<html>
B站的原创视频排行榜和B站的动漫排行榜的<head>标签中包含了<mate><title><script><link><style>五种标签,这些标签定义文档的头部,它是所有头部元素的容器。(附图)
1.Htmls 页面解析
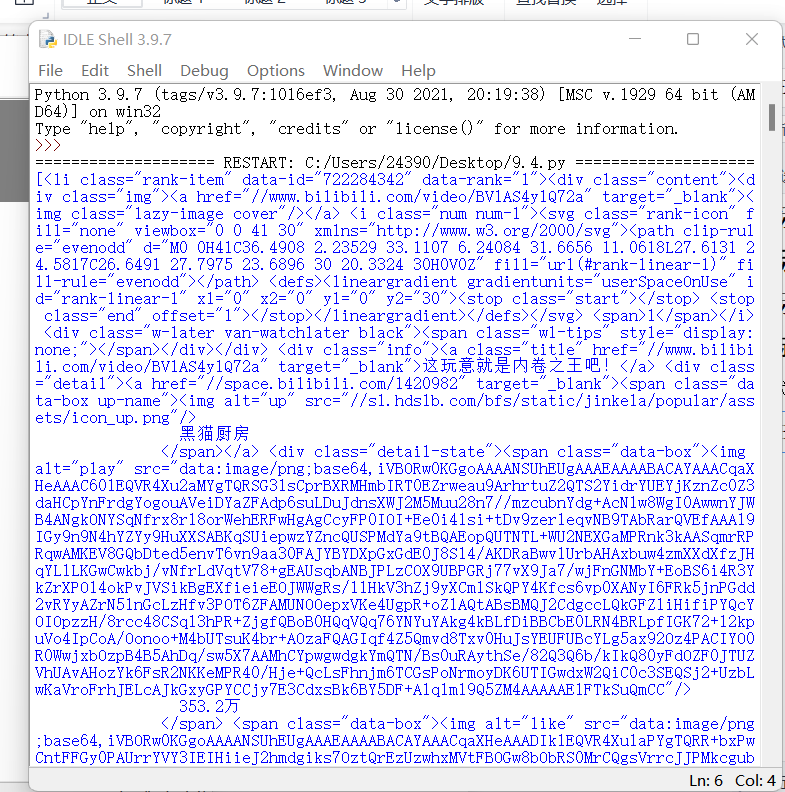
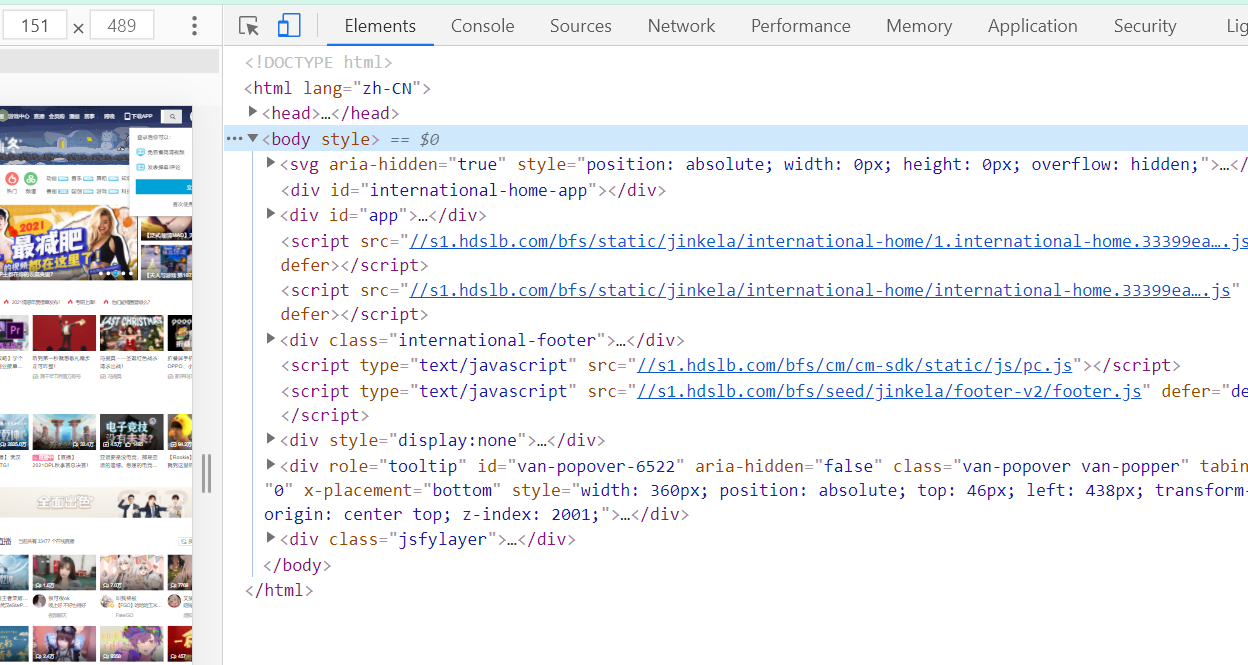
本次课程设计主要是对<body>部分进行解析,<body>中存在<svg><div><script><style>四种标签,经过定位,确定要爬取的数据位于<div id=”app”>的<li ...class=”rank-item”>标签中。
以下为爬取<li ...class=”rank-item”>标签中所有信息的代码:
import requests
from bs4 import BeautifulSoup
url = 'https://www.bilibili.com/v/popular/rank/all'
bdata = requests.get(url).text
soup = BeautifulSoup(bdata,'html.parser')
items = soup.findAll('li',{'class':'rank-item'})#提取列表
print(items)
1.节点(标签)的查找方法与遍历方法(必要时画出节点树结构)
import requests
from bs4 import BeautifulSoup
r=requests.get('https://www.bilibili.com/v/popular/rank/all')
demo=r.text
soup=BeautifulSoup(demo,'html.parser')
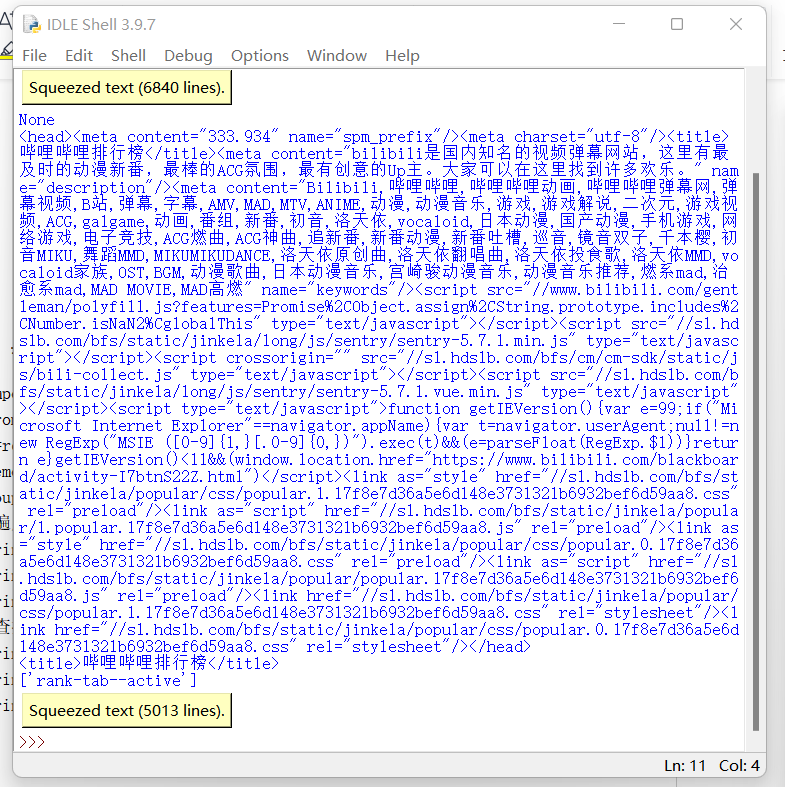
#遍历方法:
print(soup.contents)# 获取整个标签树的儿子节点
print(soup.body.content)#返回标签树的body标签下的节点
print(soup.head)#返回head标签
#查找方法:
print(soup.title)#查找标签,这里查找了title标签
print(soup.li['class'])#根据标签名查找某属性,这里查找了li标签下的class
print(soup.find_all('li'))#根据标签名查找元素,这里查找了li标签下的所有代码
节点树结构图:

二、 网络爬虫程序设计(60分)
爬虫程序主体要包括以下各部分,要附源代码及较详细注释,并在每部分程序后面提供输出结果的截图。
1.数据爬取与采集
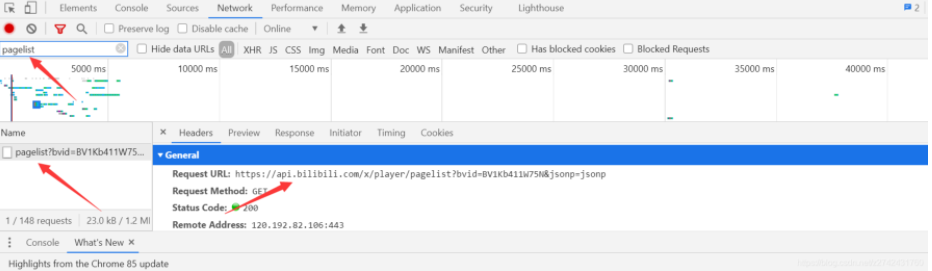
①bvid网址获取
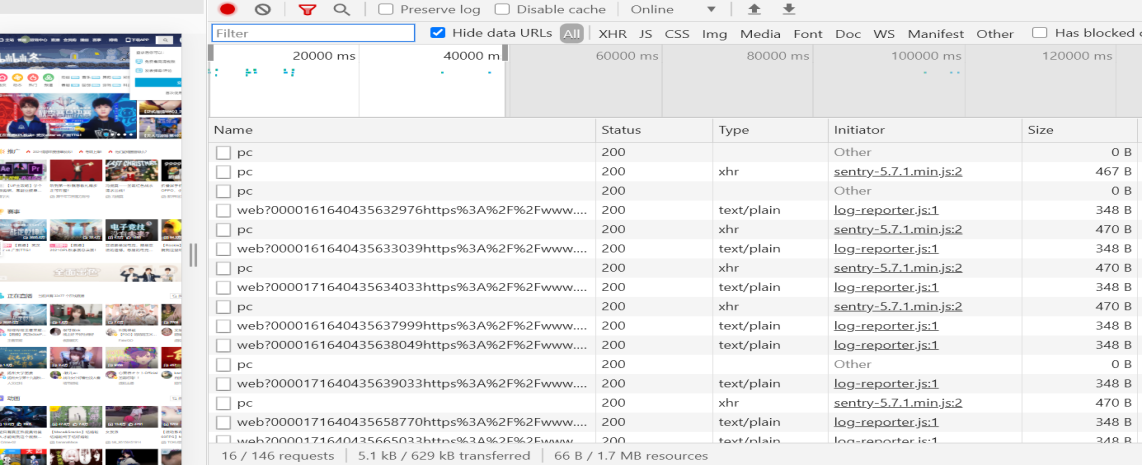
②aid的获取
③爬取界面
  1 #导入数据库
  2
  3 import requests
  4
  5 from bs4 import BeautifulSoup
  6
  7 import csv
  8
  9 import datetime
 10
 11 import pandas as pd
 12
 13 import numpy as np
 14
 15 from matplotlib import rcParams
 16
 17 import matplotlib.pyplot as plt
 18
 19 import matplotlib.font_manager as font_manager
 20
 21 from selenium import webdriver
 22
 23 from time import sleep
 24
 25 import matplotlib
 26
 27 url = 'https://www.bilibili.com/v/popular/rank/all'
 28
 29 #发起网络请求
 30
 31 response = requests.get(url)
 32
 33 html_text = response.text
 34
 35 soup = BeautifulSoup(html_text,'html.parser')
 36
 37 #创建Video对象
 38
 39 class Video:
 40
 41     def __init__(self,rank,title,visit,barrage,up_id,url,space):
 42
 43         self.rank = rank
 44
 45         self.title = title
 46
 47         self.visit = visit
 48
 49         self.barrage = barrage
 50
 51         self.up_id = up_id
 52
 53         self.url = url
 54
 55         self.space = space
 56
 57     def to_csv(self):
 58
 59         return[self.rank,self.title,self.visit,self.barrage,self.up_id,self.url,self.space]
 60
 61     @staticmethod
 62
 63     def csv_title():
 64
 65         return ['排名','标题','播放量','弹幕量','Up_ID','URL','作者空间']
 66
 67 #提取列表
 68
 69 items = soup.findAll('li',{'class':'rank-item'})
 70
 71 #保存提取出来的Video列表
 72
 73 videos = []
 74
 75 for itm in items:
 76
 77     title = itm.find('a',{'class':'title'}).text #视频标题
 78
 79     rank = itm.find('i',{'class':'num'}).text #排名
 80
 81     visit = itm.find_all('span')[3].text #播放量
 82
 83     barrage = itm.find_all('span')[4].text #弹幕量
 84
 85     up_id = itm.find('span',{'class':'data-box up-name'}).text #作者id
 86
 87     url = itm.find_all('a')[1].get('href')#获取视频网址
 88
 89     space = itm.find_all('a')[2].get('href')#获取作者空间网址
 90
 91     v = Video(rank,title,visit,barrage,up_id,url,space)
 92
 93     videos.append(v)
 94
 95 #建立时间后缀
 96
 97 now_str = datetime.datetime.now().strftime('%Y%m%d_%H%M%S')
 98
 99 #建立文件名称以及属性
100
101 file_name1 = f'哔哩哔哩视频top100_{now_str}.csv'
102
103 #写入数据到文件中,并存储
104
105 with open(file_name1,'w',newline='',encoding='utf-8') as f:
106
107     writer = csv.writer(f)
108
109     writer.writerow(Video.csv_title())
110
111     for v in videos:
112
113         writer.writerow(v.to_csv())
114
115 url = 'https://www.bilibili.com/v/popular/rank/bangumi'
116
117 #发起网络请求
118
119 response = requests.get(url)
120
121 html_text = response.text
122
123 soup = BeautifulSoup(html_text,'html.parser')
124
125 #创建Video对象
126
127 class Video:
128
129     def __init__(self,rank,title,visit,barrage,new_word,url):
130
131         self.rank = rank
132
133         self.title = title
134
135         self.visit = visit
136
137         self.barrage = barrage
138
139         self.new_word = new_word
140
141         self.url = url
142
143     def to_csv(self):
144
145         return[self.rank,self.title,self.visit,self.barrage,self.new_word,self.url]
146
147     @staticmethod
148
149     def csv_title():
150
151         return ['排名','标题','播放量','弹幕量','更新话数至','URL']
152
153 #提取列表
154
155 items = soup.findAll('li',{'class':'rank-item'})
156
157 #保存提取出来的Video列表
158
159 videos = []
160
161 for itm in items:
162
163     rank = itm.find('i',{'class':'num'}).text #排名
164
165     title = itm.find('a',{'class':'title'}).text #视频标题
166
167     url = itm.find_all('a')[0].get('href')#获取视频网址
168
169     visit = itm.find_all('span')[2].text #播放量
170
171     barrage = itm.find_all('span')[3].text #弹幕量
172
173     new_word = itm.find('span',{'class':'data-box'}).text#更新话数
174
175     v = Video(rank,title,visit,barrage,new_word,url)
176
177     videos.append(v)
178
179 #建立时间后缀
180
181 now_str = datetime.datetime.now().strftime('%Y%m%d_%H%M%S')
182
183 #建立文件名称以及属性
184
185 file_name2 = f'哔哩哔哩番剧top50_{now_str}.csv'
186
187 #写入数据到文件中,并存储
188
189 with open(file_name2,'w',newline='',encoding='utf-8') as f:
190
191     writer = csv.writer(f)
192
193     writer.writerow(Video.csv_title())
194
195     for v in videos:
196
197         writer.writerow(v.to_csv())

④清洗数据
 1 #导入数据库
 2
 3 import pandas as pd
 4
 5 file_name1 = f'哔哩哔哩视频top100_20211215_154744.csv'
 6
 7 file_name2 = f'哔哩哔哩番剧top50_20211215_154745.csv'
 8
 9 paiming1 = pd.DataFrame(pd.read_csv(file_name1,encoding="utf_8_sig"))#对数据进行清洗和处理
10
11 paiming2 = pd.DataFrame(pd.read_csv(file_name2,encoding="utf_8_sig"))
12
13 print(paiming1.head())
14
15 print(paiming2.head())
16
17 #查找重复值
18
19 print(paiming1.duplicated())
20
21 print(paiming2.duplicated())
22
23 #查找空值与缺失值
24
25 print(paiming1['标题'].isnull().value_counts())
26
27 print(paiming2['标题'].isnull().value_counts())
28
29 print(paiming1['URL'].isnull().value_counts())
30
31 print(paiming2['URL'].isnull().value_counts())
32
33 print(paiming1['播放量'].isnull().value_counts())
34
35 print(paiming2['播放量'].isnull().value_counts())
36
37 print(paiming1['弹幕量'].isnull().value_counts())
38
39 print(paiming2['弹幕量'].isnull().value_counts())
2.储存至mysql数据库当中
①爬取网站
 1 # 爬取B站日榜新闻
 2
 3 def BilibiliNews():
 4
 5     newsList=[]
 6
 7     # 伪装标头
 8
 9     headers={'User-Agent': 'Mozilla/5.0 (Windows NT 10.0; Win64; x64) AppleWebKit/537.36 (KHTML, like Gecko) Chrome/81.0.4044.122 Safari/537.36'}
10
11     res=requests.get('https://www.bilibili.com/ranking/all/0/0/3',headers=headers) # 请求网页
12
13     soup = BeautifulSoup(res.text,'html.parser')  # 解析网页
14
15     result=soup.find_all(class_='rank-item')  # 找到榜单所在标签
16
17     num=0
18
19     startTime=time.strftime("%Y-%m-%d", time.localtime())  # 记录爬取的事件
20
21     for i in result:
22
23         try:
24
25             num=int(i.find(class_='num').text)  # 当前排名
26
27             con=i.find(class_='content')
28
29             title=con.find(class_='title').text  # 标题
30
31             detail=con.find(class_='detail').find_all(class_='data-box')
32
33             play=detail[0].text  # 播放量
34
35             view=detail[1].text  # 弹幕量
36
37             # 由于这两者存在类似15.5万的数据情况,所以为了保存方便将他们同义转换为整型
38
39             if(play[-1]=='万'):
40
41                 play=int(float(play[:-1])*10000)
42
43             if(view[-1]=='万'):
44
45                 view=int(float(view[:-1])*10000)
46
47             # 以下为预防部分数据不显示的情况
48
49             if(view=='--'):
50
51                 view=0
52
53             if(play=='--'):
54
55                 play=0
56
57             author=detail[2].text  # UP主
58
59
60
61             url=con.find(class_='title')['href']  # 获取视频链接
62
63             BV=re.findall(r'https://www.bilibili.com/video/(.*)', url)[0]  # 通过正则表达式解析得到视频的BV号
64
65             pts=int(con.find(class_='pts').find('div').text)   # 视频综合得分
66
67             newsList.append([num,title,author,play,view,BV,pts,startTime])  # 将数据插入列表中
68
69         except:
70
71             continue
72
73 return newsList  # 返回数据信息列表

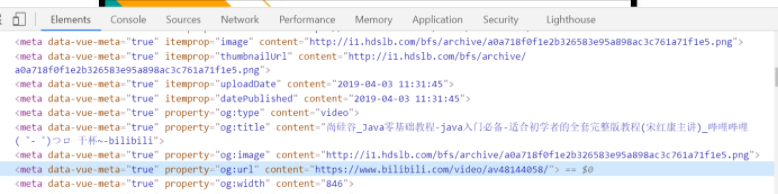
②数据库的创建
 1 mysql> create table BILIBILI(
 2
 3     -> NUM INT,
 4
 5     -> TITLE CHAR(80),
 6
 7     -> UP CHAR(20),
 8
 9     -> VIEW INT,
10
11     -> COMMENT INT,
12
13     -> BV_NUMBER INT,
14
15     -> SCORE INT,
16
17     -> EXECUTION_TIME DATETIME);

③将数据插入MySQL中
 1 def GetMessageInMySQL():
 2
 3     # 连接数据库
 4
 5     db = pymysql.connect(host="cdb-cdjhisi3hih.cd.tencentcdb.com",port=10056,user="root",password="xxxxxx",database="weixinNews",charset='utf8')
 6
 7     cursor = db.cursor()  # 创建游标
 8
 9     news=getHotNews()  # 调用getHotNews()方法获取热搜榜数据内容
10
11     sql = "INSERT INTO WEIBO(NUMBER_SERIAL,TITLE, ATTENTION,EXECUTION_TIME) VALUES (%s,%s,%s,%s)"  # 插入语句
12
13     timebegin=time.strftime("%Y-%m-%d %H:%M:%S", time.localtime())  # 记录开始事件,便于查找错误发生情况
14
15     try:
16
17         # 执行sql语句,executemany用于批量插入数据
18
19         cursor.executemany(sql, news)
20
21         # 提交到数据库执行
22
23         db.commit()
24
25         print(timebegin+"成功!")
26
27     except :
28
29         # 如果发生错误则回滚
30
31         db.rollback()
32
33         print(timebegin+"失败!")
34
35     # 关闭游标
36
37     cursor.close()
38
39     # 关闭数据库连接
40
41     db.close()
④利用schedule实现定时爬取
 1 # 记录程序运行事件
 2
 3 time1=time.strftime("%Y-%m-%d %H:%M:%S", time.localtime())
 4
 5 print("开始爬取信息,程序正常执行:"+time1)
 6
 7 # 每20分钟执行一次程序
 8
 9 schedule.every(20).minutes.do(startFunction)
10
11 # 检查部署的情况,如果任务准备就绪,就开始执行任务
12
13 while True:
14
15     schedule.run_pending()
16
17     time.sleep(1)

3.flask开发服务器端
①jieba提词和echarts wordcloud
 1 from collections import Counter
 2 from pyecharts import WordCloud
 3 import jieba.analyse
 4 # 将counter拆分成两个list
 5 def counter2list(counter):
 6     keyList,valueList = [],[]
 7     for c in counter:
 8         keyList.append(c[0])
 9         valueList.append(c[1])
10     return keyList,valueList
11 # 使用jieba提取关键词并计算权重
12 def extractTag(content,tagsList):
13     keyList,valueList = [],[]
14     if content:
15         tags = jieba.analyse.extract_tags(content, topK=100, withWeight=True)
16         for tex, widget in tags:
17             tagsList[tex] += int(widget*10000)
18
19 def drawWorldCloud(content,count):
20     outputFile = './测试词云.html'
21     cloud = WordCloud('词云图', width=1000, height=600, title_pos='center')
22     cloud.add(
23         ' ',content,count,
24         shape='circle',
25         background_color='white',
26         max_words=200
27     )
28     cloud.render(outputFile)
29 if __name__ == '__main__':
30     c = Counter()   #建一个容器
31     filePath = './新建文本文档.txt'   #分析的文档路径
32     with open(filePath) as file_object:
33         contents = file_object.read()
34         extractTag(contents, c)
35     contentList,countList = counter2list(c.most_common(200))
36     drawWorldCloud(contentList, countList)

②flask接受请求的参数
1 username = request.form.get("username")
2 password = request.form.get("password", type=str, default=None)
3 cpuCount = request.form.get("cpuCount", type=int, default=None)
4 memorySize = request.form.get("memorySize", type=int, default=None)

③BV爬取
  1 # _*_ coding: utf-8 _*_
  2
  3 from urllib.request import urlopen, Request
  4
  5 from http.client import HTTPResponse
  6
  7 from bs4 import BeautifulSoup
  8
  9 import gzip
 10
 11 import json
 12
 13 def get_all_comments_by_bv(bv: str, time_order=False) -> tuple:
 14
 15     """
 16
 17     根据哔哩哔哩的BV号,返回对应视频的评论列表(包括评论下面的回复)
 18
 19     :param bv: 视频的BV号
 20
 21     :param time_order: 是否需要以时间顺序返回评论,默认按照热度返回
 22
 23     :return: 包含三个成员的元组,第一个是所有评论的列表(评论的评论按原始的方式组合其中,字典类型)
 24
 25              第二个是视频的AV号(字符串类型),第三个是统计到的实际评论数(包括评论的评论)
 26
 27     """
 28
 29     video_url = 'https://www.bilibili.com/video/' + bv
 30
 31     headers = {
 32
 33         'Host': 'www.bilibili.com',
 34
 35         'User-Agent': 'Mozilla/5.0 (Windows NT 10.0; Win64; x64; rv:74.0) Gecko/20100101 Firefox/74.0',
 36
 37         'Accept': 'text/html,application/xhtml+xml,application/xml;q=0.9,image/webp,*/*;q=0.8',
 38
 39         'Accept-Language': 'zh-CN,zh;q=0.8,zh-TW;q=0.7,zh-HK;q=0.5,en-US;q=0.3,en;q=0.2',
 40
 41         'Accept-Encoding': 'gzip, deflate, br',
 42
 43         'Connection': 'keep-alive',
 44
 45         'Cookie': '',
 46
 47         'Upgrade-Insecure-Requests': '1',
 48
 49         'Cache-Control': 'max-age=0',
 50
 51         'TE': 'Trailers',
 52
 53     }
 54
 55     rep = Request(url=video_url, headers=headers)  # 获取页面
 56
 57     html_response = urlopen(rep)  # type: HTTPResponse
 58
 59     html_content = gzip.decompress(html_response.read()).decode(encoding='utf-8')
 60
 61     bs = BeautifulSoup(markup=html_content, features='html.parser')
 62
 63     comment_meta = bs.find(name='meta', attrs={'itemprop': 'commentCount'})
 64
 65     av_meta = bs.find(name='meta', attrs={'property': 'og:url'})
 66
 67     comment_count = int(comment_meta.attrs['content'])  # 评论总数
 68
 69     av_number = av_meta.attrs['content'].split('av')[-1][:-1]  # AV号
 70
 71     print(f'视频 {bv} 的AV号是 {av_number} ,元数据中显示本视频共有 {comment_count} 条评论(包括评论的评论)。')
 72
 73
 74
 75     page_num = 1
 76
 77     replies_count = 0
 78
 79     res = []
 80
 81     while True:
 82
 83         # 按时间排序:type=1&sort=0
 84
 85         # 按热度排序:type=1&sort=2
 86
 87         comment_url = f'https://api.bilibili.com/x/v2/reply?pn={page_num}&type=1&oid={av_number}' + \
 88
 89                       f'&sort={0 if time_order else 2}'
 90
 91         comment_response = urlopen(comment_url)  # type: HTTPResponse
 92
 93         comments = json.loads(comment_response.read().decode('utf-8'))  # type: dict
 94
 95         comments = comments.get('data').get('replies')  # type: list
 96
 97         if comments is None:
 98
 99             break
100
101         replies_count += len(comments)
102
103         for c in comments:  # type: dict
104
105             if c.get('replies'):
106
107                 rp_id = c.get('rpid')
108
109                 rp_num = 10
110
111                 rp_page = 1
112
113                 while True:  # 获取评论下的回复
114
115                     reply_url = f'https://api.bilibili.com/x/v2/reply/reply?' +
116
117                                 f'type=1&pn={rp_page}&oid={av_number}&ps={rp_num}&root={rp_id}'
118
119                     reply_response = urlopen(reply_url)  # type: HTTPResponse
120
121                     reply_reply = json.loads(reply_response.read().decode('utf-8'))  # type: dict
122
123                     reply_reply = reply_reply.get('data').get('replies')  # type: dict
124
125                     if reply_reply is None:
126
127                         break
128
129                     replies_count += len(reply_reply)
130
131                     for r in reply_reply:  # type: dict
132
133                         res.append(r)
134
135                     if len(reply_reply) < rp_num:
136
137                         break
138
139                     rp_page += 1
140
141                 c.pop('replies')
142
143                 res.append(c)
144
145         if replies_count >= comment_count:
146
147             break
148
149         page_num += 1
150
151
152
153     print(f'实际获取视频 {bv} 的评论总共 {replies_count} 条。')
154
155     return res, av_number, replies_count
156
157 if __name__ == '__main__':
158
159     cts, av, cnt = get_all_comments_by_bv('BV1op4y1X7N2')
160
161     for i in cts:
162
163         print(i.get('content').get('message'))

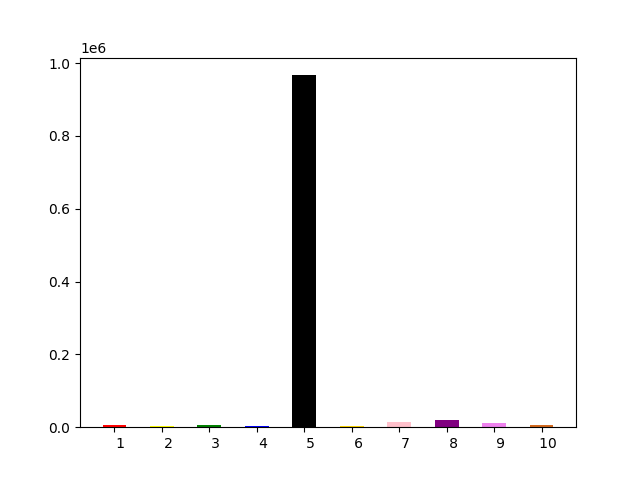
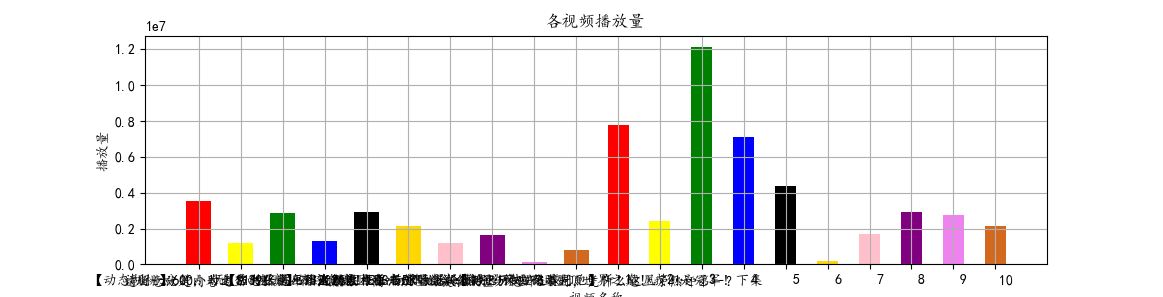
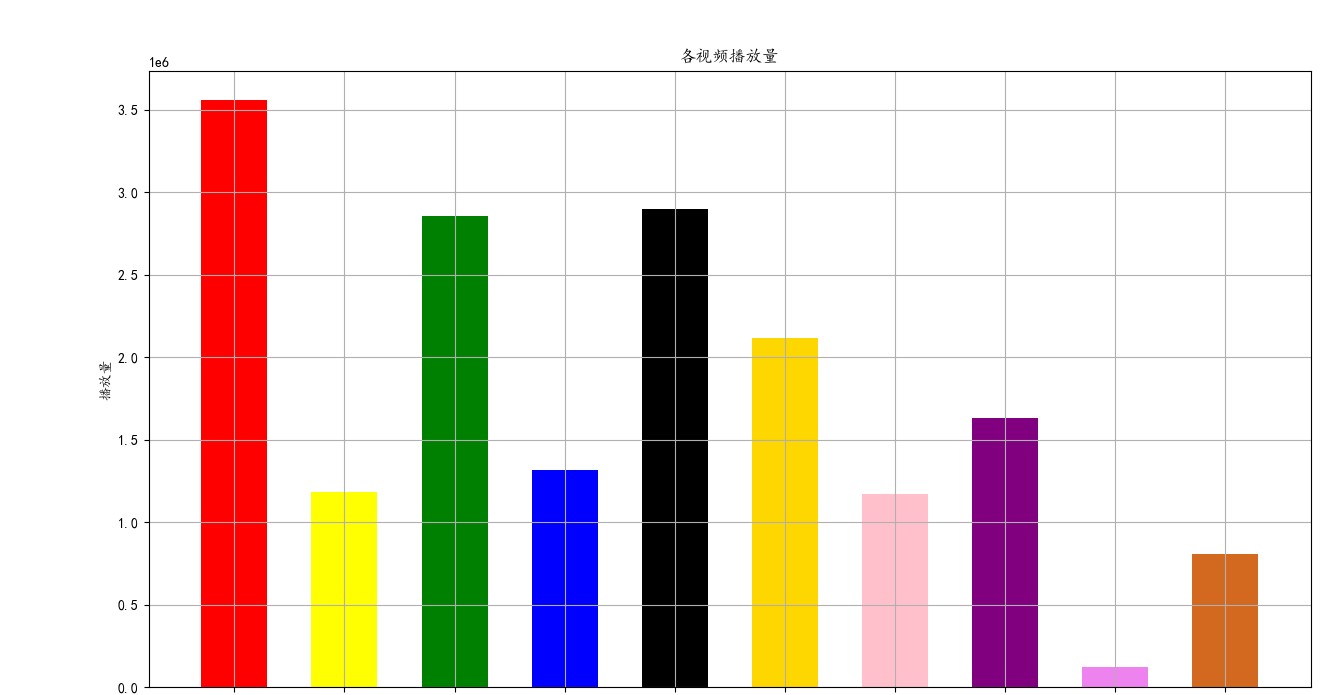
2.数据分析可视化(例如:数据柱形图、直方图、散点图、盒图、分布图)
  1 #数据分析以及可视化
  2
  3 filename1 = file_name1
  4
  5 filename2 = file_name2
  6
  7 with open(filename1,encoding="utf_8_sig") as f1:
  8
  9     #创建阅读器(调用csv.reader()将前面存储的文件对象最为实参传给它)
 10
 11     reader1 = csv.reader(f1)
 12
 13     #调用了next()一次,所以这边只调用了文件的第一行,并将头文件存储在header_row中
 14
 15     header_row1 = next(reader1)
 16
 17     print(header_row1)
 18
 19     #指出每个头文件的索引
 20
 21     for index,column_header in enumerate(header_row1):
 22
 23         print(index,column_header)
 24
 25     #建立空列表
 26
 27     title1 = []
 28
 29     rank1 = []
 30
 31     highs1=[]
 32
 33     url1 = []
 34
 35     visit1 = []
 36
 37     space1 = []
 38
 39     up_id1 = []
 40
 41     for row in reader1:
 42
 43         rank1.append(row[0])
 44
 45         title1.append(row[1])
 46
 47         visit1.append(row[2].strip('\n').strip(' ').strip('\n'))
 48
 49         highs1.append(row[3].strip('\n').strip(' ').strip('\n'))
 50
 51         up_id1.append(row[4].strip('\n').strip(' ').strip('\n'))
 52
 53         url1.append(row[5].strip('\n').strip(' ').strip('\n').strip('//'))
 54
 55         space1.append(row[6].strip('\n').strip(' ').strip('\n').strip('//'))
 56
 57     visit1 = str(visit1)
 58
 59     visit1 = visit1.replace('万', '000')
 60
 61     visit1 = visit1.replace('.', '')
 62
 63     visit1 = eval(visit1)
 64
 65     visit_list_new1 = list(map(int, visit1))
 66
 67     highs1 = str(highs1)
 68
 69     highs1 = highs1.replace('万', '000')
 70
 71     highs1 = highs1.replace('.', '')
 72
 73     highs1 = eval(highs1)
 74
 75     highs_list_new1 = list(map(int, highs1))
 76
 77     print(highs_list_new1)
 78
 79 #设置x轴数据
 80
 81 x=np.array(rank1[0:10])
 82
 83 #设置y轴数据
 84
 85 y=np.array(highs_list_new1[0:10])
 86
 87 # 绘制柱状图,并把每根柱子的颜色设置自己的喜欢的颜色,顺便设置每根柱子的宽度
 88
 89 plt.bar(x,y,color =  ["red","yellow","green","blue","black","gold","pink","purple","violet","Chocolate"],width = 0.5)
 90
 91 plt.show()
 92
 93 #设置x轴数据
 94
 95 x=np.array(title1[0:10])
 96
 97 #设置y轴数据
 98
 99 y=np.array(visit_list_new1[0:10])
100
101 # 绘制柱状图,并把每根柱子的颜色设置自己的喜欢的颜色,顺便设置每根柱子的宽度
102
103 plt.bar(x,y,color =  ["red","yellow","green","blue","black","gold","pink","purple","violet","Chocolate"],width = 0.5)
104
105 matplotlib.rcParams['font.sans-serif'] = ['KaiTi']
106
107 plt.show()
108
109 #定义画布的大小
110
111 fig = plt.figure(figsize = (15,8))
112
113 #添加主标题
114
115 plt.title("各视频播放量")
116
117 #设置X周与Y周的标题
118
119 plt.xlabel("视频名称")
120
121 plt.ylabel("播放量")
122
123 # 显示网格线
124
125 plt.grid(True)
126
127 #设置x轴数据
128
129 x=np.array(title1[0:10])
130
131 #设置y轴数据
132
133 y=np.array(visit_list_new1[0:10])
134
135 #绘制柱状图,并把每根柱子的颜色设置自己的喜欢的颜色,顺便设置每根柱子的宽度
136
137 plt.bar(x,y,color = ["red","yellow","green","blue","black","gold","pink","purple","violet","Chocolate"],width = 0.6)
138
139 #图片保存
140
141 plt.savefig(r"C:\Users\24390\Desktop\bilibili-up-v.png")
142
143 with open(filename2,encoding="utf_8_sig") as f2:
144
145     reader2 = csv.reader(f2)
146
147     header_row2 = next(reader2)
148
149     print(header_row2)
150
151     for index,column_header in enumerate(header_row2):
152
153         print(index,column_header)
154
155     rank2 = []
156
157     title2 = []
158
159     highs2 = []
160
161     url2 = []
162
163     visit2 = []
164
165     new_word2 = []
166
167     for row in reader2:
168
169         rank2.append(row[0])
170
171         title2.append(row[1])
172
173         visit2.append(row[2].strip('\n').strip(' ').strip('\n'))
174
175         highs2.append(row[3].strip('\n').strip(' ').strip('\n'))
176
177         new_word2.append(row[4])
178
179         url2.append(row[5].strip('\n').strip(' ').strip('\n').strip('//'))
180
181     print(highs2)
182
183     title2 = str(title2)
184
185     title2 = eval(title2)
186
187     visit2 = str(visit2)
188
189     visit2 = visit2.replace('万', '000')
190
191     visit2 = visit2.replace('亿', '0000000')
192
193     visit2 = visit2.replace('.', '')
194
195     visit2 = eval(visit2)
196
197     visit2 = list(map(int, visit2))
198
199     visit_list_new2 = list(map(int, visit2))
200
201     highs2 = str(highs2)
202
203     highs2 = highs2.replace('万', '000')
204
205     highs2 = highs2.replace('.', '')
206
207     highs2 = eval(highs2)
208
209     highs_list_new2 = list(map(int, highs2))
210
211     print(highs_list_new2)
212
213 #设置x轴数据
214
215 x=np.array(rank2[0:10])
216
217 #设置y轴数据
218
219 y=np.array(highs_list_new2[0:10])
220
221 # 绘制柱状图,并把每根柱子的颜色设置自己的喜欢的颜色,顺便设置每根柱子的宽度
222
223 plt.bar(x,y,color =  ["red","yellow","green","blue","black","gold","pink","purple","violet","Chocolate"],width = 0.5)
224
225 plt.show()
226
227 #设置x轴数据
228
229 x=np.array(title2[0:10])
230
231 #设置y轴数据
232
233 y=np.array(visit_list_new2[0:10])
234
235 # 绘制柱状图,并把每根柱子的颜色设置自己的喜欢的颜色,顺便设置每根柱子的宽度
236
237 plt.bar(x,y,color =  ["red","yellow","green","blue","black","gold","pink","purple","violet","Chocolate"],width = 0.5)
238
239 matplotlib.rcParams['font.sans-serif'] = ['KaiTi']
240
241 plt.show()
242
243 # 定义画布的大小
244
245 fig = plt.figure(figsize = (15,8))
246
247 #添加主标题
248
249 plt.title("番剧播放量")
250
251 #设置X周与Y周的标题
252
253 plt.xlabel("番剧名称")
254
255 plt.ylabel("播放量")
256
257 # 显示网格线
258
259 plt.grid(True)
260
261 #设置x轴数据
262
263 x=np.array(title2[0:10])
264
265 #设置y轴数据
266
267 y=np.array(visit_list_new2[0:10])
268
269 # 绘制柱状图,并把每根柱子的颜色设置自己的喜欢的颜色,顺便设置每根柱子的宽度
270
271 plt.bar(x,y,color = ["red","yellow","green","blue","black","gold","pink","purple","violet","Chocolate"],width = 0.6)
272
273 #图片保存
274
275 plt.savefig(r"C:\Users\24390\Desktop\bilibili-draw-v.png")
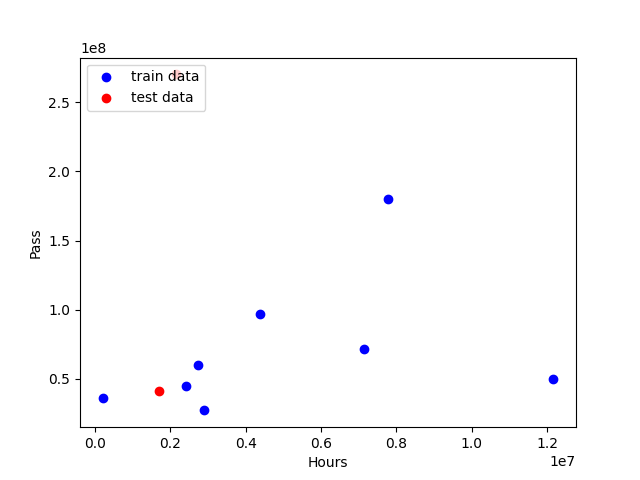
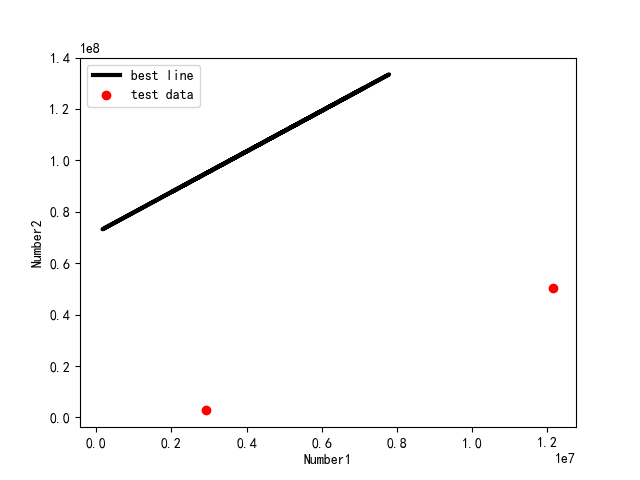
3.根据数据之间的关系,分析两个变量之间的相关系数,画出散点图,并建立变量之间的回归方程(一元或多元)。
  1 import pandas as pd
  2
  3 import numpy as np
  4
  5 import matplotlib.pyplot as plt
  6
  7 from pandas import DataFrame,Series
  8
  9 from sklearn.model_selection import train_test_split
 10
 11 from sklearn.linear_model import LinearRegression
 12
 13 import csv
 14
 15 file_name2 = f'哔哩哔哩番剧top50_20211215_154745.csv'
 16
 17 filename2 = file_name2
 18
 19 with open(filename2,encoding="utf_8_sig") as f2:
 20
 21     reader2 = csv.reader(f2)
 22
 23     header_row2 = next(reader2)
 24
 25     print(header_row2)
 26
 27     for index,column_header in enumerate(header_row2):
 28
 29         print(index,column_header)
 30
 31     rank2 = []
 32
 33     title2 = []
 34
 35     highs2 = []
 36
 37     url2 = []
 38
 39     visit2 = []
 40
 41     new_word2 = []
 42
 43     for row in reader2:
 44
 45         rank2.append(row[0])
 46
 47         title2.append(row[1])
 48
 49         visit2.append(row[2].strip('\n').strip(' ').strip('\n'))
 50
 51         highs2.append(row[3].strip('\n').strip(' ').strip('\n'))
 52
 53         new_word2.append(row[4])
 54
 55         url2.append(row[5].strip('\n').strip(' ').strip('\n').strip('//'))
 56
 57     print(highs2)
 58
 59     title2 = str(title2)
 60
 61     title2 = eval(title2)
 62
 63     visit2 = str(visit2)
 64
 65     visit2 = visit2.replace('万', '000')
 66
 67     visit2 = visit2.replace('亿', '0000000')
 68
 69     visit2 = visit2.replace('.', '')
 70
 71     visit2 = eval(visit2)
 72
 73     visit2 = list(map(int, visit2))
 74
 75     visit_list_new2 = list(map(int, visit2))
 76
 77     highs2 = str(highs2)
 78
 79     highs2 = highs2.replace('万', '000')
 80
 81     highs2 = highs2.replace('.', '')
 82
 83     highs2 = eval(highs2)
 84
 85     highs_list_new2 = list(map(int, highs2))
 86
 87 with open('output.csv','w') as f:
 88
 89     writer = csv.writer(f)
 90
 91     writer.writerows(zip(highs_list_new2,visit_list_new2))
 92
 93 #创建数据集
 94
 95 examDict  = {'弹幕量':highs_list_new2[0:10],
 96
 97              '播放量':visit_list_new2[0:10]}
 98
 99 #转换为DataFrame的数据格式
100
101 examDf = DataFrame(examDict)
102
103 #绘制散点图
104
105 plt.scatter(examDf.播放量,examDf.弹幕量,color = 'b',label = "Exam Data")
106
107 #添加图的标签(x轴,y轴)
108
109 plt.xlabel("Hours")
110
111 plt.ylabel("Score")
112
113 #显示图像
114
115 plt.show()
116
117 rDf = examDf.corr()
118
119 print(rDf)
120
121 exam_X=examDf.弹幕量
122
123 exam_Y=examDf.播放量
124
125 #将原数据集拆分训练集和测试集
126
127 X_train,X_test,Y_train,Y_test = train_test_split(exam_X,exam_Y,train_size=.8)
128
129 #X_train为训练数据标签,X_test为测试数据标签,exam_X为样本特征,exam_y为样本标签,train_size 训练数据占比
130
131
132
133 print("原始数据特征:",exam_X.shape,
134
135       ",训练数据特征:",X_train.shape,
136
137       ",测试数据特征:",X_test.shape)
138
139
140
141 print("原始数据标签:",exam_Y.shape,
142
143       ",训练数据标签:",Y_train.shape,
144
145       ",测试数据标签:",Y_test.shape)
146
147 #散点图
148
149 plt.scatter(X_train, Y_train, color="blue", label="train data")
150
151 plt.scatter(X_test, Y_test, color="red", label="test data")
152
153
154
155 #添加图标标签
156
157 plt.legend(loc=2)
158
159 plt.xlabel("Hours")
160
161 plt.ylabel("Pass")
162
163 #显示图像
164
165 plt.savefig("tests.jpg")
166
167 plt.show()
168
169 model = LinearRegression()
170
171
172
173 #对于模型错误我们需要把我们的训练集进行reshape操作来达到函数所需要的要求
174
175 # model.fit(X_train,Y_train)
176
177
178
179 #reshape如果行数=-1的话可以使我们的数组所改的列数自动按照数组的大小形成新的数组
180
181 #因为model需要二维的数组来进行拟合但是这里只有一个特征所以需要reshape来转换为二维数组
182
183 X_train = X_train.values.reshape(-1,1)
184
185 X_test = X_test.values.reshape(-1,1)
186
187
188
189 model.fit(X_train,Y_train)
190
191 a  = model.intercept_#截距
192
193
194
195 b = model.coef_#回归系数
196
197
198
199 print("最佳拟合线:截距",a,",回归系数:",b)
200
201 #训练数据的预测值
202
203 y_train_pred = model.predict(X_train)
204
205 #绘制最佳拟合线:标签用的是训练数据的预测值y_train_pred
206
207 plt.plot(X_train, y_train_pred, color='black', linewidth=3, label="best line")
208
209
210
211 #测试数据散点图
212
213 plt.scatter(X_test, Y_test, color='red', label="test data")
214
215
216
217 #添加图标标签
218
219 plt.legend(loc=2)
220
221 plt.xlabel("Number1")
222
223 plt.ylabel("Number2")
224
225 #显示图像
226
227 plt.savefig("lines.jpg")
228
229 plt.show()
230
231 score = model.score(X_test,Y_test)
232
233 print(score)
4.数据持久化
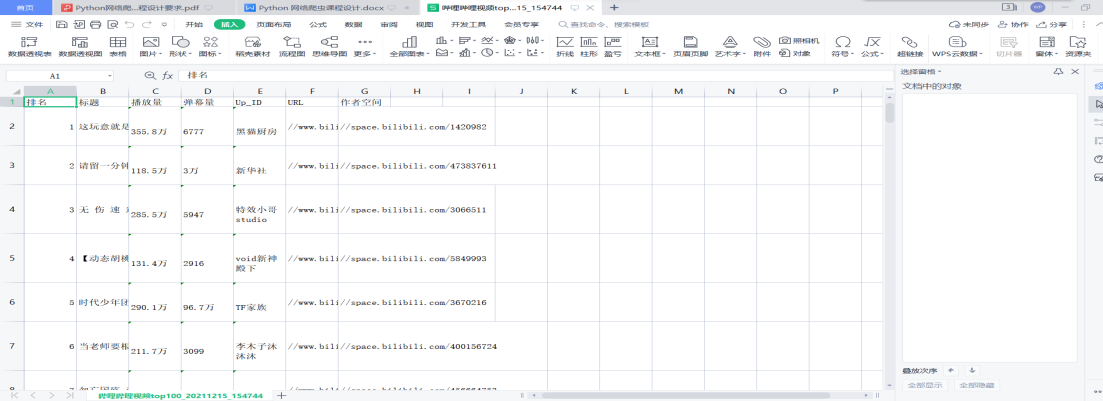
 1 file_name1 = f'哔哩哔哩视频top100_{now_str}.csv'
 2
 3 with open(file_name1,'w',newline='',encoding='utf-8') as f:
 4
 5     writer = csv.writer(f)
 6
 7     writer.writerow(Video.csv_title())
 8
 9     for v in videos:
10
11         writer.writerow(v.to_csv())
12
13 file_name2 = f'哔哩哔哩番剧top50_{now_str}.csv'
14
15 with open(file_name2,'w',newline='',encoding='utf-8') as f:
16
17     writer = csv.writer(f)
18
19     writer.writerow(Video.csv_title())
20
21     for v in videos:
22
23         writer.writerow(v.to_csv())
24
25 plt.savefig(r"C:\Users\24390\Desktop\bilibili-up-v.png")#图片保存
26
27 plt.savefig(r"C:\Users\24390\Desktop\bilibili-draw-v.png")#图片保存
5.将以上各部分的代码汇总,附上完整程序代码
  1 import requests
  2
  3 from bs4 import BeautifulSoup
  4
  5 import csv
  6
  7 import datetime
  8
  9 import pandas as pd
 10
 11 import numpy as np
 12
 13 from matplotlib import rcParams
 14
 15 import matplotlib.pyplot as plt
 16
 17 import matplotlib.font_manager as font_manager
 18
 19 from selenium import webdriver
 20
 21 from time import sleep
 22
 23 import matplotlib
 24
 25 from sklearn.model_selection import train_test_split
 26
 27 from sklearn.linear_model import LinearRegression
 28
 29 from pandas import DataFrame,Series
 30
 31 url = 'https://www.bilibili.com/v/popular/rank/all'
 32
 33 response = requests.get(url)#发起网络请求
 34
 35 html_text = response.text
 36
 37 soup = BeautifulSoup(html_text,'html.parser')
 38
 39 class Video:#创建Video对象
 40
 41     def __init__(self,rank,title,visit,barrage,up_id,url,space):
 42
 43         self.rank = rank
 44
 45         self.title = title
 46
 47         self.visit = visit
 48
 49         self.barrage = barrage
 50
 51         self.up_id = up_id
 52
 53         self.url = url
 54
 55         self.space = space
 56
 57     def to_csv(self):
 58
 59         return[self.rank,self.title,self.visit,self.barrage,self.up_id,self.url,self.space]
 60
 61     @staticmethod
 62
 63     def csv_title():
 64
 65         return ['排名','标题','播放量','弹幕量','Up_ID','URL','作者空间']
 66
 67 items = soup.findAll('li',{'class':'rank-item'})#提取列表
 68
 69 videos = []#保存提取出来的Video列表
 70
 71 for itm in items:
 72
 73     title = itm.find('a',{'class':'title'}).text #视频标题
 74
 75     rank = itm.find('i',{'class':'num'}).text #排名
 76
 77     visit = itm.find_all('span')[3].text #播放量
 78
 79     barrage = itm.find_all('span')[4].text #弹幕量
 80
 81     up_id = itm.find('span',{'class':'data-box up-name'}).text #作者id
 82
 83     url = itm.find_all('a')[1].get('href')#获取视频网址
 84
 85     space = itm.find_all('a')[2].get('href')#获取作者空间网址
 86
 87     v = Video(rank,title,visit,barrage,up_id,url,space)
 88
 89     videos.append(v)
 90
 91 now_str = datetime.datetime.now().strftime('%Y%m%d_%H%M%S')
 92
 93 file_name1 = f'哔哩哔哩视频top100_{now_str}.csv'
 94
 95 with open(file_name1,'w',newline='',encoding='utf-8') as f:
 96
 97     writer = csv.writer(f)
 98
 99     writer.writerow(Video.csv_title())
100
101     for v in videos:
102
103         writer.writerow(v.to_csv())
104
105 url = 'https://www.bilibili.com/v/popular/rank/bangumi'
106
107 response = requests.get(url)#发起网络请求
108
109 html_text = response.text
110
111 soup = BeautifulSoup(html_text,'html.parser')
112
113 class Video:#创建Video对象
114
115     def __init__(self,rank,title,visit,barrage,new_word,url):
116
117         self.rank = rank
118
119         self.title = title
120
121         self.visit = visit
122
123         self.barrage = barrage
124
125         self.new_word = new_word
126
127         self.url = url
128
129     def to_csv(self):
130
131         return[self.rank,self.title,self.visit,self.barrage,self.new_word,self.url]
132
133     @staticmethod
134
135     def csv_title():
136
137         return ['排名','标题','播放量','弹幕量','更新话数至','URL']
138
139 items = soup.findAll('li',{'class':'rank-item'})#提取列表
140
141 videos = []#保存提取出来的Video列表
142
143 for itm in items:
144
145     rank = itm.find('i',{'class':'num'}).text #排名
146
147     title = itm.find('a',{'class':'title'}).text #视频标题
148
149     url = itm.find_all('a')[0].get('href')#获取视频网址
150
151     visit = itm.find_all('span')[2].text #播放量
152
153     barrage = itm.find_all('span')[3].text #弹幕量
154
155     new_word = itm.find('span',{'class':'data-box'}).text#更新话数
156
157     v = Video(rank,title,visit,barrage,new_word,url)
158
159     videos.append(v)
160
161 now_str = datetime.datetime.now().strftime('%Y%m%d_%H%M%S')
162
163 file_name2 = f'哔哩哔哩番剧top50_{now_str}.csv'
164
165 with open(file_name2,'w',newline='',encoding='utf-8') as f:
166
167     writer = csv.writer(f)
168
169     writer.writerow(Video.csv_title())
170
171     for v in videos:
172
173         writer.writerow(v.to_csv())
174
175 paiming1 = pd.DataFrame(pd.read_csv(file_name1,encoding="utf_8_sig"))#对数据进行清洗和处理
176
177 paiming2 = pd.DataFrame(pd.read_csv(file_name2,encoding="utf_8_sig"))
178
179 print(paiming1.head())
180
181 print(paiming2.head())
182
183 print(paiming1.duplicated())#查找重复值
184
185 print(paiming2.duplicated())
186
187 print(paiming1['标题'].isnull().value_counts())#查找空值与缺失值
188
189 print(paiming2['标题'].isnull().value_counts())
190
191 print(paiming1['URL'].isnull().value_counts())
192
193 print(paiming2['URL'].isnull().value_counts())
194
195 print(paiming1['播放量'].isnull().value_counts())
196
197 print(paiming2['播放量'].isnull().value_counts())
198
199 print(paiming1['弹幕量'].isnull().value_counts())
200
201 print(paiming2['弹幕量'].isnull().value_counts())
202
203 #数据分析以及可视化
204
205 filename1 = file_name1
206
207 filename2 = file_name2
208
209 with open(filename1,encoding="utf_8_sig") as f1:
210
211     reader1 = csv.reader(f1)#创建阅读器(调用csv.reader()将前面存储的文件对象最为实参传给它)
212
213     header_row1 = next(reader1)#调用了next()一次,所以这边只调用了文件的第一行,并将头文件存储在header_row中
214
215     print(header_row1)
216
217     for index,column_header in enumerate(header_row1):#指出每个头文件的索引
218
219         print(index,column_header)
220
221     title1 = []
222
223     rank1 = []
224
225     highs1=[]
226
227     url1 = []
228
229     visit1 = []
230
231     space1 = []
232
233     up_id1 = []
234
235     for row in reader1:
236
237         rank1.append(row[0])
238
239         title1.append(row[1])
240
241         visit1.append(row[2].strip('\n').strip(' ').strip('\n'))
242
243         highs1.append(row[3].strip('\n').strip(' ').strip('\n'))
244
245         up_id1.append(row[4].strip('\n').strip(' ').strip('\n'))
246
247         url1.append(row[5].strip('\n').strip(' ').strip('\n').strip('//'))
248
249         space1.append(row[6].strip('\n').strip(' ').strip('\n').strip('//'))
250
251     visit1 = str(visit1)
252
253     visit1 = visit1.replace('万', '000')
254
255     visit1 = visit1.replace('.', '')
256
257     visit1 = eval(visit1)
258
259     visit_list_new1 = list(map(int, visit1))
260
261     highs1 = str(highs1)
262
263     highs1 = highs1.replace('万', '000')
264
265     highs1 = highs1.replace('.', '')
266
267     highs1 = eval(highs1)
268
269     highs_list_new1 = list(map(int, highs1))
270
271     print(highs_list_new1)
272
273 x=np.array(rank1[0:10])#设置x轴数据
274
275 y=np.array(highs_list_new1[0:10])#设置y轴数据
276
277 plt.bar(x,y,color =  ["red","yellow","green","blue","black","gold","pink","purple","violet","Chocolate"],width = 0.5)# 绘制柱状图,并把每根柱子的颜色设置自己的喜欢的颜色,顺便设置每根柱子的宽度
278
279 plt.show()
280
281 x=np.array(title1[0:10])#设置x轴数据
282
283 y=np.array(visit_list_new1[0:10])#设置y轴数据
284
285 plt.bar(x,y,color =  ["red","yellow","green","blue","black","gold","pink","purple","violet","Chocolate"],width = 0.5)# 绘制柱状图,并把每根柱子的颜色设置自己的喜欢的颜色,顺便设置每根柱子的宽度
286
287 matplotlib.rcParams['font.sans-serif'] = ['KaiTi']
288
289 plt.show()
290
291 fig = plt.figure(figsize = (15,8))#定义画布的大小
292
293 plt.title("各视频播放量")#添加主标题
294
295 plt.xlabel("视频名称")#设置X周与Y周的标题
296
297 plt.ylabel("播放量")
298
299 plt.grid(True)# 显示网格线
300
301 x=np.array(title1[0:10])#设置x轴数据
302
303 y=np.array(visit_list_new1[0:10])#设置y轴数据
304
305 plt.bar(x,y,color = ["red","yellow","green","blue","black","gold","pink","purple","violet","Chocolate"],width = 0.6)#绘制柱状图,并把每根柱子的颜色设置自己的喜欢的颜色,顺便设置每根柱子的宽度
306
307 plt.savefig(r"C:\Users\24390\Desktop\bilibili-up-v.png")#图片保存
308
309 with open(filename2,encoding="utf_8_sig") as f2:
310
311     reader2 = csv.reader(f2)
312
313     header_row2 = next(reader2)
314
315     print(header_row2)
316
317     for index,column_header in enumerate(header_row2):
318
319         print(index,column_header)
320
321     rank2 = []
322
323     title2 = []
324
325     highs2 = []
326
327     url2 = []
328
329     visit2 = []
330
331     new_word2 = []
332
333     for row in reader2:
334
335         rank2.append(row[0])
336
337         title2.append(row[1])
338
339         visit2.append(row[2].strip('\n').strip(' ').strip('\n'))
340
341         highs2.append(row[3].strip('\n').strip(' ').strip('\n'))
342
343         new_word2.append(row[4])
344
345         url2.append(row[5].strip('\n').strip(' ').strip('\n').strip('//'))
346
347     print(highs2)
348
349     title2 = str(title2)
350
351     title2 = eval(title2)
352
353     visit2 = str(visit2)
354
355     visit2 = visit2.replace('万', '000')
356
357     visit2 = visit2.replace('亿', '0000000')
358
359     visit2 = visit2.replace('.', '')
360
361     visit2 = eval(visit2)
362
363     visit2 = list(map(int, visit2))
364
365     visit_list_new2 = list(map(int, visit2))
366
367     highs2 = str(highs2)
368
369     highs2 = highs2.replace('万', '000')
370
371     highs2 = highs2.replace('.', '')
372
373     highs2 = eval(highs2)
374
375     highs_list_new2 = list(map(int, highs2))
376
377     print(highs_list_new2)
378
379 x=np.array(rank2[0:10])#设置x轴数据
380
381 y=np.array(highs_list_new2[0:10])#设置y轴数据
382
383 plt.bar(x,y,color =  ["red","yellow","green","blue","black","gold","pink","purple","violet","Chocolate"],width = 0.5)# 绘制柱状图,并把每根柱子的颜色设置自己的喜欢的颜色,顺便设置每根柱子的宽度
384
385 plt.show()
386
387 x=np.array(title2[0:10])#设置x轴数据
388
389 y=np.array(visit_list_new2[0:10])#设置y轴数据
390
391 plt.bar(x,y,color =  ["red","yellow","green","blue","black","gold","pink","purple","violet","Chocolate"],width = 0.5)# 绘制柱状图,并把每根柱子的颜色设置自己的喜欢的颜色,顺便设置每根柱子的宽度
392
393 matplotlib.rcParams['font.sans-serif'] = ['KaiTi']
394
395 plt.show()
396
397 fig = plt.figure(figsize = (15,8))# 定义画布的大小
398
399 plt.title("番剧播放量")#添加主标题
400
401 plt.xlabel("番剧名称")#设置X周与Y周的标题
402
403 plt.ylabel("播放量")
404
405 plt.grid(True)# 显示网格线
406
407 x=np.array(title2[0:10])#设置x轴数据
408
409 y=np.array(visit_list_new2[0:10])#设置y轴数据
410
411 plt.bar(x,y,color = ["red","yellow","green","blue","black","gold","pink","purple","violet","Chocolate"],width = 0.6)# 绘制柱状图,并把每根柱子的颜色设置自己的喜欢的颜色,顺便设置每根柱子的宽度
412
413 plt.savefig(r"C:\Users\24390\Desktop\bilibili-draw-v.png")#图片保存
414
415 with open('output.csv','w') as f:
416
417     writer = csv.writer(f)
418
419     writer.writerows(zip(highs_list_new2,visit_list_new2))
420
421 #创建数据集
422
423 examDict  = {'弹幕量':highs_list_new2[0:10],
424
425              '播放量':visit_list_new2[0:10]}
426
427 #转换为DataFrame的数据格式
428
429 examDf = DataFrame(examDict)
430
431 #绘制散点图
432
433 plt.scatter(examDf.播放量,examDf.弹幕量,color = 'b',label = "Exam Data")
434
435 #添加图的标签(x轴,y轴)
436
437 plt.xlabel("Hours")
438
439 plt.ylabel("Score")
440
441 #显示图像
442
443 plt.show()
444
445 rDf = examDf.corr()
446
447 print(rDf)
448
449 exam_X=examDf.弹幕量
450
451 exam_Y=examDf.播放量
452
453 #将原数据集拆分训练集和测试集
454
455 X_train,X_test,Y_train,Y_test = train_test_split(exam_X,exam_Y,train_size=.8)
456
457 #X_train为训练数据标签,X_test为测试数据标签,exam_X为样本特征,exam_y为样本标签,train_size 训练数据占比
458
459
460
461 print("原始数据特征:",exam_X.shape,
462
463       ",训练数据特征:",X_train.shape,
464
465       ",测试数据特征:",X_test.shape)
466
467
468
469 print("原始数据标签:",exam_Y.shape,
470
471       ",训练数据标签:",Y_train.shape,
472
473       ",测试数据标签:",Y_test.shape)
474
475 #散点图
476
477 plt.scatter(X_train, Y_train, color="blue", label="train data")
478
479 plt.scatter(X_test, Y_test, color="red", label="test data")
480
481
482
483 #添加图标标签
484
485 plt.legend(loc=2)
486
487 plt.xlabel("Hours")
488
489 plt.ylabel("Pass")
490
491 #显示图像
492
493 plt.savefig("tests.jpg")
494
495 plt.show()
496
497 model = LinearRegression()
498
499
500
501 #对于模型错误我们需要把我们的训练集进行reshape操作来达到函数所需要的要求
502
503 # model.fit(X_train,Y_train)
504
505
506
507 #reshape如果行数=-1的话可以使我们的数组所改的列数自动按照数组的大小形成新的数组
508
509 #因为model需要二维的数组来进行拟合但是这里只有一个特征所以需要reshape来转换为二维数组
510
511 X_train = X_train.values.reshape(-1,1)
512
513 X_test = X_test.values.reshape(-1,1)
514
515
516
517 model.fit(X_train,Y_train)
518
519 a  = model.intercept_#截距
520
521
522
523 b = model.coef_#回归系数
524
525
526
527 print("最佳拟合线:截距",a,",回归系数:",b)
528
529 #训练数据的预测值
530
531 y_train_pred = model.predict(X_train)
532
533 #绘制最佳拟合线:标签用的是训练数据的预测值y_train_pred
534
535 plt.plot(X_train, y_train_pred, color='black', linewidth=3, label="best line")
536
537
538
539 #测试数据散点图
540
541 plt.scatter(X_test, Y_test, color='red', label="test data")
542
543
544
545 #添加图标标签
546
547 plt.legend(loc=2)
548
549 plt.xlabel("Number1")
550
551 plt.ylabel("Number2")
552
553 #显示图像
554
555 plt.savefig("lines.jpg")
556
557 plt.show()
558
559 score = model.score(X_test,Y_test)
560
561 print(score)
562
563 print(title1[1],title2[1])
564
565 print('请问您想观看UP主视频还是番剧亦或者是查询UP主的空间页面?\n观看UP主视频请扣1,观看番剧请扣2,查询UP主空间页面请扣3。')
566
567 z = int(input())
568
569 if z == int(2):
570
571     print(title2)
572
573     print('请输入您想观看的番剧:')
574
575     name = input()
576
577     i=0
578
579     for i in range(0,50,1):
580
581         if title2[i]==name:
582
583             print(i)
584
585             break
586
587     print(url2[i])
588
589     to_url2=url2[i]
590
591     d = webdriver.Chrome()#打开谷歌浏览器,并且赋值给变量d
592
593     d.get('https://'+to_url2)#通过get()方法,在当前窗口打开网页
594
595     sleep(2)
596
597 elif z == int(1):
598
599     print(title1)
600
601     print('请输入您想观看的UP主视频:')
602
603     name = input()
604
605     i=0
606
607     for i in range(0,100,1):
608
609         if title1[i]==name:
610
611             print(i)
612
613             break
614
615     print(url1[i])
616
617     to_url1=url1[i]
618
619     d = webdriver.Chrome()#打开谷歌浏览器,并且赋值给变量d
620
621     d.get('https://'+to_url1)#通过get()方法,在当前窗口打开网页
622
623     sleep(2)
624
625 elif z == int(3):
626
627     print(up_id1)
628
629     print('请输入您想查询的UP主空间:')
630
631     name = input()
632
633     i=0
634
635     for i in range(0,100,1):
636
637         if up_id1[i]==name:
638
639             print(i)
640
641             break
642
643     print(space1[i])
644
645     to_space11=space1[i]
646
647     d = webdriver.Chrome()#打开谷歌浏览器,并且赋值给变量d
648
649     d.get('https://'+to_space11)#通过get()方法,在当前窗口打开网页
650
651     sleep(2)
652
653 else:
654
655 print('输入不符合要求')
三、 总结
1.经过对主题数据的分析与可视化,可以得到哪些结论?是否达到预期的目标?
结论:本次课程设计,影响最深的就是在遇到问题时候,可以通过网上了解BUG问题的原因并很好地解决,在设计课程时候,可以考虑与机器学习以及其他方面进行结合本次课程所绘制的散点图与直方图等不只局限于课程爬虫设计这一主题,其中还涉及到对机器主题的应用,让我明白了设计课题主题的知识广泛与应用。
目标:首先需要学好网络爬虫基本的步骤request请求与存储。采集信息并提取出来进行可视化绘制也是我下次要学习的重点。实行数据的持久化可以减少对所获取的数据的清洗与处理次数。这次的课程设计使我明白了要加强对python的了解与理解,才能迅速的找到自己不足的地方并且专攻下来,争取推动自己对python的进程。

 浙公网安备 33010602011771号