

prometheus安装并监控主机(node_exporter+prometheus+grafana)
环境
OS:Centos 7
###############################Prometheus安装########################################
安装在机器192.168.1.136服务器上
1.二进制包下载地址
cd /soft/
wget https://github.com/prometheus/prometheus/releases/download/v3.3.0/prometheus-3.3.0.linux-amd64.tar.gz
2.安装
[root@prometheus local]#tar zxvf prometheus-3.3.0.linux-amd64.tar.gz
[root@prometheus local]#mv prometheus-3.3.0.linux-amd64 /opt/prometheus
[root@prometheus local]#cd /opt/prometheus
[root@prometheus prometheus]#mkdir bin conf data
[root@prometheus prometheus]#mv prometheus promtool bin/
[root@prometheus prometheus]#mv prometheus.yml conf/
[root@prometheus prometheus]#mkdir -p /opt/prometheus/rules ##规则文件目录
2.配置参数文件
[root@localhost conf]# more prometheus.yml
# my global config
global:
  scrape_interval: 15s # Set the scrape interval to every 15 seconds. Default is every 1 minute.
  evaluation_interval: 15s # Evaluate rules every 15 seconds. The default is every 1 minute.
  # scrape_timeout is set to the global default (10s).

# Alertmanager configuration
alerting:
  alertmanagers:
    - static_configs:
        - targets:
           ##- alertmanager:9093

# Load rules once and periodically evaluate them according to the global 'evaluation_interval'.
rule_files:
    - "/opt/prometheus/rules/*.yml"
  # - "first_rules.yml"
  # - "second_rules.yml"

# A scrape configuration containing exactly one endpoint to scrape:
# Here it's Prometheus itself.
scrape_configs:
  # The job name is added as a label `job=<job_name>` to any timeseries scraped from this config.
  - job_name: "prometheus"

    # metrics_path defaults to '/metrics'
    # scheme defaults to 'http'.

    static_configs:
      - targets: ["localhost:9090"]
       # The label name is added as a label `label_name=<label_value>` to any timeseries scraped from this config.
        labels:
          app: "prometheus"
3.检查配置文件是否正确
[root@localhost prometheus]# /opt/prometheus/bin/promtool check config /opt/prometheus/conf/prometheus.yml
Checking /opt/prometheus/conf/prometheus.yml
SUCCESS: /opt/prometheus/conf/prometheus.yml is valid prometheus config file syntax
4.创建 service 文件配置开机启动
[root@prometheus ~]#vi /lib/systemd/system/prometheus.service
[root@prometheus ~]#cat /lib/systemd/system/prometheus.service

[Unit]
Description=Prometheus Server
Documentation=https://prometheus.io/docs/introduction/overview/
After=network.target
[Service]
Restart=on-failure
User=root
Group=root
WorkingDirectory=/opt/prometheus/
ExecStart=/opt/prometheus/bin/prometheus --config.file=/opt/prometheus/conf/prometheus.yml
ExecReload=/bin/kill -HUP $MAINPID
LimitNOFILE=65535
[Install]
WantedBy=multi-user.target
[root@prometheus ~]#systemctl daemon-reload
[root@prometheus ~]#systemctl enable --now prometheus.service
[root@prometheus ~]#ss -tnlp |grep prometheus
LISTEN 0 128 *:9090 *:*
users:(("prometheus",pid=84755,fd=10))
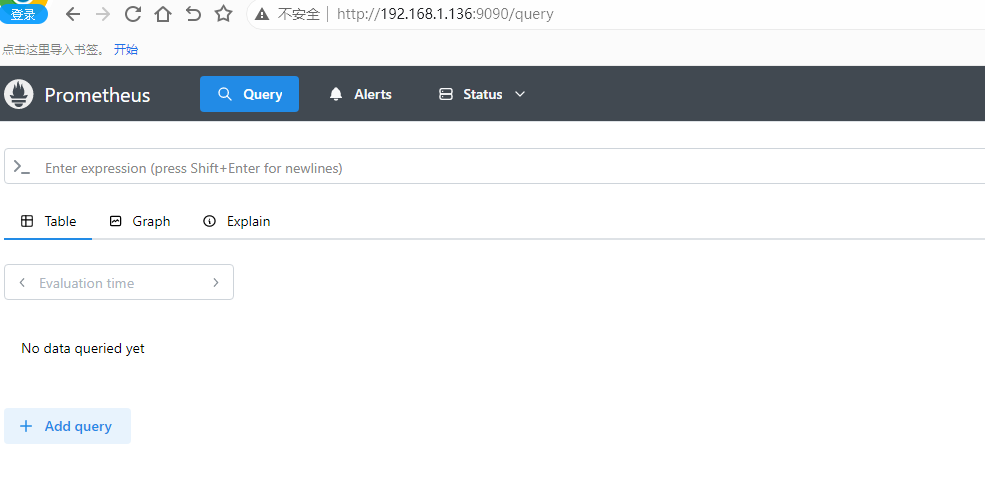
5.页面查看
#结果显示:可以看到当前主机上可以看到一个端口9090,可通过本机ip+9090 看到prometheus的服务页面
http://192.168.1.136:9090
##########################安装 Node Exporter##########################
Node Exporter 用于收集系统指标(如 CPU,内存使用率)
说明:
node exporter需要安装在被监控的机器上面
我这里在在被监控的机器:192.168.1.135机器上
1.下载安装包
wget https://github.com/prometheus/node_exporter/releases/download/v1.9.1/node_exporter-1.9.1.linux-amd64.tar.gz
2.解压并安装
[root@host135 soft]#tar -xvzf node_exporter-1.9.1.linux-amd64.tar.gz
[root@host135 soft]#mv node_exporter-1.9.1.linux-amd64 /opt/node_exporter
3.启动
[root@localhost soft]# cd /opt/node_exporter
nohup /opt/node_exporter/node_exporter &
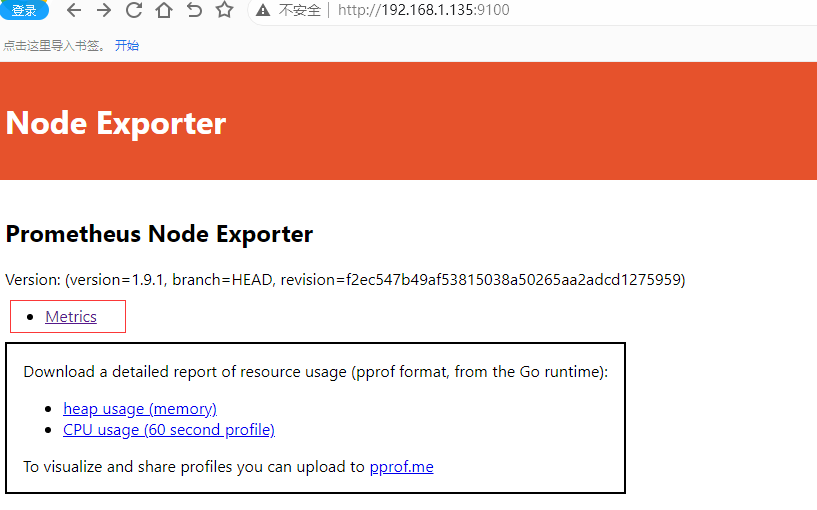
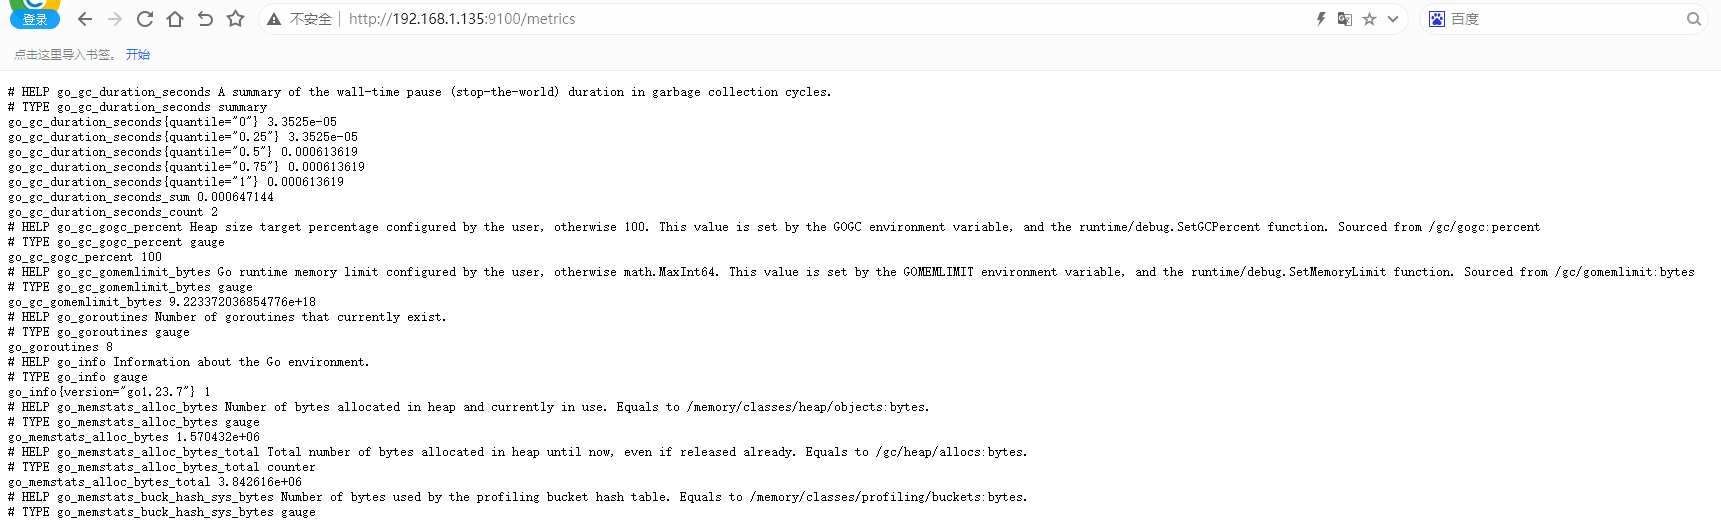
4.访问
浏览器访问 服务器IP:9100
http://192.168.1.135:9100
5.将监控的机器加入到prometheus
停掉prometheus
[root@localhost conf]# systemctl stop prometheus.service
修改prometheus配置文件,在prometheus服务器上操作
vi /opt/prometheus/conf/prometheus.yml
新增红色部分
[root@localhost conf]# more prometheus.yml
# my global config
global:
  scrape_interval: 15s # Set the scrape interval to every 15 seconds. Default is every 1 minute.
  evaluation_interval: 15s # Evaluate rules every 15 seconds. The default is every 1 minute.
  # scrape_timeout is set to the global default (10s).

# Alertmanager configuration
alerting:
  alertmanagers:
    - static_configs:
        - targets:
          # - alertmanager:9093

# Load rules once and periodically evaluate them according to the global 'evaluation_interval'.
rule_files:
  # - "first_rules.yml"
  # - "second_rules.yml"

# A scrape configuration containing exactly one endpoint to scrape:
# Here it's Prometheus itself.
scrape_configs:
  # The job name is added as a label `job=<job_name>` to any timeseries scraped from this config.
  - job_name: "prometheus"

    # metrics_path defaults to '/metrics'
    # scheme defaults to 'http'.

    static_configs:
      - targets: ["localhost:9090"]
       # The label name is added as a label `label_name=<label_value>` to any timeseries scraped from this config.
        labels:
          app: "prometheus"

  - job_name: "192.168.1.135"
    static_configs:
      - targets: ["192.168.1.135:9100"]
重新启动prometheus
[root@localhost conf]# systemctl start prometheus.service
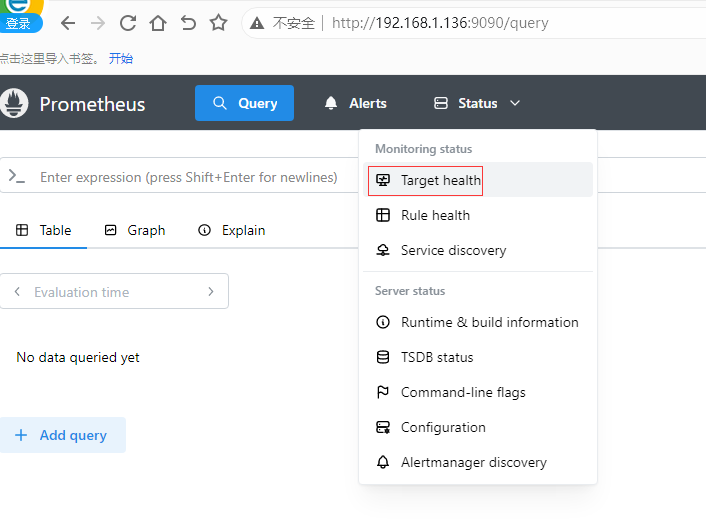
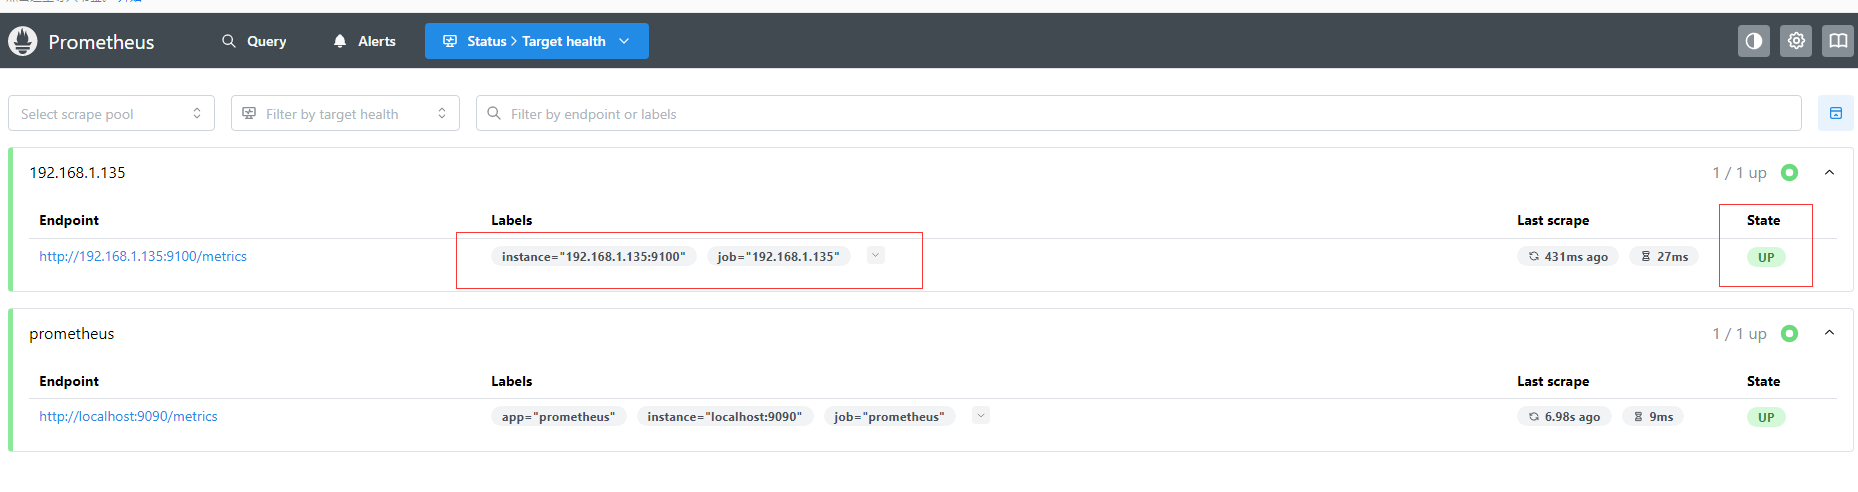
6.prometheus 界面查看添加主机情况
http://192.168.1.136:9090
############################安装grafana###########################
说明:我这里grafana安装与prometheus同一台服务器上面
1.介质获取
下载地址(选择oss版本下载):
https://grafana.com/grafana/download?edition=oss
我这里下载的是如下版本
grafana-11.5.3-1.x86_64.rpm
2.直接安装
[root@localhost soft]#cd /soft/
[root@localhost soft]# rpm -ivh  grafana-11.5.3-1.x86_64.rpm
warning: grafana-11.5.3-1.x86_64.rpm: Header V4 RSA/SHA512 Signature, key ID 10458545: NOKEY
Preparing...                          ################################# [100%]
Updating / installing...
   1:grafana-11.5.3-1                 ################################# [100%]
### NOT starting on installation, please execute the following statements to configure grafana to start automatically using systemd
 sudo /bin/systemctl daemon-reload
 sudo /bin/systemctl enable grafana-server.service
### You can start grafana-server by executing
 sudo /bin/systemctl start grafana-server.service
POSTTRANS: Running script
3.设置开启自启
systemctl daemon-reload
systemctl enable grafana-server.service
4.启动
systemctl start grafana-server.service
5.浏览器界面访问
服务器ip+3000
http://192.168.1.136:3000
初始密码是:admin/admin
第一次登录提示需要修改密码,我这里修改为admin123
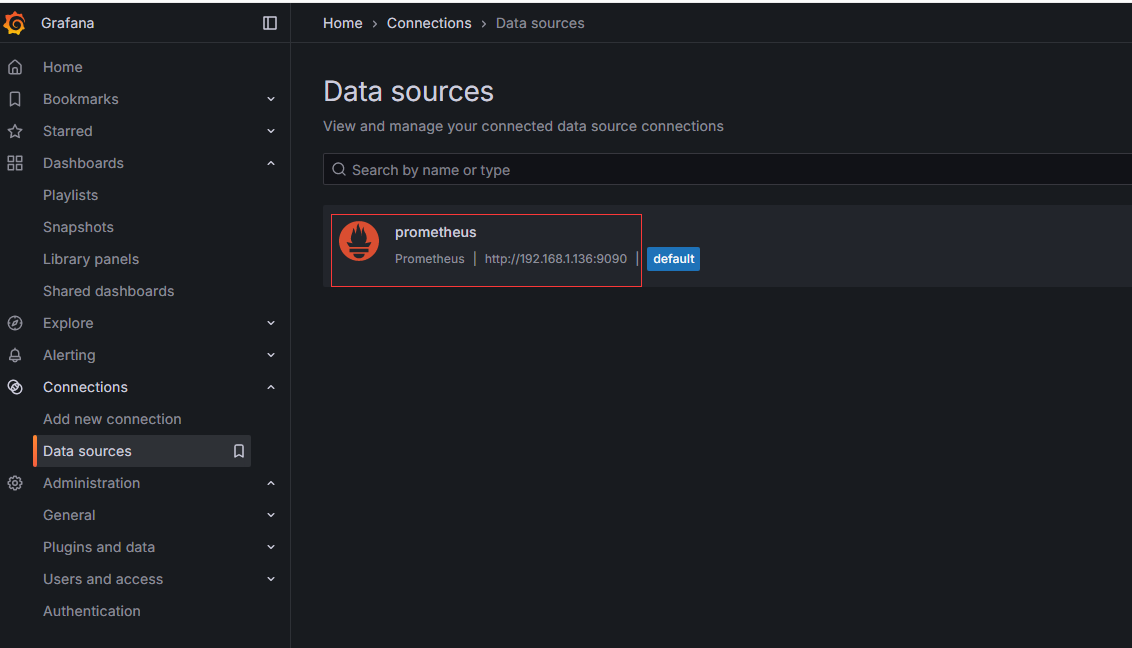
6.将prometheus作为数据源,配置到Grafana中
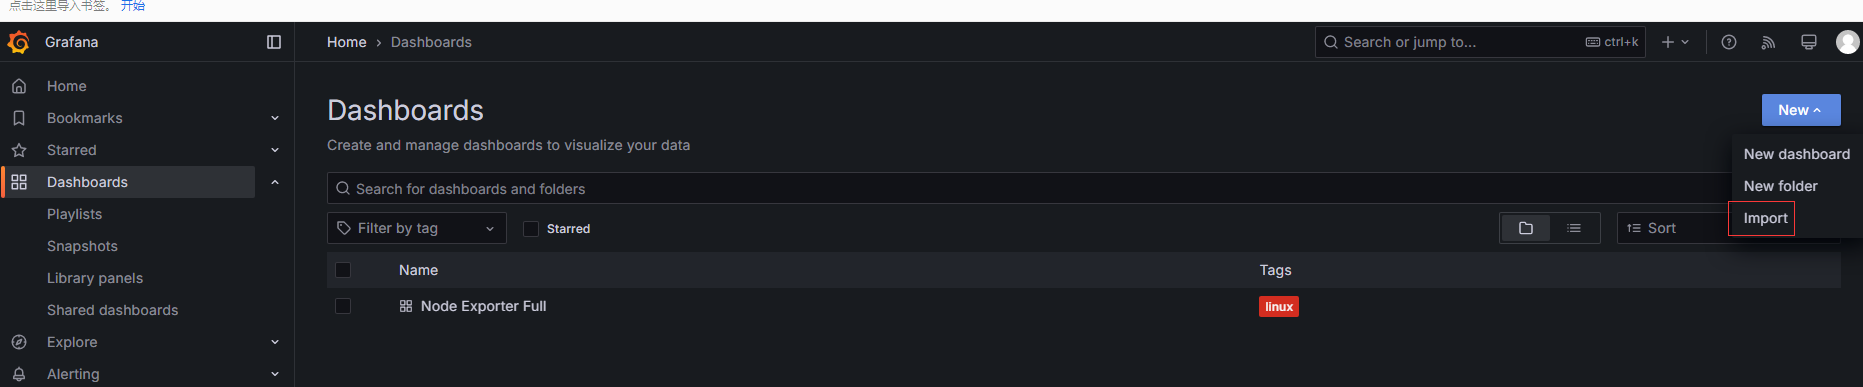
7.配置Dashboards
导入 Node Exporter 仪表盘
在 dashboad页面点击 Create > Import
在 Import via grafana.com 中输入仪表盘 ID 1860(Node Exporter 官方仪表盘)
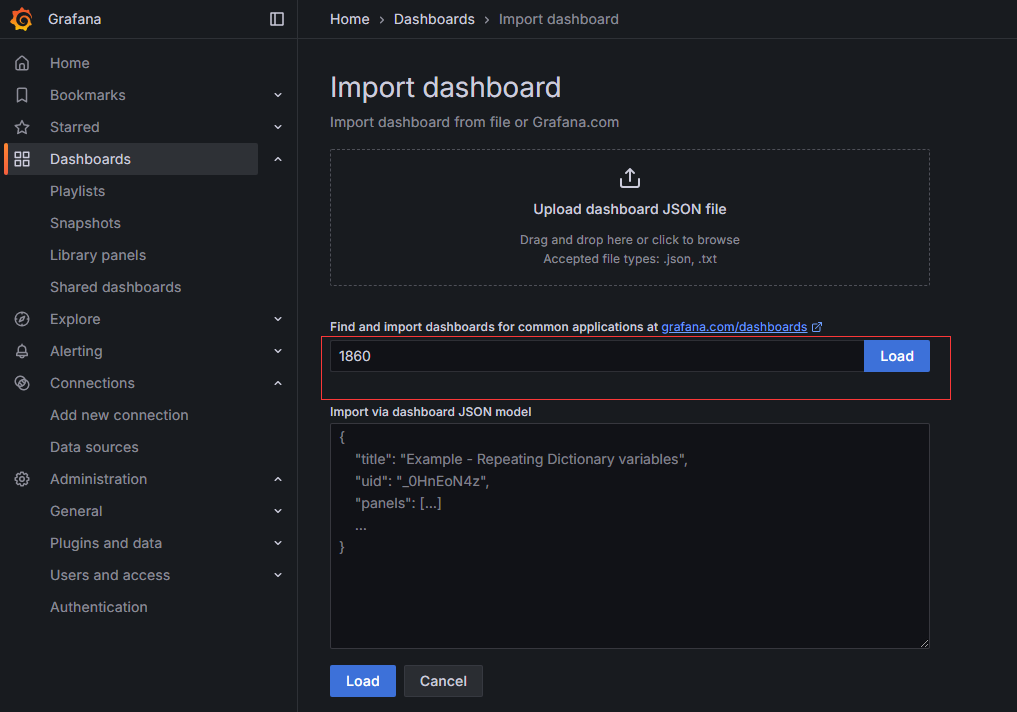
导入效果如下:
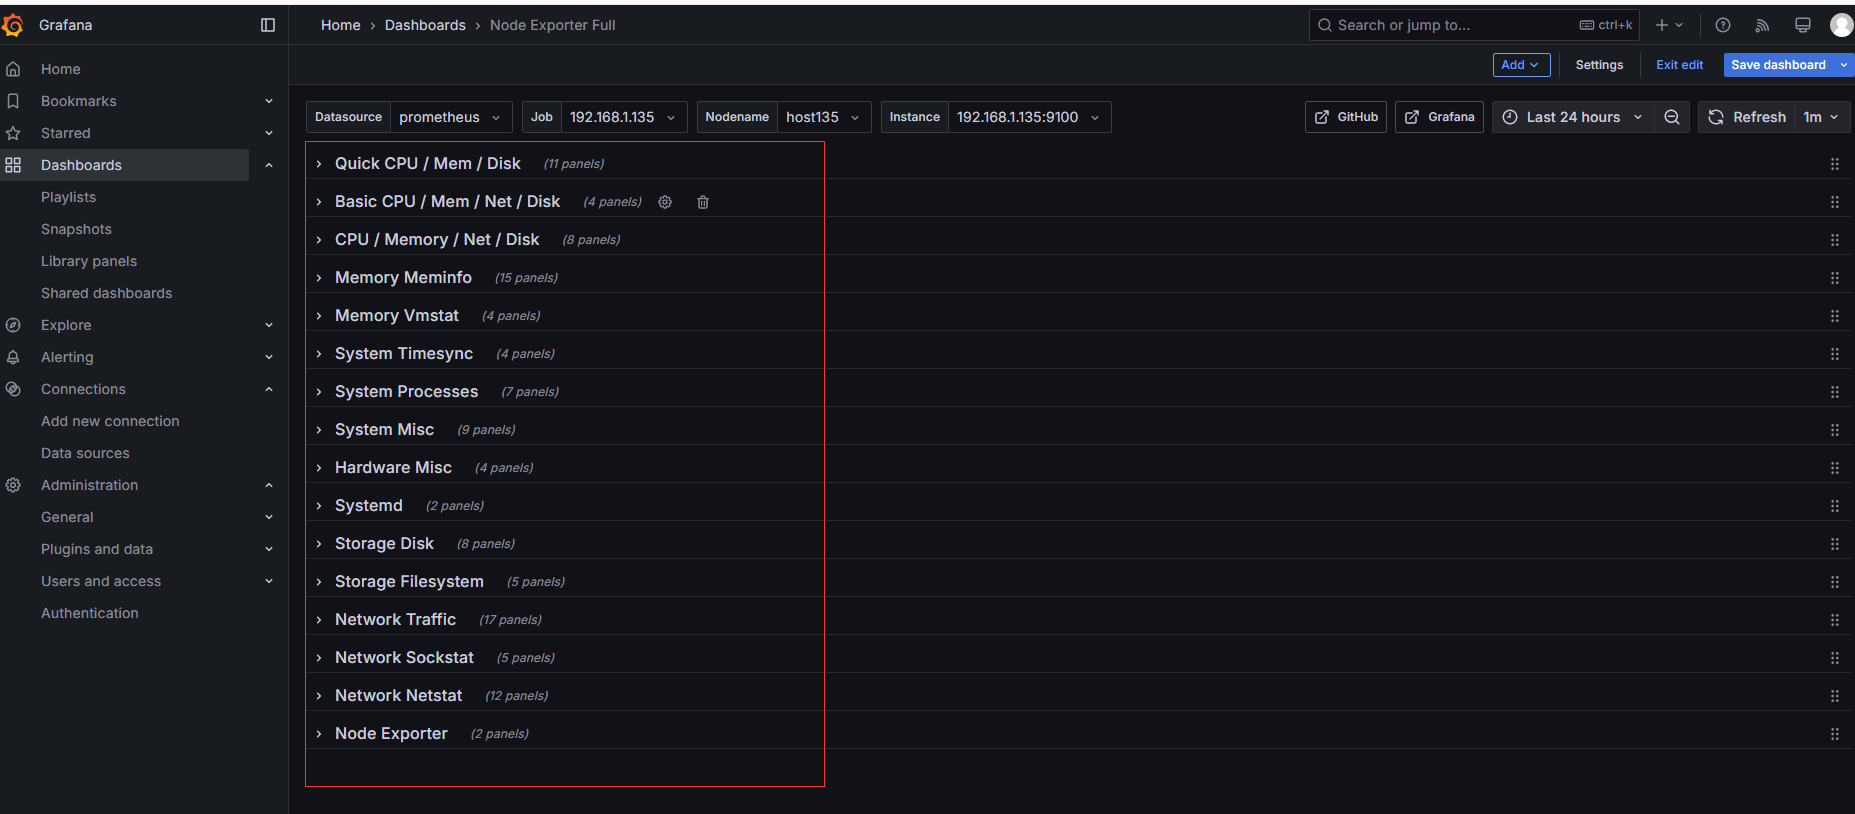
说明:
新机器纳入监控需要在被监控的机器上安装node exporter,然后在Prometheus加入新机器的配置(需要重启动),grafana会自动展现出来.

 浙公网安备 33010602011771号