WEB前端第六十六课——H5新特性:canvas图形绘制
1.canvas描述
canvas(画布)是H5提出的新标签,其目的是用于替代类似flash动画或游戏的插件,
能够极大地减少页面结构大小,提高页面响应速度。
说明:
⑴ canvas标签仅是一个图形容器,提供了一个可以绘制图像、图形的区域,可以实时渲染
图形、动画、虚拟图像等,对快速绘图进行了大量优化;
⑵ 使用<canvas>标签习惯性在标签内部设置元素大小,以及进行不支持说明;
示例:<canvas width:300px height:360px><p>浏览器不支持“canvas”!</p></canvas>
当然,也可以通过CSS设置尺寸属性,还可以通过“if语句”判断浏览器是否支持canvas。
⑶ canvas标签除了提供绘图区域外,没有其他行为功能,其内部的所有内容都要通过脚本
(JavaScript)进行绘制完成;
⑷ 使用canvas的基础模板:
<body>
<!--创建canvas画布,并设置区域大小-->
    <canvas id="myCanvas" width="200" height="300">
        您的浏览器不支持Canvas!
    </canvas>
    <script>
    //  获取canvas画布
        var canvas=document.getElementById('myCanvas');
    //  在画布上创建画笔
        var ctx=canvas.getcontext('2d');
/*    //  或通过if语句判断浏览器是否支持canvas
        if (canvas.getcontext){
            var ctx=canvas.getcontext('2d');
        }else {
            canvas.innerText='浏览器不支持canvas!';
        }*/
    //  在画布上绘制图形
        ctx.fillRect(10,10,60,60);
    </script>
</body>
⑸ 绝大部分Canvas的绘图API都没有定义在<canvas>元素本身上,而是定义在通过画布的
“getContext()”方法获取的“绘图上下文环境”这个对象上;
⑹ canvas元素只支持一种原生的图形绘制:矩形,其他所有图形的绘制都至少需要生成一条路径。
2.上屏即像素化
上屏即像素化是canvas的一个重要特征,是指区域内图形一旦绘制完成,便不能更改,如尺寸、位置等。
只有通过清除内容再重新绘制的方式,实现改变绘制内容的效果。
下面以绘制矩形为例。
绘制矩形的相关方法:
⑴ fillRect( x ,y ,width, height),绘制有填充的矩形;
⑵ strokeRect( x ,y ,width, height),绘制无填充的矩形;
⑶ clearRect( x ,y ,width, height),清除指定矩形内的像素;
⑷ rect( x, y, width, height) ,绘制矩形(定义矩形的路径),需要配合stroke()方法完成绘制。
另外,设置填充绘画的颜色,ctx.fillStyle='color';
代码示例:
<body>
<!--创建canvas画布,并设置区域大小-->
    <canvas id="myCanvas" width="360" height="360">
        您的浏览器不支持Canvas!
    </canvas>
    <script>
    //  获取canvas画布
        var canvas=document.getElementById('myCanvas');
    //  在画布上创建画笔
        var ctx=canvas.getContext('2d');

    //  在画布上绘制图形
        ctx.fillRect(50,50,60,60);
        ctx.strokeRect(30,30,100,100);
        ctx.clearRect(70,70,20,20);

        ctx.rect(150,150,60,60);
        ctx.stroke();       //绘制出rect()方法定义的路径

    //  通过反复清除、绘制,达到图像位移的效果。
        var position=30;
        var direction=1;
        var timer=setInterval(function () {
            if (position>=230){
                direction=-1;
            }else if (position<=10){
                direction=1;
            }
            switch (direction) {
                case -1:{
                    ctx.clearRect(position+19,position+19,102,102);
                    ctx.fillRect(position+20,position+20,60,60);
                    ctx.strokeRect(position,position,100,100);
                    ctx.clearRect(position+40,position+40,20,20);
                    position-=20;
                }
                break;
                case 1:{
                    position+=20;
                    ctx.clearRect(position-21,position-21,102,102);
                    if (position<=130) {
                        ctx.fillRect(50,50,60,60);
                        ctx.strokeRect(30,30,100,100);
                        ctx.clearRect(70,70,20,20);

                    }
                    if (position>150&&position<=210) {
                        ctx.rect(150,150,60,60);
                        ctx.stroke();
                    }
                    ctx.fillRect(position+20,position+20,60,60);
                    ctx.strokeRect(position,position,100,100);
                    ctx.clearRect(position+40,position+40,20,20);
                }
                break;
            }
        },100);
    </script>
</body>
3.路径绘制
canvas中路径是图形的基本元素,路径是不同颜色、宽度、长度的线段或曲线相连接形成的点线集合。
绘制路径的一般步骤:
⑴ beginPath(),路径绘制开始
⑵ moveTo(x,y),设置笔触(落点)的坐标位置
⑶ lineTo(x,y),设置线段的终点坐标位置
⑷ strokeStyle='color',设置笔触绘画的颜色,默认为黑色
⑸ stroke(),执行路径绘制
⑹ fillStyle='color',设置封闭路径内部填充颜色,默认为黑色
⑺ fill(),执行颜色填充
当使用fill()方法时,没有闭合的路径会自动闭合,可以不使用closePath()函数,
但stroke()方法不会自动闭合路径。
⑻ closePath(),路径绘制结束
使用路径开始和结束方法,可以确保各个路径之间的独立性。
代码示例:
<body>
    <canvas id="myCanvas" width="500" height="300">
        <p>Sorry,您的浏览器不支持Canvas!</p>
    </canvas>
    <script>
        var canvas=document.getElementById('myCanvas');
        var ctx=canvas.getContext('2d');
    //  创建未闭合路径,不进行填充
        ctx.beginPath()
        ctx.moveTo(70,80);
        ctx.lineTo(70,150);
        ctx.lineTo(120,150);
        ctx.strokeStyle='yellowgreen';
        ctx.stroke();
        ctx.closePath();
    //  创建未闭合路径,进行颜色填充
        ctx.beginPath()
        ctx.moveTo(170,80);
        ctx.lineTo(170,150);
        ctx.lineTo(220,150);
        ctx.lineTo(270,110);
        ctx.fillStyle='yellowgreen';
        ctx.fill();
        ctx.closePath();
    </script>
</body>

4.圆弧绘制
绘制圆弧或者圆形,使用“arc()”方法。
语法:ctx.arc(x, y, radius, startAngle, endAngle, anticlockwise);
说明:arc()方法一共有6个参数,表示以(x,y)坐标为圆心、radius为半径、从startAngle角度开始、
到endAngle角度结束,进行圆弧绘制,anticlockwise参数为布尔值,false表示顺时针绘制,
true表示逆时针绘制。
其中,arc()方法中的开始和结束角度单位是“弧度”,而不是度!
在JS中角度和弧度的换算表达式:radius=(Math.PI/180)*angleDegrees,也就相当于使用
“0~2”之间的任意数值乘以“Math.PI”得到相应的弧度。
另外,设置好圆弧路径之后,可以使用“Stroke()”方法进行绘制,也可以使用“fill()”方法填充。
代码示例:
<body>
    <canvas height="300" width="500" id="canvasArc">
        您的浏览器不支持Canvas!
    </canvas>
    <script>
        var canvas = document.getElementById('canvasArc');
        var ctx = canvas.getContext('2d');
        ctx.beginPath();
        ctx.arc(200,150,60,0,0.8*Math.PI,true);
        ctx.strokeStyle='blue';
        ctx.stroke();
        ctx.closePath();

        ctx.beginPath();
        ctx.arc(200,150,60,0,0.8*Math.PI,false);
        ctx.strokeStyle='red';
        ctx.stroke();
        ctx.closePath();

        ctx.beginPath();
        ctx.arc(200,150,60,1.5*Math.PI,0.3*Math.PI,false);
        ctx.fillStyle='lightgreen';
        ctx.fill();
        ctx.closePath();

        ctx.beginPath();
        ctx.arc(200,150,60,1.5*Math.PI,0.7*Math.PI,true);
        ctx.fillStyle='orange';
        ctx.fill();
        ctx.closePath();
    </script>
</body>

5.线型设置
⑴ 设置线条宽度
语法:ctx.lineWidth=value;
⑵ 设置线条端点
语法:ctx.linCap=style;
说明:
lineCap有三种样式,butt(默认值)、round(圆形末端)、square(方形末端)
⑶ 设置线条连接处样式
语法:ctx.lineJoin=style;
说明:
lineJoin有三种样式,miter(默认值)、round(圆弧形)、bevel(切面形)
⑷ 设置线条虚线样式
语法:ctx.setLineDash([segment1,segment2,segment3,...]);
说明:
setLineDash()方法的参数是一个数组,数组内的value依次表示虚线每一节的长度,
数组内的值将在线条上循环重复使用。
getLineDash()方法,用于获取当前线条的虚线样式,返回值为数组。
lineDashOffset()方法,用于设置当前线条第一节的偏移量。
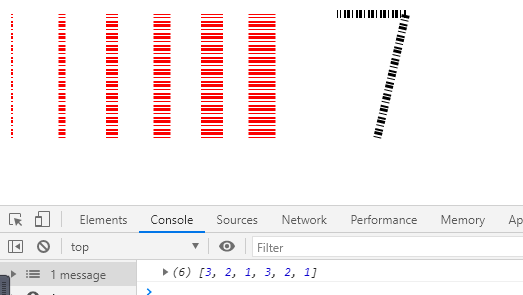
⑸ 代码示例:
<body>
    <canvas id="canvasLineStyle" width="500" height="300"></canvas>
    <script>
        var canvas=document.getElementById('canvasLineStyle');
        var ctx=canvas.getContext('2d');
        ctx.beginPath();
        ctx.moveTo(330,25);
        ctx.lineTo(399,25);
        ctx.lineTo(370,150);
        ctx.lineWidth=8;                    //设置线条宽度
        // ctx.lineCap='round';             //设置线条端点样式
        // ctx.lineJoin='bevel';            //设置线条连接处样式
        ctx.setLineDash([3,2,1]);           //设置线条虚线样式
        ctx.lineDashOffset=2;               //设置虚线起始位置偏移量
        var lineStyle=ctx.getLineDash();    //获取虚线样式
        console.log(lineStyle);
        ctx.stroke();
        ctx.closePath();

        ctx.strokeStyle="#e20213";
        for (var i=0;i<6; i++){
            ctx.lineWidth=2+i*5;            //设置线条宽度
            ctx.beginPath();
            ctx.moveTo(5+i*50, 25);
            ctx.lineTo(5+i*50, 150);
            ctx.stroke();
            ctx.closePath();
        }
    </script>
</body>
6.Gradients渐变
⑴ 线性渐变
语法:ctx.createLinearGradient(x1,y1,x2,y2);
说明:该方法有4个参数,(x1,y1)表示渐变的起点,(x2,y2)表示渐变的终点。
该方法返回一个Gradient对象。
⑵ 径向渐变
语法:ctx.createRadialGradient(x1,y1,r1,x2,y2,r2);
说明:该方法有6个参数,(x,y,r)表示以(x,y)为圆心,以r为半径的圆,创建渐变区域。
该方法返回一个Gradient对象。
⑶ 颜色设置
语法:canvasGradient.addColorStop(position,color);
说明:该方法有2个参数,position的值为“0~1”之间的任意数,表示渐变颜色的相对位置,
参数color用于设置渐变色,可以是十六进制颜色值,也可以是rgba()颜色。
⑷ 渐变填充
创建Gradient对象,并设置渐变颜色,然后将Gradient对象赋予“fillStyle”,即可进行绘制填充。
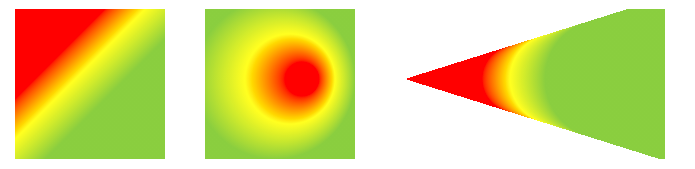
代码示例:
<body>
    <canvas height="300" width="1000" id="canvasGradient"></canvas>
    <script>
        var canvas=document.getElementById('canvasGradient');
        var ctx=canvas.getContext('2d');
    //  创建线性渐变对象。
        var linearGradient=ctx.createLinearGradient(50,50,100,100);
    //  线性渐变对象颜色设置。
        linearGradient.addColorStop(0,'red');
        linearGradient.addColorStop(0.5,'yellow');
        linearGradient.addColorStop(1,'yellowgreen');
    //  线性渐变绘制。
        ctx.beginPath();
        ctx.fillStyle=linearGradient;
        ctx.fillRect(10,10,150,150);
        ctx.closePath();

    //  创建径向渐变,外圆包含內圆。
        var radialGradient=ctx.createRadialGradient(300,80,10,270,80,80);
        radialGradient.addColorStop(0,'red');
        radialGradient.addColorStop(0.5,'yellow');
        radialGradient.addColorStop(1,'yellowgreen');
        ctx.beginPath();
        ctx.fillStyle=radialGradient;
        ctx.fillRect(200,10,150,150);
        ctx.fill();
        ctx.closePath();

        //  创建径向渐变,外圆不包含內圆。
        var radialGradient=ctx.createRadialGradient(500,80,30,600,80,60);
        radialGradient.addColorStop(0,'red');
        radialGradient.addColorStop(0.5,'yellow');
        radialGradient.addColorStop(1,'yellowgreen');
        ctx.beginPath();
        ctx.fillStyle=radialGradient;
        ctx.fillRect(360,10,300,150);
        ctx.fill();
        ctx.closePath();
    </script>
</body>

 浙公网安备 33010602011771号