SpringBoot系列——Logback日志,输出到文件以及实时输出到web页面
前言
SpringBoot对所有内部日志使用通用日志记录,但保留底层日志实现。为Java Util Logging、Log4J2和Logback提供了默认配置。在不同的情况下,日志记录器都预先配置为使用控制台输出,同时还提供可选的文件输出。默认情况下,SpringBoot使用Logback进行日志记录。
日志级别有(从高到低):FATAL(致命),ERROR(错误),WARN(警告),INFO(信息),DEBUG(调试),TRACE(跟踪)或者 OFF(关闭),默认的日志配置在消息写入时将消息回显到控制台。默认情况下,将记录错误级别、警告级别和信息级别的消息。
PS:Logback does not have a FATAL level. It is mapped to ERROR Logback没有FATAL致命级别。它被映射到ERROR错误级别
详情请戳官方文档:https://docs.spring.io/spring-boot/docs/2.1.5.RELEASE/reference/htmlsingle/#boot-features-logging
本文主要记录Logback日志输出到文件以及实时输出到web页面
输出到文件
我们创建SpringBoot项目时,spring-boot-starter已经包含了spring-boot-starter-logging,不需要再进行引入依赖
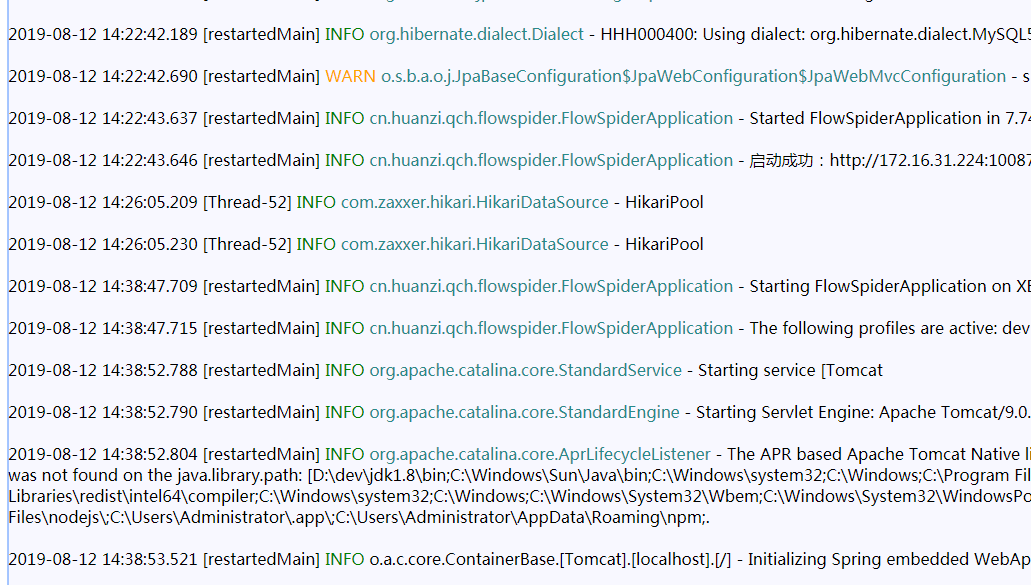
标准日志格式
2014-03-05 10:57:51.112  INFO 45469 --- [           main] org.apache.catalina.core.StandardEngine  : Starting Servlet Engine: Apache Tomcat/7.0.52
2014-03-05 10:57:51.253  INFO 45469 --- [ost-startStop-1] o.a.c.c.C.[Tomcat].[localhost].[/]       : Initializing Spring embedded WebApplicationContext
2014-03-05 10:57:51.253  INFO 45469 --- [ost-startStop-1] o.s.web.context.ContextLoader            : Root WebApplicationContext: initialization completed in 1358 ms
2014-03-05 10:57:51.698  INFO 45469 --- [ost-startStop-1] o.s.b.c.e.ServletRegistrationBean        : Mapping servlet: 'dispatcherServlet' to [/]
2014-03-05 10:57:51.702  INFO 45469 --- [ost-startStop-1] o.s.b.c.embedded.FilterRegistrationBean  : Mapping filter: 'hiddenHttpMethodFilter' to: [/*]
- Date and Time: Millisecond precision and easily sortable. 日期和时间:毫秒精度,易于排序。
- Log Level:
ERROR,WARN,INFO,DEBUG, orTRACE. 日志级别:错误、警告、信息、调试或跟踪。 - Process ID. 进程ID。
- A
---separator to distinguish the start of actual log messages. 分隔符,用于区分实际日志消息的开始。 - Thread name: Enclosed in square brackets (may be truncated for console output). 线程名称:括在方括号中(可能会被截断以用于控制台输出)。
- Logger name: This is usually the source class name (often abbreviated). 日志程序名称:这通常是源类名称(通常缩写)。
- The log message. 日志消息。
如何打印日志?
方法1
    /**
     * 配置内部类
     */
    @Controller
    @Configuration
    class Config {
        /**
         * 获取日志对象,构造函数传入当前类,查找日志方便定位
         */
        private final Logger log = LoggerFactory.getLogger(this.getClass());

        @Value("${user.home}")
        private String userName;

        /**
         * 端口
         */
        @Value("${server.port}")
        private String port;
/**
         * 启动成功
         */
        @Bean
        public ApplicationRunner applicationRunner() {
            return applicationArguments -> {
                try {
                    InetAddress ia = InetAddress.getLocalHost();
                    //获取本机内网IP
                    log.info("启动成功:" + "http://" + ia.getHostAddress() + ":" + port + "/");
                    log.info("${user.home} :" + userName);
                } catch (UnknownHostException ex) {
                    ex.printStackTrace();
                }
            };
        }
    }
方法2 使用lombok的@Slf4j,帮我们创建Logger对象,效果与方法1一样
    /**
     * 配置内部类
     */
    @Slf4j
    @Controller
    @Configuration
    class Config {

        @Value("${user.home}")
        private String userName;

        /**
         * 端口
         */
        @Value("${server.port}")
        private String port;/**
         * 启动成功
         */
        @Bean
        public ApplicationRunner applicationRunner() {
            return applicationArguments -> {
                try {
                    InetAddress ia = InetAddress.getLocalHost();
                    //获取本机内网IP
                    log.info("启动成功:" + "http://" + ia.getHostAddress() + ":" + port + "/");
                    log.info("${user.home} :" + userName);
                } catch (UnknownHostException ex) {
                    ex.printStackTrace();
                }
            };
        }
    }
简单配置
如果不需要进行复杂的日志配置,则在配置文件中进行简单的日志配置即可,默认情况下,SpringBoot日志只记录到控制台,不写日志文件。如果希望在控制台输出之外编写日志文件,则需要进行配置
  logging:
    path: /Users/Administrator/Desktop/杂七杂八/ims #日志文件路径
    file: ims.log #日志文件名称
    level:
      root: info #日志级别 root表示所有包,也可以单独配置具体包 fatal error warn info debug trace off
重新启动项目
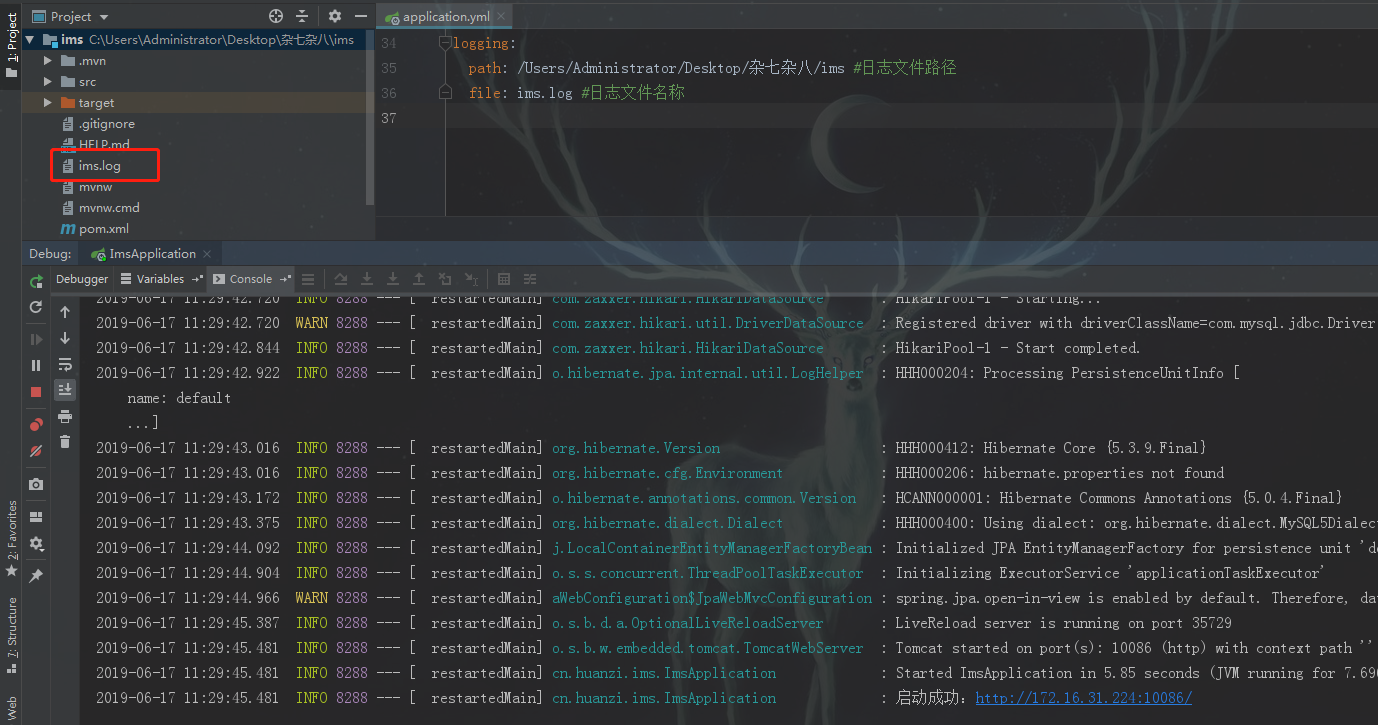
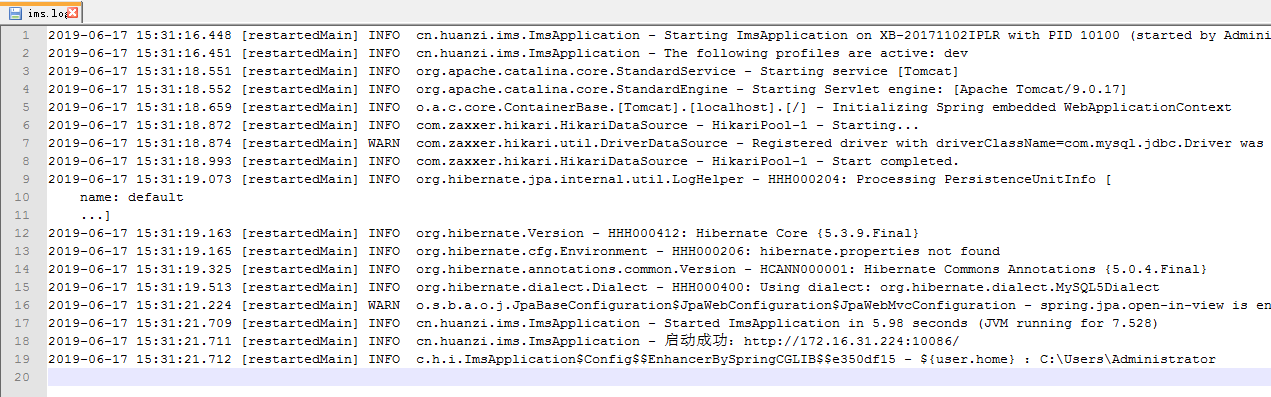
打开ims.log

扩展配置
Spring Boot包含许多Logback扩展,可以帮助进行高级配置。您可以在您的logback-spring.xml配置文件中使用这些扩展。如果需要比较复杂的配置,建议使用扩展配置的方式
PS:SpringBoot推荐我们使用带-spring后缀的 logback-spring.xml 扩展配置,因为默认的的logback.xml标准配置,Spring无法完全控制日志初始化。(spring扩展对springProfile节点的支持)
以下是项目常见的完整logback-spring.xml,SpringBoot默认扫描classpath下面的logback.xml、logback-spring.xml,所以不需要再指定spring.logging.config,当然,你指定也没有问题
logging:
  config: classpath:logback-spring.xml
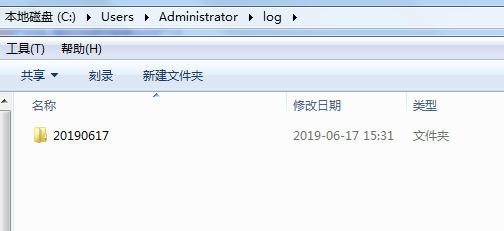
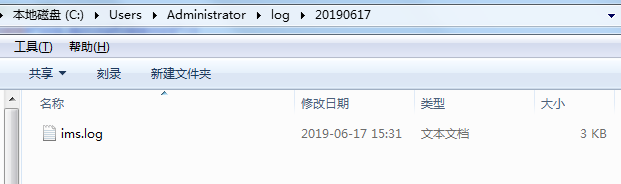
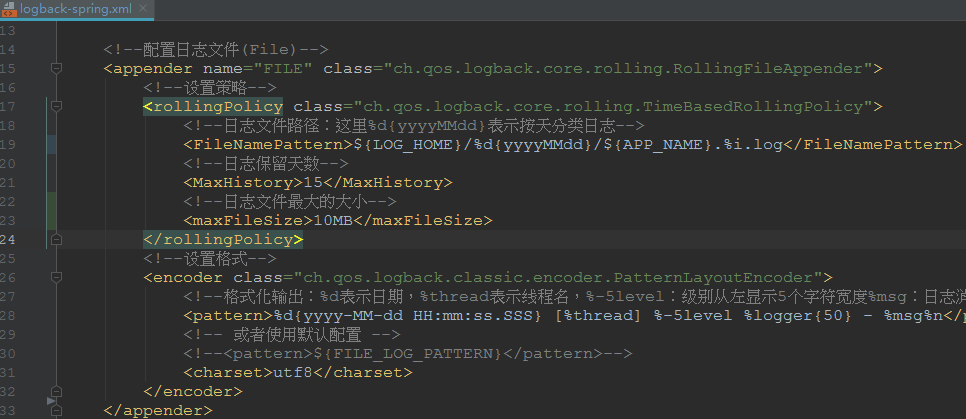
<?xml version="1.0" encoding="UTF-8"?>
<configuration debug="false">
    <!--日志文件主目录:这里${user.home}为当前服务器用户主目录-->
    <property name="LOG_HOME" value="${user.home}/log"/>
    <!--日志文件名称:这里spring.application.name表示工程名称-->
    <springProperty scope="context" name="APP_NAME" source="spring.application.name"/>

    <!--默认配置-->
    <include resource="org/springframework/boot/logging/logback/defaults.xml"/>
    <!--配置控制台(Console)-->
    <include resource="org/springframework/boot/logging/logback/console-appender.xml"/>

    <!--配置日志文件(File)-->
    <appender name="FILE" class="ch.qos.logback.core.rolling.RollingFileAppender">
        <!--设置策略-->
        <rollingPolicy class="ch.qos.logback.core.rolling.TimeBasedRollingPolicy">
            <!--日志文件路径:这里%d{yyyyMMdd}表示按天分类日志-->
            <FileNamePattern>${LOG_HOME}/%d{yyyyMMdd}/${APP_NAME}.%i.log</FileNamePattern>
            <!--日志保留天数-->
            <MaxHistory>15</MaxHistory>
            <MaxFileSise>10MB</MaxFileSise>

        </rollingPolicy>
        <!--设置格式-->
        <encoder class="ch.qos.logback.classic.encoder.PatternLayoutEncoder">
            <!--格式化输出:%d表示日期,%thread表示线程名,%-5level:级别从左显示5个字符宽度%msg:日志消息,%n是换行符-->
            <pattern>%d{yyyy-MM-dd HH:mm:ss.SSS} [%thread] %-5level %logger{50} - %msg%n</pattern>
            <!-- 或者使用默认配置 -->
            <!--<pattern>${FILE_LOG_PATTERN}</pattern>-->
            <charset>utf8</charset>
        </encoder>
    </appender>

    <!-- 多环境配置 按照active profile选择分支 -->
    <springProfile name="dev">
        <!--root节点 全局日志级别,用来指定最基础的日志输出级别-->
        <root level="INFO">
            <appender-ref ref="FILE"/>
            <appender-ref ref="CONSOLE"/>
        </root>

        <!-- 子节点向上级传递 局部日志级别-->
        <logger level="WARN" name="org.springframework"/>
        <logger level="WARN" name="com.netflix"/>
        <logger level="DEBUG" name="org.hibernate.SQL"/>
    </springProfile>
    <springProfile name="prod">

    </springProfile>
</configuration>
启动项目,去到${user.home}当前服务器用户主目录,日志按日期进行产生,如果项目产生的日志文件比较大,还可以按照小时进行.log文件的生成
2021-02-24更新:
如果需要按日志级别分别输出到对应的日志文件,在appender标签新增filter标签进行指定
<!-- 时间滚动输出 level为 【debug / info / warn / error】 日志 -->
<appender name="【DEBUG / INFO / WARN / ERROR】_FILE" class="ch.qos.logback.core.rolling.RollingFileAppender">

    <!-- 忽略其他配置 -->

    <!-- 此日志文件只记录 【debug / info / warn / error】 级别的 -->
    <filter class="ch.qos.logback.classic.filter.LevelFilter">
        <level>【debug / info / warn / error】</level>
        <onMatch>ACCEPT</onMatch>
        <onMismatch>DENY</onMismatch>
    </filter>
</appender>
输出到Web页面
我们已经有日志文件.log了,为什么还要这个功能呢?(滑稽脸)为了偷懒!
当我们把项目部署到Linux服务器,当你想看日志文件,还得打开xshell连接,定位到log文件夹,麻烦;如果我们把日志输出到Web页面,当做超级管理员或者测试账号下面的一个功能,点击就开始实时获取生成的日志并输出在Web页面,是不是爽很多呢?
PS:这个功能可得小心使用,因为日志会暴露很多信息
LoggingWSServer
使用WebSocket实现实时获取,建立WebSocket连接后创建一个线程任务,每秒读取一次最新的日志文件,第一次只取后面200行,后面取相比上次新增的行,为了在页面上更加方便的阅读日志,对日志级别单词进行着色(PS:如何创建springboot的websocket,请戳:SpringBoot系列——WebSocket)
package cn.huanzi.qch.springbootlogback; import lombok.extern.slf4j.Slf4j; import org.springframework.beans.factory.annotation.Value; import org.springframework.stereotype.Component; import org.thymeleaf.util.StringUtils; import javax.websocket.*; import javax.websocket.server.ServerEndpoint; import java.io.BufferedReader; import java.io.FileReader; import java.io.IOException; import java.text.SimpleDateFormat; import java.util.Arrays; import java.util.Date; import java.util.Map; import java.util.concurrent.ConcurrentHashMap; /** * WebSocket获取实时日志并输出到Web页面 */ @Slf4j @Component @ServerEndpoint(value = "/websocket/logging", configurator = MyEndpointConfigure.class) public class LoggingWSServer { @Value("${spring.application.name}") private String applicationName; /** * 连接集合 */ private static Map<String, Session> sessionMap = new ConcurrentHashMap<String, Session>(); private static Map<String, Integer> lengthMap = new ConcurrentHashMap<String, Integer>(); /** * 连接建立成功调用的方法 */ @OnOpen public void onOpen(Session session) { //添加到集合中 sessionMap.put(session.getId(), session); lengthMap.put(session.getId(), 1);//默认从第一行开始 //获取日志信息 new Thread(() -> { log.info("LoggingWebSocketServer 任务开始"); boolean first = true; while (sessionMap.get(session.getId()) != null) { BufferedReader reader = null; try { //日志文件路径,获取最新的 String filePath = System.getProperty("user.home") + "/log/" + new SimpleDateFormat("yyyyMMdd").format(new Date()) + "/"+applicationName+".log"; //字符流 reader = new BufferedReader(new FileReader(filePath)); Object[] lines = reader.lines().toArray(); //只取从上次之后产生的日志 Object[] copyOfRange = Arrays.copyOfRange(lines, lengthMap.get(session.getId()), lines.length); //对日志进行着色,更加美观 PS:注意,这里要根据日志生成规则来操作 for (int i = 0; i < copyOfRange.length; i++) { String line = (String) copyOfRange[i]; //先转义 line = line.replaceAll("&", "&") .replaceAll("<", "<") .replaceAll(">", ">") .replaceAll("\"", """); //处理等级 line = line.replace("DEBUG", "<span style='color: blue;'>DEBUG</span>"); line = line.replace("INFO", "<span style='color: green;'>INFO</span>"); line = line.replace("WARN", "<span style='color: orange;'>WARN</span>"); line = line.replace("ERROR", "<span style='color: red;'>ERROR</span>"); //处理类名 String[] split = line.split("]"); if (split.length >= 2) { String[] split1 = split[1].split("-"); if (split1.length >= 2) { line = split[0] + "]" + "<span style='color: #298a8a;'>" + split1[0] + "</span>" + "-" + split1[1]; } } copyOfRange[i] = line; } //存储最新一行开始 lengthMap.put(session.getId(), lines.length); //第一次如果太大,截取最新的200行就够了,避免传输的数据太大 if(first && copyOfRange.length > 200){ copyOfRange = Arrays.copyOfRange(copyOfRange, copyOfRange.length - 200, copyOfRange.length); first = false; } String result = StringUtils.join(copyOfRange, "<br/>"); //发送 send(session, result); //休眠一秒 Thread.sleep(1000); } catch (Exception e) { //捕获但不处理 e.printStackTrace(); } finally { try { reader.close(); } catch (IOException ignored) { } } } log.info("LoggingWebSocketServer 任务结束"); }).start(); } /** * 连接关闭调用的方法 */ @OnClose public void onClose(Session session) { //从集合中删除 sessionMap.remove(session.getId()); lengthMap.remove(session.getId()); } /** * 发生错误时调用 */ @OnError public void onError(Session session, Throwable error) { error.printStackTrace(); } /** * 服务器接收到客户端消息时调用的方法 */ @OnMessage public void onMessage(String message, Session session) { } /** * 封装一个send方法,发送消息到前端 */ private void send(Session session, String message) { try { session.getBasicRemote().sendText(message); } catch (Exception e) { e.printStackTrace(); } } }
HTML页面
页面收到数据就追加到div中,为了方便新增了几个功能:
清屏,清空div内容
滚动至底部、将div的滚动条滑到最下面
开启/关闭自动滚动,div新增内容后自动将滚动条滑到最下面,点一下开启,再点关闭,默认关闭
PS:引入公用部分,就是一些jquery等常用静态资源
<!DOCTYPE>
<!--解决idea thymeleaf 表达式模板报红波浪线-->
<!--suppress ALL -->
<html xmlns:th="http://www.thymeleaf.org">
<head>
    <meta charset="UTF-8">
    <title>IMS实时日志</title>

    <!-- 引入公用部分 -->
    <script th:replace="head::static"></script>

</head>
<body>
<!-- 标题 -->
<h1 style="text-align: center;">IMS实时日志</h1>

<!-- 显示区 -->
<div id="loggingText" contenteditable="true"
     style="width:100%;height: 600px;background-color: ghostwhite; overflow: auto;"></div>

<!-- 操作栏 -->
<div style="text-align: center;">
    <button onclick="$('#loggingText').text('')" style="color: green; height: 35px;">清屏</button>
    <button onclick="$('#loggingText').animate({scrollTop:$('#loggingText')[0].scrollHeight});"
            style="color: green; height: 35px;">滚动至底部
    </button>
    <button onclick="if(window.loggingAutoBottom){$(this).text('开启自动滚动');}else{$(this).text('关闭自动滚动');};window.loggingAutoBottom = !window.loggingAutoBottom"
            style="color: green; height: 35px; ">开启自动滚动
    </button>
</div>
</body>
<script th:inline="javascript">
    //websocket对象
    let websocket = null;

    //判断当前浏览器是否支持WebSocket
    if ('WebSocket' in window) {
        websocket = new WebSocket("ws://localhost:10086/websocket/logging");
    } else {
        console.error("不支持WebSocket");
    }

    //连接发生错误的回调方法
    websocket.onerror = function (e) {
        console.error("WebSocket连接发生错误");
    };

    //连接成功建立的回调方法
    websocket.onopen = function () {
        console.log("WebSocket连接成功")
    };

    //接收到消息的回调方法
    websocket.onmessage = function (event) {
        //追加
        if (event.data) {

            //日志内容
            let $loggingText = $("#loggingText");
            $loggingText.append(event.data);

            //是否开启自动底部
            if (window.loggingAutoBottom) {
                //滚动条自动到最底部
                $loggingText.scrollTop($loggingText[0].scrollHeight);
            }
        }
    }

    //连接关闭的回调方法
    websocket.onclose = function () {
        console.log("WebSocket连接关闭")
    };
</script>
</html>
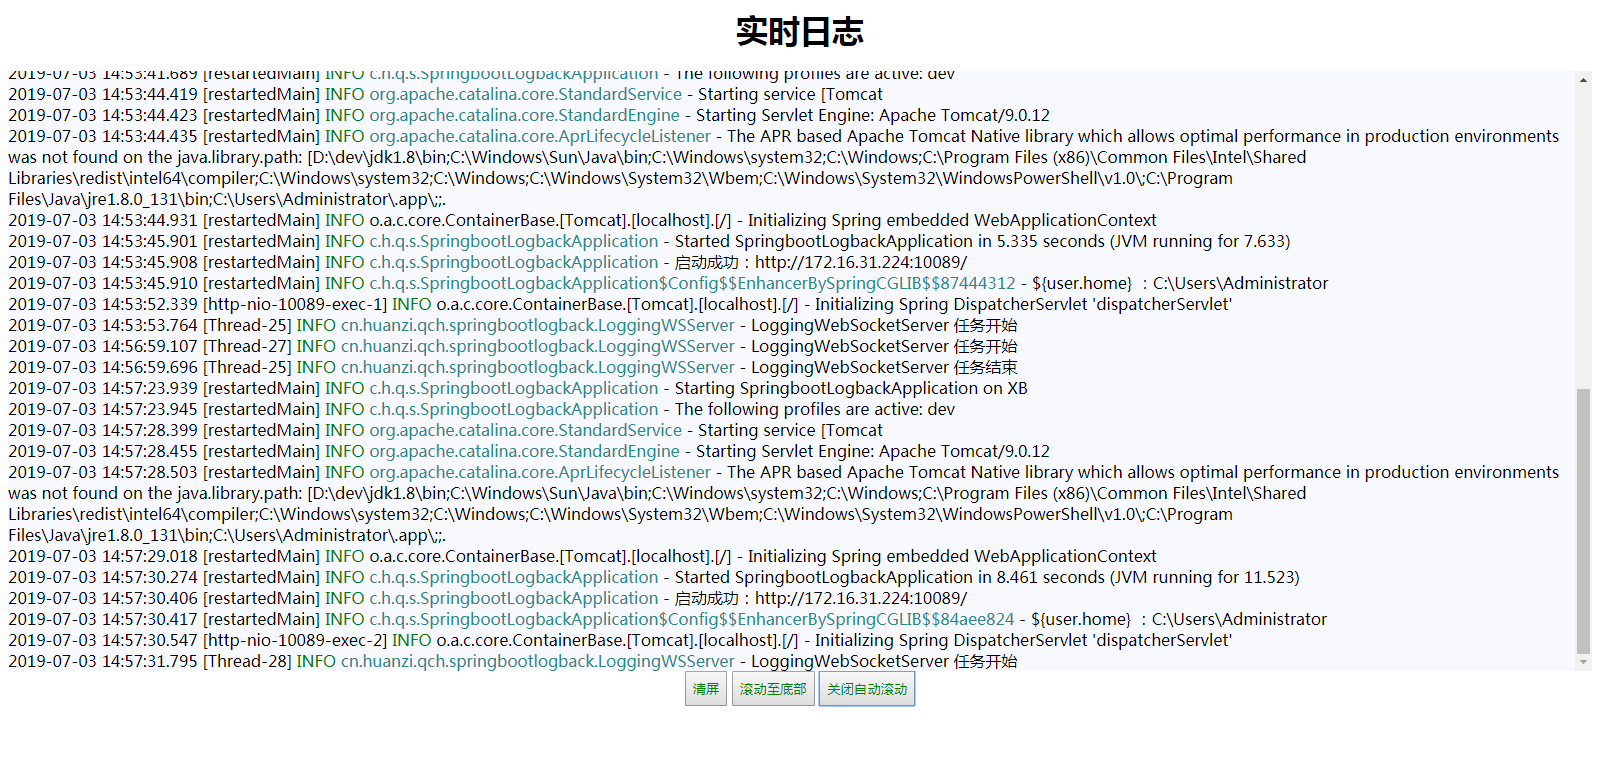
效果展示
后记
有了日志记录,我们以后写代码时就要注意了,应使用下面的正确示例
//错误示例,这样写只会输出到控制台,不会输出到日志中
System.out.println("XXX");
e.printStackTrace();

//正确示例,既输出到控制台,又输出到日志
log.info("XXX");
log.error("XXX报错",e);
SpringBoot日志暂时先记录到这里,点击官网了解更多:https://docs.spring.io/spring-boot/docs/2.1.5.RELEASE/reference/htmlsingle/#boot-features-logging
补充
2019-07-03补充:我们之前只对日志等级关键字进行着色,还是觉得不够,因此又新增了类名着色跟HTML转义
主要修改:

效果:
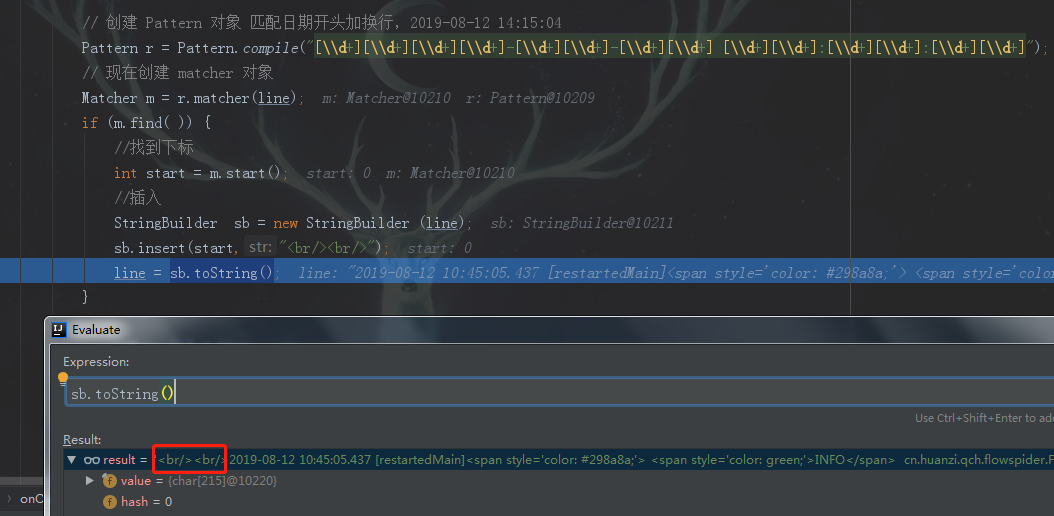
2019-08-12补充:我发现有时候显示的时候,换行不太准确,我们原先是在行末追加<br/>,但有时候读取出来的一行记录是自动换行后的数据,页面显示效果很丑

因此我改成用正则([\d+][\d+][\d+][\d+]-[\d+][\d+]-[\d+][\d+] [\d+][\d+]:[\d+][\d+]:[\d+][\d+])去匹配日期,然后再对应的起始下标插入<br/>,从而达到与控制台输出类似的效果

匹配、插入结果
页面效果
异步输出日志
异步输出日志的方式很简单,添加一个基于异步写日志的appender,并指向原先配置的appender即可
    <!-- 将文件输出设置成异步输出 -->
    <appender name="ASYNC-FILE" class="ch.qos.logback.classic.AsyncAppender">
        <!-- 不丢失日志.默认的,如果队列的80%已满,则会丢弃TRACT、DEBUG、INFO级别的日志 -->
        <discardingThreshold>0</discardingThreshold>
        <!-- 更改默认的队列的深度,该值会影响性能.默认值为256 -->
        <queueSize>256</queueSize>
        <!-- 添加附加的appender,最多只能添加一个 -->
        <appender-ref ref="FILE"/>
    </appender>

    <!-- 将控制台输出设置成异步输出 -->
    <appender name="ASYNC-CONSOLE" class="ch.qos.logback.classic.AsyncAppender">
        <!-- 不丢失日志.默认的,如果队列的80%已满,则会丢弃TRACT、DEBUG、INFO级别的日志 -->
        <discardingThreshold>0</discardingThreshold>
        <!-- 更改默认的队列的深度,该值会影响性能.默认值为256 -->
        <queueSize>256</queueSize>
        <!-- 添加附加的appender,最多只能添加一个 -->
        <appender-ref ref="CONSOLE"/>
    </appender>
原理很简单,主线程将日志扔到阻塞队列中,然后IO操作日志写入文件是通过新起一个线程去完成的
2020-05-26补充
e.printStackTrace();会打出详细异常,异常名称,出错位置,便于调试用,但直接调用会输出到std.err,并没有输出到日志文件中,因此需要先输出到流中再转成字符串
封装工具类
import java.io.IOException;
import java.io.PrintWriter;
import java.io.StringWriter;

/**
 * 捕获报错日志处理工具类
 */
public class ErrorUtil {

    /**
     * Exception出错的栈信息转成字符串
     * 用于打印到日志中
     */
    public static String errorInfoToString(Throwable e) {
        StringWriter sw = null;
        PrintWriter pw = null;
        try {
            sw = new StringWriter();
            pw = new PrintWriter(sw);
            // 将出错的栈信息输出到printWriter中
            e.printStackTrace(pw);
            pw.flush();
            sw.flush();
        } finally {
            if (sw != null) {
                try {
                    sw.close();
                } catch (IOException e1) {
                    e1.printStackTrace();
                }
            }
            if (pw != null) {
                pw.close();
            }
        }
        return sw.toString();
    }
}
也可以使用骚操作简化代码
    public static String errorInfoToString(Throwable e) {
        //try-with-resource语法糖 处理机制
        try(StringWriter sw = new StringWriter();PrintWriter pw = new PrintWriter(sw)){
            e.printStackTrace(pw);
            pw.flush();
            sw.flush();
            return sw.toString();
        }catch (Exception ignored){
            throw new RuntimeException(ignored.getMessage(),ignored);
        }
    }
使用
try {
            //省略其他代码
} catch (Throwable e) {
            //之前的操作,输出控制台
            e.printStackTrace();

            //输出到日志文件中
            log.error(ErrorUtil.errorInfoToString(e));
}
配置访问日志
2020-08-04更新
SpringBoot默认使用内置Tomcat,那么我们如何配置Tomcat的Access Logging呢?
详情可查看官方文档:
SpringBoot配置介绍:https://docs.spring.io/spring-boot/docs/2.1.0.RELEASE/reference/htmlsingle/#howto-configure-accesslogs
Apache Tomcat配置介绍:https://tomcat.apache.org/tomcat-8.5-doc/config/valve.html#Access_Logging
SpringBoot对Access Log的默认配置
server.tomcat.accesslog.buffered=true # Whether to buffer output such that it is flushed only periodically.
server.tomcat.accesslog.directory=logs # Directory in which log files are created. Can be absolute or relative to the Tomcat base dir.
server.tomcat.accesslog.enabled=false # Enable access log.
server.tomcat.accesslog.file-date-format=.yyyy-MM-dd # Date format to place in the log file name.
server.tomcat.accesslog.pattern=common # Format pattern for access logs.
server.tomcat.accesslog.prefix=access_log # Log file name prefix.
server.tomcat.accesslog.rename-on-rotate=false # Whether to defer inclusion of the date stamp in the file name until rotate time.
server.tomcat.accesslog.request-attributes-enabled=false # Set request attributes for the IP address, Hostname, protocol, and port used for the request.
server.tomcat.accesslog.rotate=true # Whether to enable access log rotation.
server.tomcat.accesslog.suffix=.log # Log file name suffix.
日志格式说明(摘自上方Apache Tomcat配置介绍官方文档)
Values for the pattern attribute are made up of literal text strings, combined with pattern identifiers prefixed by the "%" character to cause replacement by the corresponding variable value from the current request and response. The following pattern codes are supported:
- %a - Remote IP address
- %A - Local IP address
- %b - Bytes sent, excluding HTTP headers, or '-' if zero
- %B - Bytes sent, excluding HTTP headers
- %h - Remote host name (or IP address if
enableLookupsfor the connector is false) - %H - Request protocol
- %l - Remote logical username from identd (always returns '-')
- %m - Request method (GET, POST, etc.)
- %p - Local port on which this request was received. See also
%{xxx}pbelow. - %q - Query string (prepended with a '?' if it exists)
- %r - First line of the request (method and request URI)
- %s - HTTP status code of the response
- %S - User session ID
- %t - Date and time, in Common Log Format
- %u - Remote user that was authenticated (if any), else '-'
- %U - Requested URL path
- %v - Local server name
- %D - Time taken to process the request in millis. Note: In httpd %D is microseconds. Behaviour will be aligned to httpd in Tomcat 10 onwards.
- %T - Time taken to process the request, in seconds. Note: This value has millisecond resolution whereas in httpd it has second resolution. Behaviour will be align to httpd in Tomcat 10 onwards.
- %F - Time taken to commit the response, in millis
- %I - Current request thread name (can compare later with stacktraces)
- %X - Connection status when response is completed:
X= Connection aborted before the response completed.+= Connection may be kept alive after the response is sent.-= Connection will be closed after the response is sent.
There is also support to write information incoming or outgoing headers, cookies, session or request attributes and special timestamp formats. It is modeled after the Apache HTTP Server log configuration syntax. Each of them can be used multiple times with different xxx keys:
%{xxx}iwrite value of incoming header with namexxx%{xxx}owrite value of outgoing header with namexxx%{xxx}cwrite value of cookie with namexxx%{xxx}rwrite value of ServletRequest attribute with namexxx%{xxx}swrite value of HttpSession attribute with namexxx%{xxx}pwrite local (server) port (xxx==local) or remote (client) port (xxx=remote)%{xxx}twrite timestamp at the end of the request formatted using the enhanced SimpleDateFormat patternxxx
All formats supported by SimpleDateFormat are allowed in %{xxx}t. In addition the following extensions have been added:
sec- number of seconds since the epochmsec- number of milliseconds since the epochmsec_frac- millisecond fraction
These formats cannot be mixed with SimpleDateFormat formats in the same format token.
Furthermore one can define whether to log the timestamp for the request start time or the response finish time:
beginor prefixbegin:chooses the request start timeendor prefixend:chooses the response finish time
By adding multiple %{xxx}t tokens to the pattern, one can also log both timestamps.
The shorthand pattern pattern="common" corresponds to the Common Log Format defined by '%h %l %u %t "%r" %s %b'.
The shorthand pattern pattern="combined" appends the values of the Referer and User-Agent headers, each in double quotes, to the common pattern.
When Tomcat is operating behind a reverse proxy, the client information logged by the Access Log Valve may represent the reverse proxy, the browser or some combination of the two depending on the configuration of Tomcat and the reverse proxy. For Tomcat configuration options see Proxies Support and the Proxy How-To. For reverse proxies that use mod_jk, see the generic proxy documentation. For other reverse proxies, consult their documentation.
我们只需要配置以下几个简单配置即可
#开启内置Tomcat请求日志 access.log
server.tomcat.accesslog.enabled=true
#日志格式
server.tomcat.accesslog.pattern=%h %l %u %t "%r" %s %b
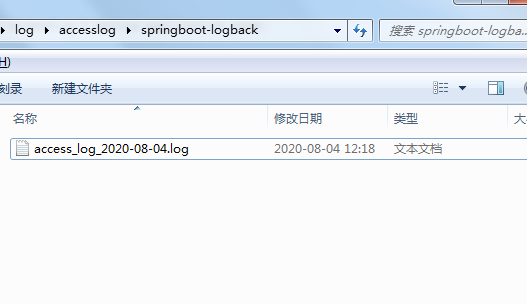
#日志输出目录
server.tomcat.accesslog.directory=${user.home}/log/accesslog/${spring.application.name}
#日志文件名
server.tomcat.accesslog.prefix=access_log
server.tomcat.accesslog.file-date-format=_yyyy-MM-dd
server.tomcat.accesslog.suffix=.log
效果
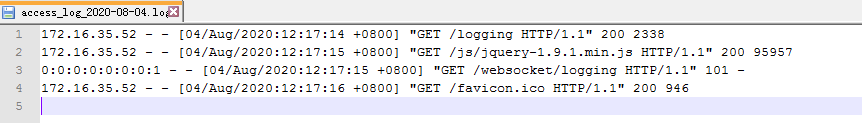
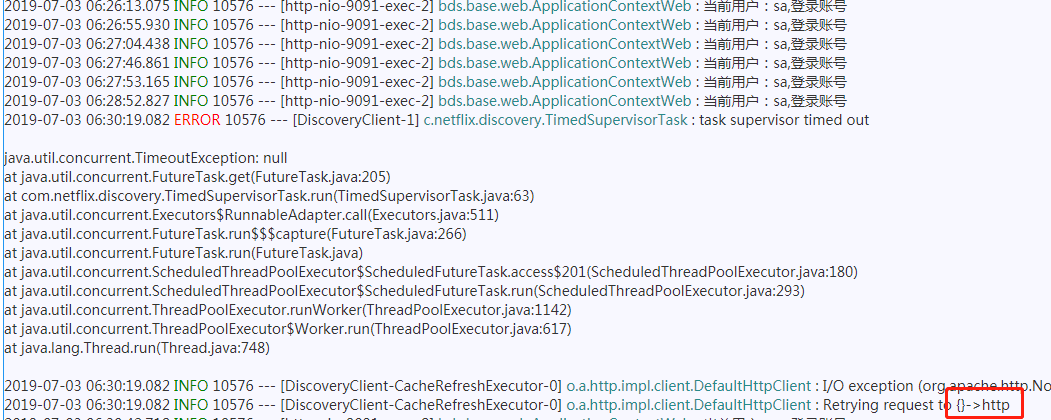
如何接口统计QPS?
如上图中,logging接口,我们只要统计同一秒中,logging接口的请求次数即是该接口的QPS
更新、补充
2021-07-20更新
问题:如果不重启项目就不会生成新的日志文件,全部日志都打印到了开始运行项目的那一天的日志文件中
原因:TimeBasedRollingPolicy 是基于时间的,不能和其他策略一起组合使用
解决:去掉组合策略 triggeringPolicy
修改前

修改后
如果要用.%i.log,rollingPolicy需要替换class:
<rollingPolicy class="ch.qos.logback.core.rolling.SizeAndTimeBasedRollingPolicy">

</rollingPolicy>
代码开源
代码已经开源、托管到我的GitHub、码云:
版权声明
捐献、打赏

支付宝

微信
交流群


 浙公网安备 33010602011771号