
Vue +echart 组件化实例(yuqing)
Vue +echart 组件化实例
git链接:https://gitee.com/HuaWang400/yuqing_front(前端)
后端:https://gitee.com/HuaWang400/yuqing-backend
后端基础response
return :{
        "code": "状态码",
        "data": "相关数据",
        "error": "错误信息"
         }
1 饼图(图例垂直滑动)
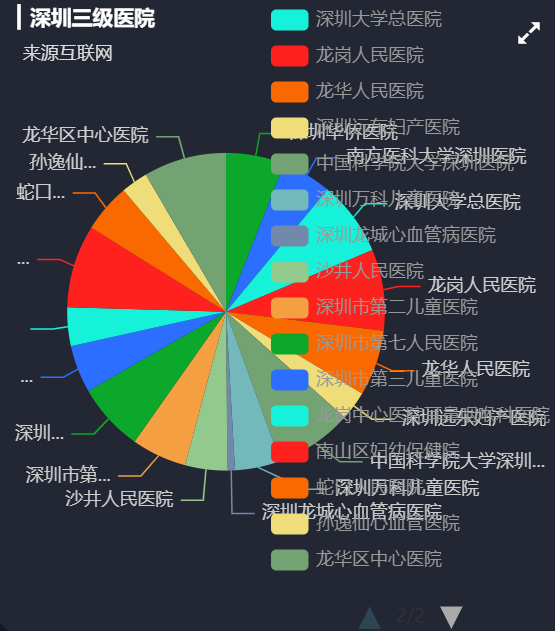
data
res.data= [
        {
            "hospital_id": 1,
            "hospital__short_name": "深圳华侨医院",
            "news_count": 149
        },
        {
            "hospital_id": 2,
            "hospital__short_name": "南方医科大学深圳医院",
            "news_count": 126
        },
        .....
        ]
vue组件


// 医院新闻总数统计
<template>
  <div class="com-container">
    <div class="com-chart" ref="HospitalNewsCount_ref"></div>
  </div>
</template>

<script>
import { mapState } from "vuex";
export default {
  data() {
    return {
      chartInstance: null, //echarts实例对象
      alldata: null, //服务器获取的所有数据
    };
  },
  computed: { ...mapState(["theme"]) },
  watch: {
    theme() {
      this.chartInstance.dispose();
      this.initChart();
      this.screenAdapter();
      this.updateChart();
    },
  },

  mounted() {
    this.initChart();
    this.getData();
    window.addEventListener("resize", this.screenAdapter);
    // 在页面加载完成的时候, 主动进行屏幕的适配
    this.screenAdapter();
  },
  destroyed() {
    // 在组件销毁的时候, 需要将监听器取消掉
    window.removeEventListener("resize", this.screenAdapter);
  },
  methods: {
    // 初始化echartInstance对象
    initChart() {
      this.chartInstance = this.$echarts.init(
        this.$refs.HospitalNewsCount_ref,
        this.theme
      );
      // 对图表初始化配置的控制
      const initOption = {
        title: {
          text: "▎深圳三级医院",
          subtext: " 来源互联网",
          left: 10,
          top: 10,
        },
        tooltip: {
          trigger: "item",
          formatter: "{a} <br/>{b} : {c} ({d}%)",
        },
        legend: {
          type: "scroll",
          orient: "vertical",
          right: 10,
          top: 10,
          bottom: 10,
        },
        series: [
          {
            name: "医院",
            type: "pie",
            radius: "55%",
            center: ["40%", "50%"],
            emphasis: {
              itemStyle: {
                shadowBlur: 10,
                shadowOffsetX: 0,
                shadowColor: "rgba(0, 0, 0, 0.5)",
              },
            },
          },
        ],
      };
      this.chartInstance.setOption(initOption);
    },
    //获取服务器的数据
    async getData() {
      const { data: ret } = await this.$http.get("map/hospitalnewscount");
      this.alldata = ret.data;
      this.updateChart();
    },
    //更新图表
    updateChart() {
      const HospitalNames = this.alldata.map((item) => {
        return item.hospital__short_name;
      });
      const HospitalnewsCount = this.alldata.map((item) => {
        return { name: item.hospital__short_name, value: item.news_count };
      });
      //   console.log(HospitalNames)
      //   console.log(HospitalnewsCount)

      const dataOption = {
        legend: {
          data: HospitalNames,
        },
        series: [
          {
            data: HospitalnewsCount,
          },
        ],
      };
      this.chartInstance.setOption(dataOption);
    },
    // 当浏览器的大小发生变化的时候, 会调用的方法, 来完成屏幕的适配
    screenAdapter() {
      const titleFontSize =
        (this.$refs.HospitalNewsCount_ref.offsetWidth / 100) * 3.6;
      // 和分辨率大小相关的配置项
      const adapterOption = {
        title: {
          textStyle: {
            fontSize: titleFontSize,
          },
        },
        tooltip: {
          axisPointer: {
            lineStyle: {
              width: titleFontSize,
            },
          },
        },
        series: [
          {
            barWidth: titleFontSize,
            itemStyle: {
              barBorderRadius: [0, titleFontSize / 2, titleFontSize / 2, 0],
            },
          },
        ],
      };
      this.chartInstance.setOption(adapterOption);
      // 手动的调用图表对象的resize 才能产生效果
      this.chartInstance.resize();
    },
  },
};
</script>

<style>
</style>
2 南丁格尔图
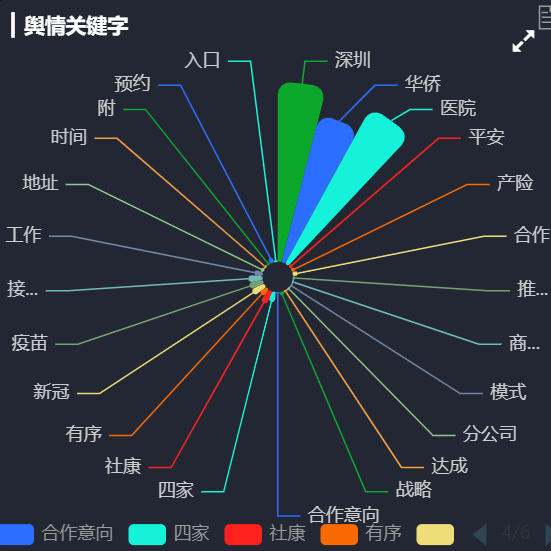
data
res.data=[
        {
            "name": "深圳",
            "value": 99
        },
        {
            "name": "华侨",
            "value": 84
        }...]
vue组件
// 舆情关键词分布
<template>
  <div class="com-container">
    <div class="com-chart" ref="NewsKeyWord_ref"></div>
  </div>
</template>
<script>
import { mapState } from "vuex";

export default {
  data() {
    return {
      chartInstance: null, //echarts实例对象
      alldata: null, //服务器获取的所有数据
    };
  },
  computed: { ...mapState(["theme"]) },
  watch: {
    theme() {
      this.chartInstance.dispose();
      this.initChart();
      this.screenAdapter();
      this.updateChart();
    },
  },
  mounted() {

    this.initChart();
    this.getData();
    window.addEventListener("resize", this.screenAdapter);
    // 在页面加载完成的时候, 主动进行屏幕的适配
    this.screenAdapter();
  },
  destroyed() {
    // 在组件销毁的时候, 需要将监听器取消掉
    window.removeEventListener("resize", this.screenAdapter);
  },
  methods: {
    // 初始化echartInstance对象
    initChart() {
      this.chartInstance = this.$echarts.init(this.$refs.NewsKeyWord_ref, this.theme);
      // 对图表初始化配置的控制
      const initOption = {
        title: {
          text: "▎舆情关键字",
          left: 10,
          top: 10,
        },
        legend: {
          type: 'scroll',
        orient: 'horizontal',
        bottom: '1%'
    },
    toolbox: {
        show: true,
        feature: {
            mark: {show: true},
            dataView: {show: true, readOnly: false},
            // restore: {show: true},
            // saveAsImage: {show: true}
        }
    },
    series: [
        {
            name: '情感分析',
            type: 'pie',
            radius: [10, 130],
            center: ['50%', '50%'],
            roseType: 'area',
            itemStyle: {
                borderRadius: 8
            },
            data: [

            ]
        }
    ]


      };
      this.chartInstance.setOption(initOption);
    },
    //获取服务器的数据
    async getData() {
      // http://127.0.0.1:8000/api/map/NewsKeyword/1
      const { data: ret } = await this.$http.get("map/news_keyword_rank/1");
      this.alldata = ret;
      // console.log(this.alldata)
      this.updateChart();
    },
    //更新图表
    updateChart() {
      const NewsKeywordNames = this.alldata.data.type;
      const NewsKeywordnewsCount = this.alldata.data.count;
      const dataOption = {
        series: [
          {
            data: this.alldata.data,
          },
        ],
      };
      this.chartInstance.setOption(dataOption);
    },
    // 当浏览器的大小发生变化的时候, 会调用的方法, 来完成屏幕的适配
    screenAdapter() {
      //   console.log(this.$refs.media_ref.offsetWidth)
      const titleFontSize = (this.$refs.NewsKeyWord_ref.offsetWidth / 100) * 3.6;
      // 和分辨率大小相关的配置项
      const adapterOption = {
        title: {
          textStyle: {
            fontSize: titleFontSize,
          },
        },
        tooltip: {
          axisPointer: {
            lineStyle: {
              width: titleFontSize,
            },
          },
        },
        series: [
          {
            barWidth: titleFontSize,
            itemStyle: {
              barBorderRadius: [0, titleFontSize / 2, titleFontSize / 2, 0],
            },
          },
        ],
      };
      this.chartInstance.setOption(adapterOption);
      // 手动的调用图表对象的resize 才能产生效果
      this.chartInstance.resize();
    },
  },
};
</script>

<style>
</style>
3 词云图

data
res.data=[
        {
            "name": "深圳",
            "value": 99
        },
        {
            "name": "华侨",
            "value": 84
        }...]
vue
导入echarts-wordcloud
 <script src="static/lib/echarts.min.js"></script>
  <script src="static/lib/echarts-wordcloud.min.js"></script>
  <script src="static/theme/chalk.js"></script>
  <script src="static/theme/vintage.js"></script>
// 关键字云图展示
<template>
  <div class="com-container">
    <div class="com-chart" ref="yuntu_ref"></div>
  </div>
</template>

<script>
import { mapState } from "vuex";


export default {
  data() {
    return {
      chartInstance: null, //echarts实例对象
      alldata: null, //服务器获取的所有数据
    };
  },
  computed: { ...mapState(["theme"]) },
  watch: {
    theme() {
      this.chartInstance.dispose();
      this.initChart();
      this.screenAdapter();
      this.updateChart();
    },
  },
  mounted() {
    this.initChart();
    this.getData();

    window.addEventListener("resize", this.screenAdapter);
    在页面加载完成的时候, 主动进行屏幕的适配
    this.screenAdapter();
  },
  destroyed() {
    // 在组件销毁的时候, 需要将监听器取消掉
    window.removeEventListener("resize", this.screenAdapter);
  },
  methods: {
    // 初始化echartInstance对象
    initChart() {
      this.chartInstance = this.$echarts.init(this.$refs.yuntu_ref, this.theme);

      const initOption = {
        tooltip: {},
        series: [
          {
            type: "wordCloud",
            gridSize: 1,  //网格大小越大,单词之间的差距就越大
            sizeRange: [12,60], //文字大小范围
            rotationRange: [-45, 0, 45, 90],
            // shape: "pentagon", // circle,pentagon
             width: '100%',
            height: '100%',
            // drawOutOfBound: true,
            textStyle: {
              color: function () {
                return (
                  "rgb(" +
                  [
                    Math.round(Math.random() * 160),
                    Math.round(Math.random() * 160),
                    Math.round(Math.random() * 160),
                  ].join(",") +
                  ")"
                );
              },
            },
            emphasis: {
              textStyle: {
                shadowBlur: 10,
                shadowColor: "#333",
              },
            },
            data: [],
          },
        ],
      };
      this.chartInstance.setOption(initOption);
    },
    //获取服务器的数据
    async getData() {
      // http://127.0.0.1:8000/api/map/media/1
      const { data: ret } = await this.$http.get("map/news_yuntu/1");
      this.alldata = ret;
    //   console.log(this.alldata)

      this.updateChart();
    },
    //更新图表
    updateChart() {
      const data = this.alldata.data;

      const dataOption = {
        series: [
          {
            data: data,
          },
        ],
      };
      this.chartInstance.setOption(dataOption);
    },
    // 当浏览器的大小发生变化的时候, 会调用的方法, 来完成屏幕的适配
    screenAdapter() {
      //   console.log(this.$refs.media_ref.offsetWidth)
      const titleFontSize = (this.$refs.yuntu_ref.offsetWidth / 100) * 3.6;
      // 和分辨率大小相关的配置项
      const adapterOption = {
        title: {
          textStyle: {
            fontSize: titleFontSize,
          },
        },
        tooltip: {
          axisPointer: {
            lineStyle: {
              width: titleFontSize,
            },
          },
        },
        series: [
          {
            barWidth: titleFontSize,
            itemStyle: {
              barBorderRadius: [0, titleFontSize / 2, titleFontSize / 2, 0],
            },
          },
        ],
      };
      this.chartInstance.setOption(adapterOption);

       // 手动的调用图表对象的resize 才能产生效果
      this.chartInstance.resize();
    },
  },
};
</script>

<style lang="less" scoped>
</style>
4 折线图-柱状图切换
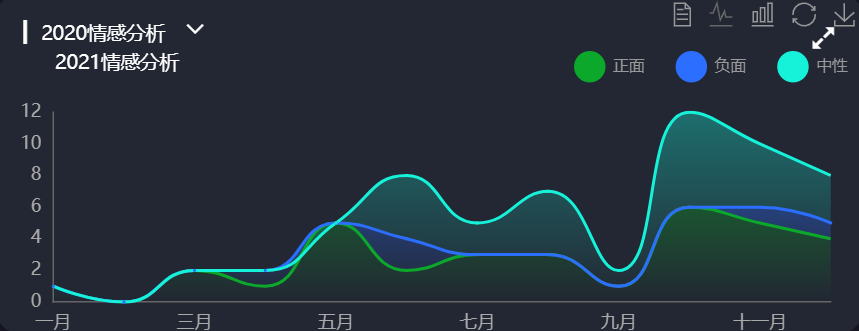
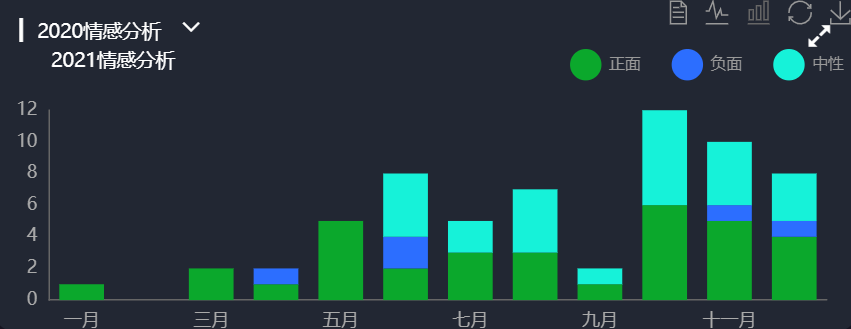
data
res.data={
            "2020":{
            title:"2020舆情数量统计",
            "util":"条",
            "data":[
                    {"name":"正面","data":[1-12月份数据]},
                    {"name":"负面","data":[1-12月份数据]},
                    {"name":"中性","data":[1-12月份数据]},
                   ]
            },

            "2021":{}
            "common": {"month": ["一月", "二月", "三月", "四月", "五月", "六月", "七月", "八月", "九月", "十月", "十一月", "十二月"]}
            "type": [{"key": "2020","text": "2020舆情数量统计"},{"key": "2021","text": "2021舆情数量统计"}]
        }
vue
//舆情情感统计 <template> <div class="com-container"> <div class="title" :style="comStyle"> <span style="font-size: small">{{ "▎ " + showTitle }}</span> <span class="iconfont title-icon" :style="comStyle" @click="showChoice = !showChoice" ></span > <div class="select-con" v-show="showChoice" :style="marginStyle"> <div class="select-item" style="font-size: small" v-for="item in selectTypes" :key="item.key" @click="handleSelect(item.key)" > {{ item.text }} </div> </div> </div> <div class="com-chart" ref="trend_ref"></div> </div> </template> <script> import { mapState } from "vuex"; import { getThemeValue } from '@/utils/theme_utils' export default { data() { return { chartInstane: null, allData: null, // 从服务器中获取的所有数据 showChoice: false, // 是否显示可选项 choiceType: "2021", // 显示的数据类型 titleFontSize: 0, // 指明标题的字体大小 }; }, // computed: { ...mapState(["theme"]) }, mounted() { this.initChart(); this.getData(); window.addEventListener("resize", this.screenAdapter); this.screenAdapter(); }, destroyed() { window.removeEventListener("resize", this.screenAdapter); }, computed: { selectTypes() { if (!this.allData) { return []; } else { return this.allData.type.filter((item) => { return item.key !== this.choiceType; }); } }, showTitle() { if (!this.allData) { return ""; } else { return this.allData[this.choiceType].title; } }, // 设置给标题的样式 comStyle() { return { fontSize: this.titleFontSize + "px", }; }, marginStyle() { return { marginLeft: this.titleFontSize + "px", }; }, ...mapState(["theme"]), comStyle () { return { fontSize: this.titleFontSize + 'px', color: getThemeValue(this.theme).titleColor } }, }, methods: { initChart() { this.chartInstane = this.$echarts.init(this.$refs.trend_ref, this.theme); const initOption = { grid: { left: "3%", top: "35%", right: "4%", bottom: "1%", containLabel: true, }, tooltip: { trigger: "axis", }, toolbox: { show: true, feature: { dataView: { show: true, readOnly: false }, magicType: { show: true, type: ["line", "bar"] }, restore: { show: true }, saveAsImage: { show: true }, }, }, legend: { right: 7, top: "15%", icon: "circle", }, xAxis: { type: "category", boundaryGap: false, }, yAxis: { type: "value", }, }; this.chartInstane.setOption(initOption); }, async getData() { // await this.$http.get() // 对allData进行赋值 const { data: ret } = await this.$http.get("map/news_polarity/1"); this.allData = ret; // console.log(this.allData) this.updateChart(); }, updateChart() { // 半透明的颜色值 const colorArr1 = [ "rgba(11, 168, 44, 0.5)", "rgba(44, 110, 255, 0.5)", "rgba(22, 242, 217, 0.5)", "rgba(254, 33, 30, 0.5)", "rgba(250, 105, 0, 0.5)", ]; // 全透明的颜色值 const colorArr2 = [ "rgba(11, 168, 44, 0)", "rgba(44, 110, 255, 0)", "rgba(22, 242, 217, 0)", "rgba(254, 33, 30, 0)", "rgba(250, 105, 0, 0)", ]; // 处理数据 // 类目轴的数据 const timeArr = this.allData.common.month; // y轴的数据 series下的数据 const valueArr = this.allData[this.choiceType].data; const seriesArr = valueArr.map((item, index) => { return { name: item.name, type: "line", data: item.data, stack: this.choiceType, areaStyle: { color: new this.$echarts.graphic.LinearGradient(0, 0, 0, 1, [ { offset: 0, color: colorArr1[index], }, // %0的颜色值 { offset: 1, color: colorArr2[index], }, // 100%的颜色值 ]), }, }; }); // 图例的数据 const legendArr = valueArr.map((item) => { return item.name; }); const dataOption = { xAxis: { data: timeArr, }, legend: { data: legendArr, }, series: seriesArr, }; this.chartInstane.setOption(dataOption); }, screenAdapter() { this.titleFontSize = (this.$refs.trend_ref.offsetWidth / 100) * 3.6; const adapterOption = { legend: { itemWidth: this.titleFontSize, itemHeight: this.titleFontSize, itemGap: this.titleFontSize, textStyle: { fontSize: this.titleFontSize / 2, }, }, }; this.chartInstane.setOption(adapterOption); this.chartInstane.resize(); }, handleSelect(currentType) { this.choiceType = currentType; this.updateChart(); this.showChoice = false; }, }, watch: { theme() { this.chartInstane.dispose(); this.initChart(); this.screenAdapter(); this.updateChart(); }, }, }; </script> <style lang="less" scoped> .title { position: absolute; left: 20px; top: 10px; z-index: 10; color: white; .title-icon { margin-left: 10px; cursor: pointer; } .select-con { background-color: #222733; } } </style>
5 折线图
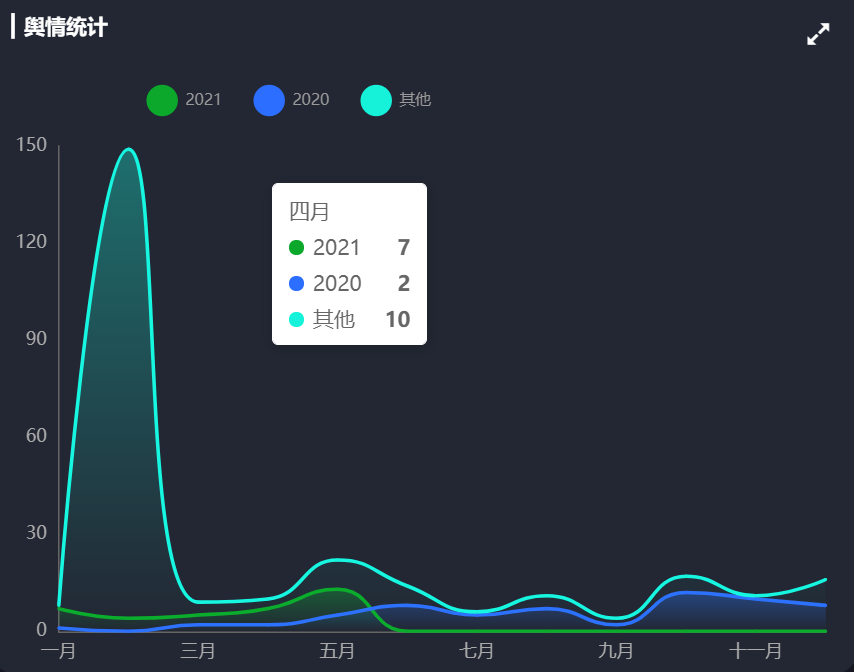
data
res.data={
            "year_news_total":200,
            "common": {"month": ["一月", "二月", "三月", "四月", "五月", "六月", "七月", "八月", "九月", "十月", "十一月", "十二月"],"year":[2021]}
            "year_news_analyse":[{"name":"2020","data":[十二个月的新闻统计]},{"name":"2021",data:[]},{"name":"其他",data:[]}]
            }
vue
<template>
  <div class="com-container">
    <div class="com-chart" ref="trend_ref"></div>
  </div>
</template>

<script>
import { mapState } from "vuex";

export default {
  data() {
    return {
      chartInstane: null,
      allData: null, // 从服务器中获取的所有数据
    };
  },

  mounted() {
    this.initChart();
    this.getData();
    window.addEventListener("resize", this.screenAdapter);
    this.screenAdapter();
  },
  destroyed() {
    window.removeEventListener("resize", this.screenAdapter);
  },
  methods: {
    initChart() {
      this.chartInstane = this.$echarts.init(this.$refs.trend_ref, this.theme);
      const initOption = {
        title: {
          text: "▎舆情统计",
          left: 10,
          top: 15,
          textStyle: {
            fontSize: 14,
          },
        },
        grid: {
          left: "3%",
          top: "23%",
          right: "4%",
          bottom: "2%",
          containLabel: true,
        },
        tooltip: {
          trigger: "axis",
        },
        legend: {
          left: 100,
          top: "13%",
          icon: "circle",
        },
        xAxis: {
          type: "category",
          boundaryGap: false,
        },
        yAxis: {
          type: "value",
        },
      };
      this.chartInstane.setOption(initOption);
    },
    async getData() {
      // await this.$http.get()
      // 对allData进行赋值
      const { data: ret } = await this.$http.get("/map/news_number_analyse/1");
      this.allData = ret.data;
      //   console.log(this.allData)
      this.updateChart();
    },
    updateChart() {
      // 半透明的颜色值
      const colorArr1 = [
        "rgba(11, 168, 44, 0.5)",
        "rgba(44, 110, 255, 0.5)",
        "rgba(22, 242, 217, 0.5)",
        "rgba(254, 33, 30, 0.5)",
        "rgba(250, 105, 0, 0.5)",
      ];
      // 全透明的颜色值
      const colorArr2 = [
        "rgba(11, 168, 44, 0)",
        "rgba(44, 110, 255, 0)",
        "rgba(22, 242, 217, 0)",
        "rgba(254, 33, 30, 0)",
        "rgba(250, 105, 0, 0)",
      ];
      // 处理数据
      // 类目轴的数据
      const timeArr = this.allData.common.month;
      //   console.log(timeArr)
      // y轴的数据 series下的数据
      const valueArr = this.allData.year_news_analyse;
      const seriesArr = valueArr.map((item, index) => {
        return {
          name: item.name,
          type: "line",
          data: item.data,
          areaStyle: {
            color: new this.$echarts.graphic.LinearGradient(0, 0, 0, 1, [
              {
                offset: 0,
                color: colorArr1[index],
              }, // %0的颜色值
              {
                offset: 1,
                color: colorArr2[index],
              }, // 100%的颜色值
            ]),
          },
        };
      });
      // 图例的数据
      const legendArr = valueArr.map((item) => {
        return item.name;
      });
      const dataOption = {
        xAxis: {
          data: timeArr,
        },
        legend: {
          data: legendArr,
        },
        series: seriesArr,
      };
      this.chartInstane.setOption(dataOption);
    },
    screenAdapter() {
      this.titleFontSize = (this.$refs.trend_ref.offsetWidth / 100) * 3.6;
      const adapterOption = {
        legend: {
          itemWidth: this.titleFontSize,
          itemHeight: this.titleFontSize,
          itemGap: this.titleFontSize,
          textStyle: {
            fontSize: this.titleFontSize / 2,
          },
        },
      };
      this.chartInstane.setOption(adapterOption);
      this.chartInstane.resize();
    },
    handleSelect(currentType) {
      this.choiceType = currentType;
      this.updateChart();
      this.showChoice = false;
    },
  },
  computed: { ...mapState(["theme"]) },
  watch: {
    theme() {
      this.chartInstane.dispose();
      this.initChart();
      this.screenAdapter();
      this.updateChart();
    },
  },
};
</script>

<style lang="less" scoped>
.title {
  position: absolute;
  left: 20px;
  top: 20px;
  z-index: 10;
  color: white;
}
</style>
6 横向折线图
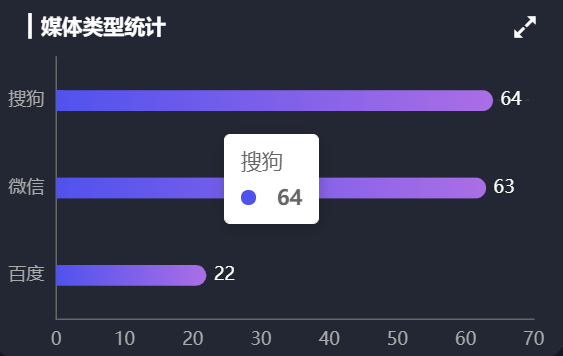
data
res.data=[{"name":"搜索","value":11},{"name":"网站","value":13}...]
vue
<!-- media横向柱状图 -->
<template>
  <div class="com-container">
    <div class="com-chart" ref="media_ref"></div>
  </div>
</template>

<script>
import { mapState } from "vuex";
// import { mapState } from 'vuex'
export default {
  data () {
    return {
      chartInstance: null,
      alldata: null, // 服务器返回的数据
    }
  },
  computed: { ...mapState(["theme"]) },
watch: {
    theme() {
      this.chartInstance.dispose();
      this.initChart();
      this.screenAdapter();
      this.updateChart();
    },
  },
  mounted () {
    this.initChart()
    this.getData()
    window.addEventListener('resize', this.screenAdapter)
    // 在页面加载完成的时候, 主动进行屏幕的适配
    this.screenAdapter()
  },
  destroyed () {
    clearInterval(this.timerId)
    // 在组件销毁的时候, 需要将监听器取消掉
    window.removeEventListener('resize', this.screenAdapter)
  },
  methods: {
    // 初始化echartInstance对象
    initChart () {
      this.chartInstance = this.$echarts.init(this.$refs.media_ref, this.theme)
      // 对图表初始化配置的控制
      const initOption = {
        title: {
          text: '▎媒体类型统计',
          left: 20,
          top: 20
        },
        grid: {
          top: '20%',
          left: '3%',
          right: '6%',
          bottom: '3%',
          containLabel: true // 距离是包含坐标轴上的文字
        },
        xAxis: {
          type: 'value'
        },
        yAxis: {
          type: 'category'
        },
        tooltip: {
          trigger: 'axis',
          axisPointer: {
            type: 'line',
            z: 0,
            lineStyle: {
              color: '#2D3443',
              // type:"solid"
            }
          }
        },
        series: [
          {
            type: 'bar',
            label: {
              show: true,
              position: 'right',
              textStyle: {
                color: 'white'
              }
            },
            // barWidth:20, //柱宽度设置

            itemStyle: {
              barBorderRadius: [0, 33, 33, 0], //柱圆角设置

              // 指明颜色渐变的方向
              // 指明不同百分比之下颜色的值
              color: new this.$echarts.graphic.LinearGradient(0, 0, 1, 0, [
                // 百分之0状态之下的颜色值
                {
                  offset: 0,
                  color: '#5052EE'
                },
                // 百分之100状态之下的颜色值
                {
                  offset: 1,
                  color: '#AB6EE5'
                }
              ])
            }
          }
        ]
      }
      this.chartInstance.setOption(initOption)
    },
    // 获取服务器的数据
    async getData () {
      // http://127.0.0.1:8888/api/seller
      const { data: ret } = await this.$http.get('map/media/1');
      this.alldata = ret.data;
      // 对数据排序
      this.alldata.sort((a, b) => {
        return a.value - b.value // 从小到大的排序
      });
      this.updateChart();
    },
    // 更新图表
    updateChart () {
      // console.log(typeof(this.allData))
      const mediaNames = this.alldata.map((item) => {
        return item.name
      })
      const mediaValues = this.alldata.map((item) => {
        return item.value
      })
      const dataOption = {
        yAxis: {
          data: mediaNames
        },
        series: [
          {
            data: mediaValues
          }
        ]
      }
      this.chartInstance.setOption(dataOption)
    },

    // 当浏览器的大小发生变化的时候, 会调用的方法, 来完成屏幕的适配
    screenAdapter () {
      // console.log(this.$refs.seller_ref.offsetWidth)
      const titleFontSize = this.$refs.media_ref.offsetWidth / 100 * 3.6
      // 和分辨率大小相关的配置项
      const adapterOption = {
        title: {
          textStyle: {
            fontSize: titleFontSize
          }
        },
        // tooltip: {
        //   axisPointer: {
        //     lineStyle: {
        //       width: titleFontSize
        //     }
        //   }
        // },
        series: [
          {
            barWidth: titleFontSize,
            itemStyle: {
              barBorderRadius: [0, titleFontSize / 2, titleFontSize / 2, 0]
            }
          }
        ]
      }
      this.chartInstance.setOption(adapterOption)
      // 手动的调用图表对象的resize 才能产生效果
      this.chartInstance.resize()
    }
  },
}
</script>

<style lang="less" scoped>
</style>
作者:华王
博客:https://www.cnblogs.com/huahuawang/

 浙公网安备 33010602011771号