
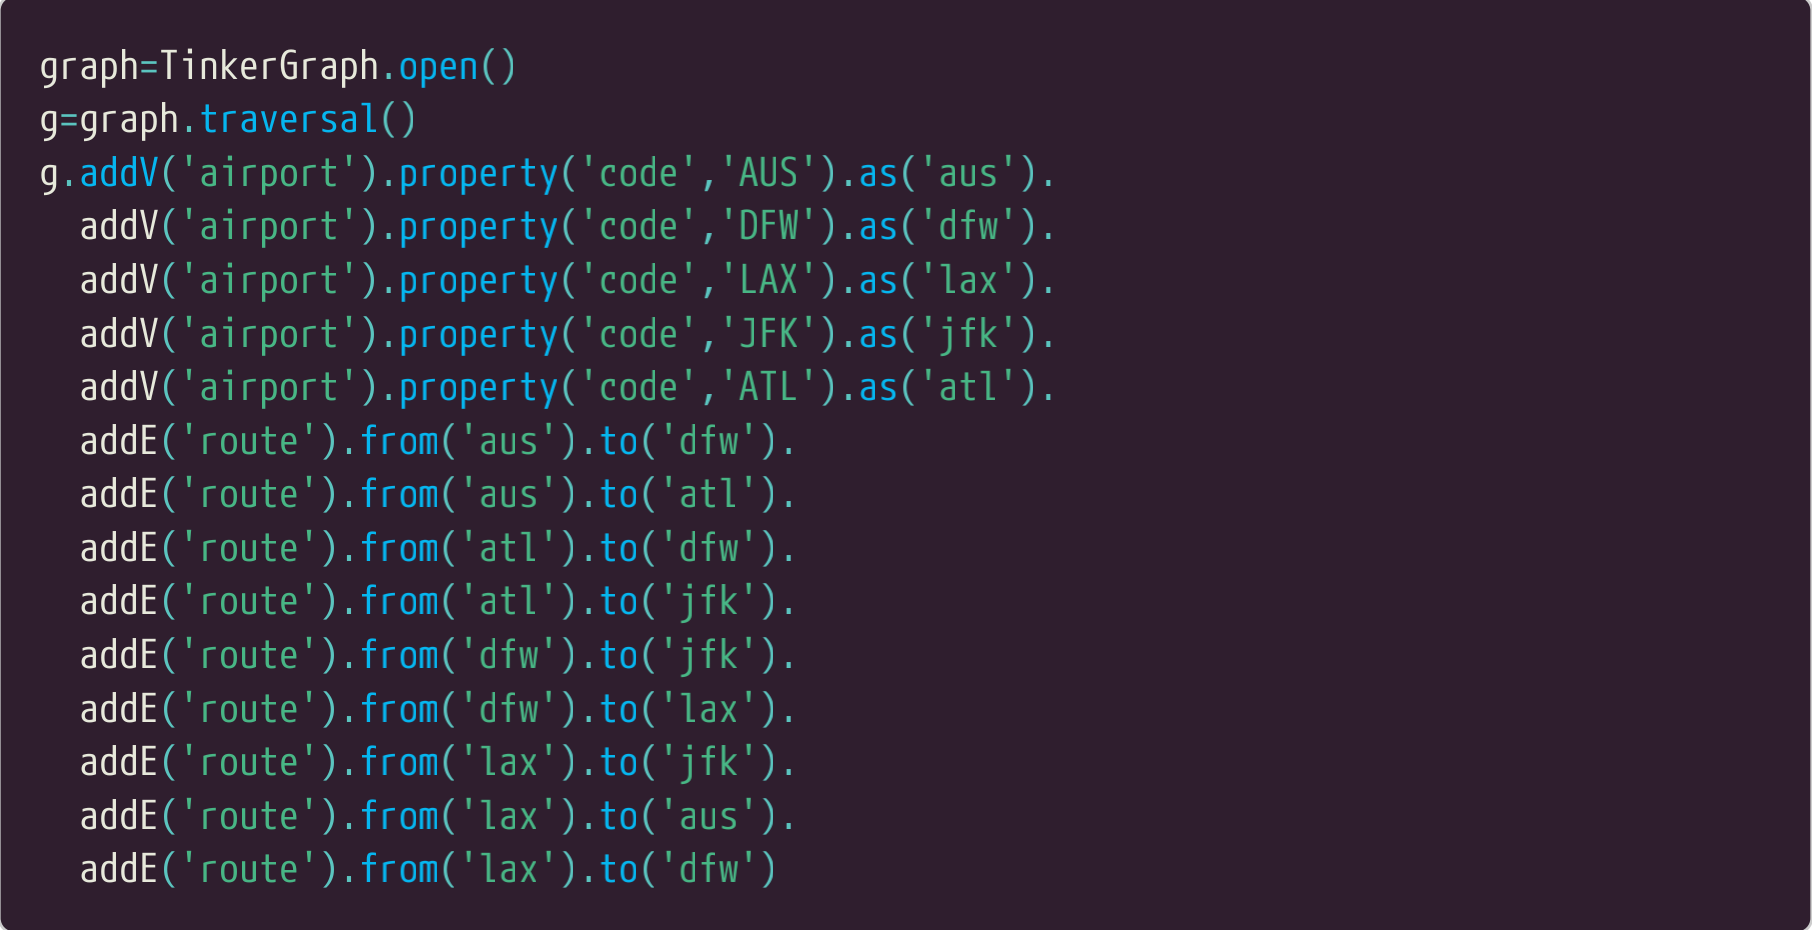
有时为了测试或者当您要想报告一个问题或者从一个邮件列表寻找帮助,您可以创建一个小的独立的图,这是很方便的。下面的代码在小精灵控制台创建了迷你版的航线图。注意怎么在一条查询语句中创建所有的顶点和所有的边,并把每个步骤连接在一起。
Sometimes for testing and for when you want to report a problem or ask for help on a mailing list it
is handy to have a small standalone graph that you can use. The code below will create a mini
version of the air routes graph in the Gremlin Console. Note how all of the vertices and edges are
created in a single query with each step joined together.
使用类似这样的g.addV(label,"airport","code","AUS")创建一个顶点和属性,addV()的这种使用形式现在已经淘汰了,不可以再使用了。
The form of addV that used to allow creation of a vertex and a property using
something like g.addV(label,"airport","code","AUS") is now deprecated and should
not be used.

 浙公网安备 33010602011771号