Lab 10-1
This lab includes both a driver and an executable. You can run the executable from anywhere, but in order for the program to work properly, the driver must be placed in the C:\Windows\System32 directory where it was originally found on the victim computer. The executable is Lab10-01.exe, and the driver is Lab10-01.sys.
Questions and Short Answers
-
Does this program make any direct changes to the registry? (Use procmon to check.)
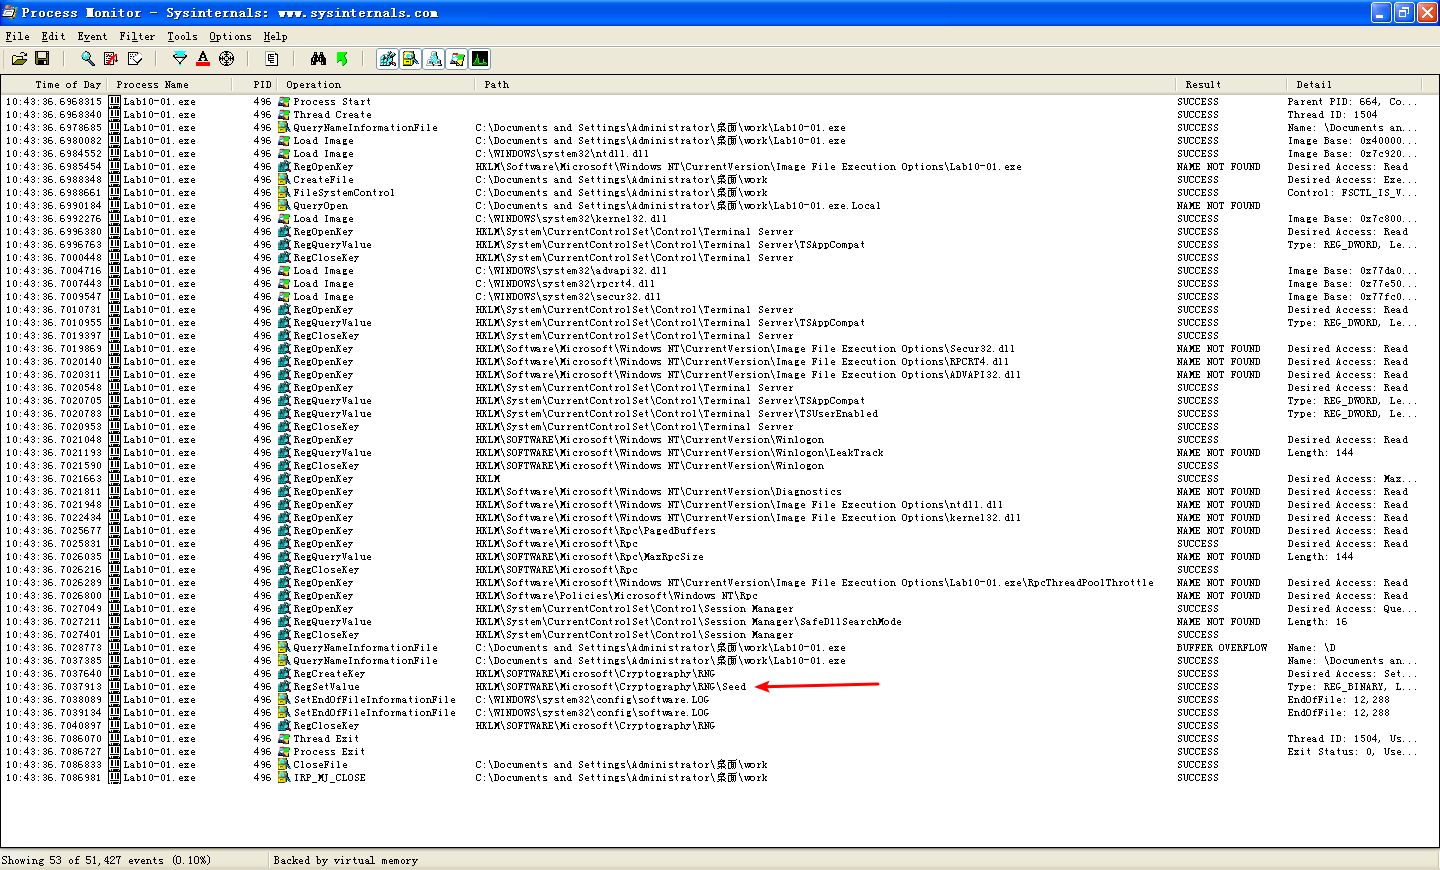
A: If you run procmon to monitor this program, you will see that the only call to write to the registry is to
RegSetValuefor the valueHKLM\SOFTWARE\Microsoft\Cryptography\RNG\Seed. Some indirect changes are made by the calls toCreateServiceA, but this program also makes direct changes to the registry from the kernel that go undetected by procmon. -
The user-space program calls the
ControlServicefunction. Can you set a breakpoint with WinDbg to see what is executed in the kernel as a result of the call toControlService?A: To set a breakpoint to see what happens in the kernel, you must open the executable within an instance of WinDbg running in the virtual machine, while also debugging the kernel with another instance of WinDbg in the host machine. When Lab10-01.exe is stopped in the virtual machine, you first use the
!drvobjcommand to get a handle to the driver object, which contains a pointer to the unload function. Next, you can set a breakpoint on the unload function within the driver. The breakpoint will be triggered when you restart Lab10-01.exe. -
What does this program do?
A: This program creates a service to load a driver. The driver code then creates (or modifies, if they exist) the registry keys
\Registry\Machine\SOFTWARE\Policies\Microsoft\WindowsFirewall\StandardProfileand\Registry\Machine\SOFTWARE\Policies\Microsoft\WindowsFirewall\DomainProfile. Setting these registry keys disables the Windows XP firewall.
Detailed Analysis
We begin with some basic static analysis. Examining the executable, we see very few imports other than the standard ones included with every executable. The imports of interest are OpenSCManagerA, OpenServiceA, ControlService, StartServiceA, and CreateServiceA. These indicate the program creates a service, and probably starts and manipulates that service. There appears to be little additional interaction with the system.

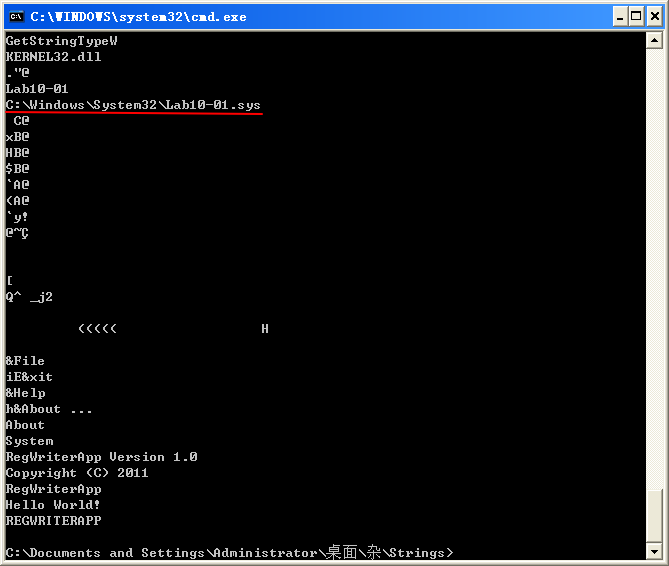
The strings output reveals a few interesting strings. The first is C:\Windows\System32\Lab10-01.sys, which suggests that Lab10-01.sys probably contains the code for the service.
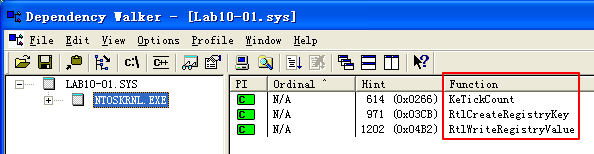
Examining the driver file, we see that it imports only three functions. The first function is KeTickCount, which is included in almost every driver and can be ignored. The two remaining functions, RtlCreateRegistryKey and RtlWriteRegistryValue, tell us that the driver probably accesses the registry.
The driver file also contains a number of interesting strings, as follows:
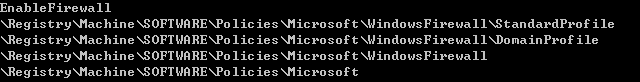
These strings look a lot like registry keys, except that they start with \Registry\Machine, instead of one of the usual registry root keys, such as HKLM. When accessing the registry from the kernel, the prefix \Registry\Machine is equivalent to accessing HKEY_LOCAL_MACHINE from a user-space program. An Internet search reveals that setting the EnableFirewall value to 0 disables the built-in Windows XP firewall.
Since these strings suggest that the malware writes to the registry, we open procmon to test our hypothesis. This shows several calls to functions that read the registry, but only one call to write to the registry: RegSetValue on the value HKLM\SOFTWARE\Microsoft\Cryptography\RNG\Seed. This registry value is changed all the time and is meaningless for malware analysis, but since kernel code is involved, we need to make sure that the driver isn’t modifying the registry covertly.
-
将文件 Lab10-01.sys 拷贝到目录
C:\WINDOWS\system32下。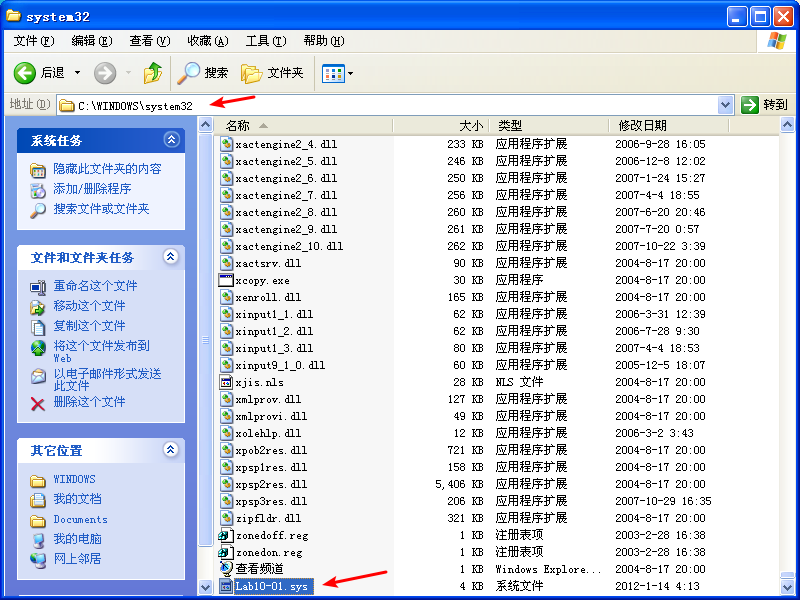
-
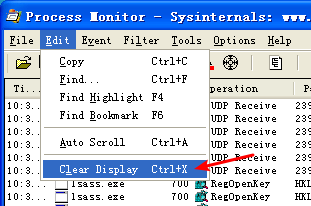
打开 procmon,清楚显示。
-
添加过滤

-
启动程序 Lab10-01.exe
Next, we open the executable, navigate to the main function shown in Listing 10-1L, and see that it makes only four function calls.

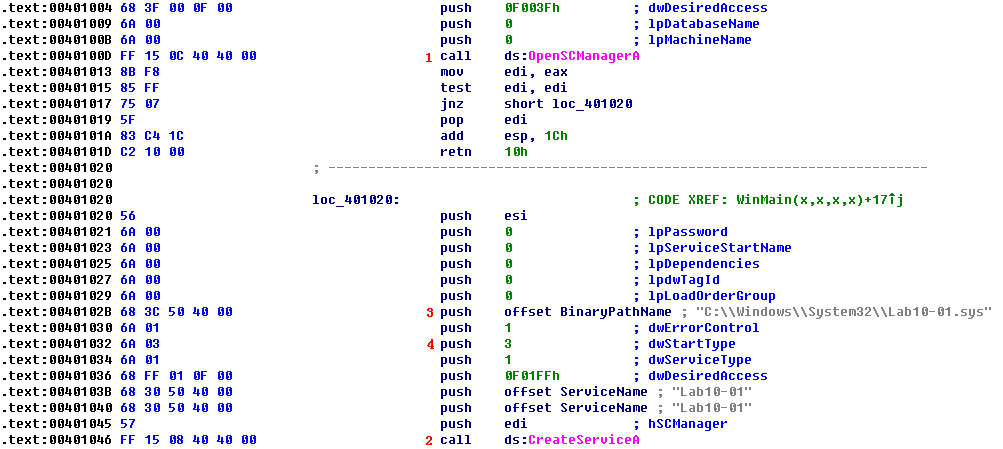
关于上图中 \({\color{red}1}\) 处说明:Establish a connection to the service control manager on the specified computer and opens the specified database.
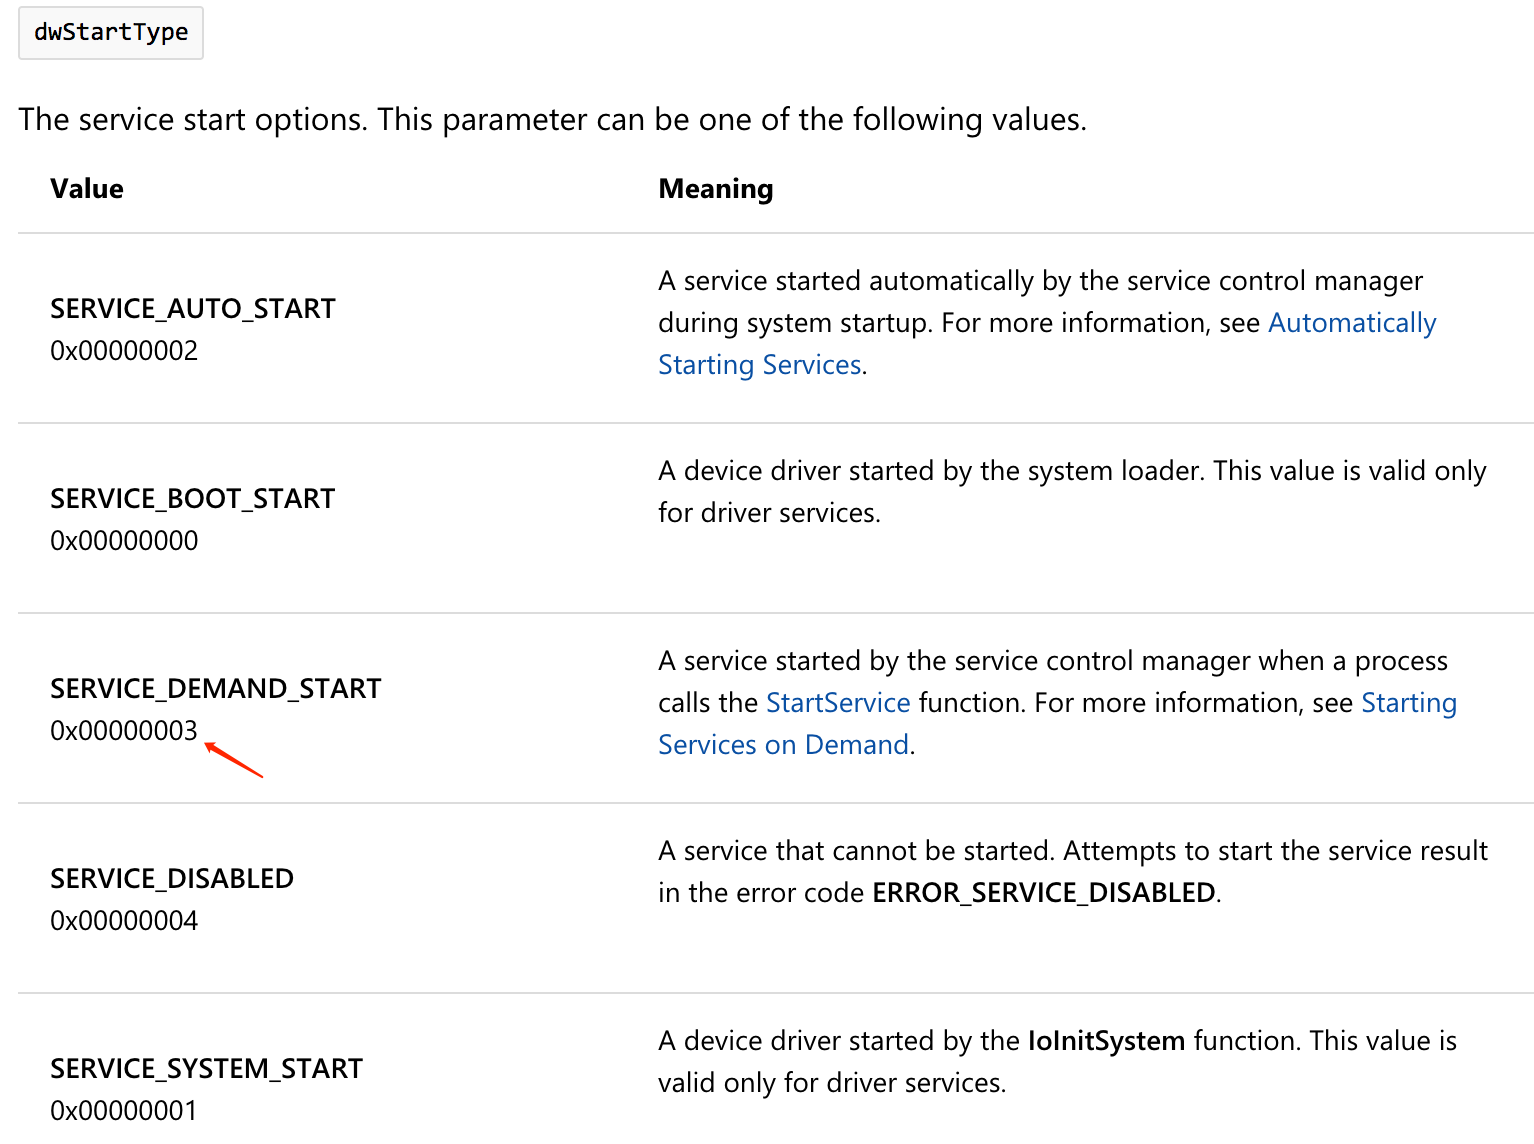
First, it calls OpenSCManagerA at \({\color{red}1}\) to get a handle to the service manager, and then it calls CreateServiceA at \({\color{red}2}\) to create a service called Lab10-01. The call to CreateServiceA tells us that the service will use code in C:\Windows\System32\Lab10-01.sys at \({\color{red}3}\) and that the service type is 3 at \({\color{red}4}\), or SERVICE_KERNEL_DRIVER, which means that this file will be loaded into the kernel.
If the call to CreateServiceA fails, the code calls OpenServiceA with the same service name, as shown in Listing 10-2L at \({\color{red}1}\). This opens a handle to the Lab10-01 service if the CreateServiceA call failed because the service already existed.

Next, the program calls StartServiceA to start the service, as shown in Listing 10-3L at \({\color{red}1}\). Finally, it calls ControlService at \({\color{red}2}\). The second parameter to ControlService is what type of control message is being sent. In this case, the value is 0x01 at \({\color{red}3}\), which we look up in the documentation and find that it means SERVICE_CONTROL_STOP. This will unload the driver and call the driver’s unload function.
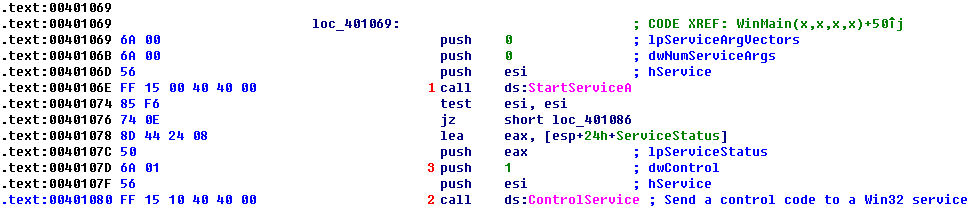
SERVICE_CONTROL_STOP
0x00000001
Notifies a service that it should stop. The hService handle must have the SERVICE_STOP access right.After sending the stop request to a service, you should not send other controls to the service.
Viewing Lab10-01.sys in IDA Pro
Before we try to analyze the driver with WinDbg, we can open the driver in IDA Pro to examine the DriverEntry function. When we first open the driver and navigate to the entry point, we see the code in Listing 10-4L.
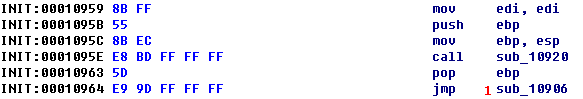
This function is the entry point of the driver, but it’s not the DriverEntry function. The compiler inserts wrapper code around the DriverEntry. The real DriverEntry function is located at sub_10906 \({\color{red}1}\).
As shown in Listing 10-5L, the main body of the DriverEntry function appears to move an offset value into a memory location, but otherwise it doesn’t make any function calls or interact with the system.

Analyzing Lab10-01.sys in WinDbg
Now, we can use WinDbg to examine Lab10-01.sys to see what happens when ControlService is called to unload Lab10-01.sys. The code in the user-space executable loads Lab10-10.sys and then immediately unloads it. If we use the kernel debugger before running the malicious executable, the driver will not yet be in memory, so we won’t be able to examine it. But if we wait until after the malicious executable is finished executing, the driver will already have been unloaded from memory.
In order to analyze Lab10-01.sys with WinDbg while it is loaded in memory, we’ll load the executable into WinDbg within the virtual machine. We set a breakpoint between the time that the driver is loaded and unloaded, at the ControlService call, with the following command:
0:000> bp 00401080
附 IDA Pro 查看 Lab10-01.exe 图:

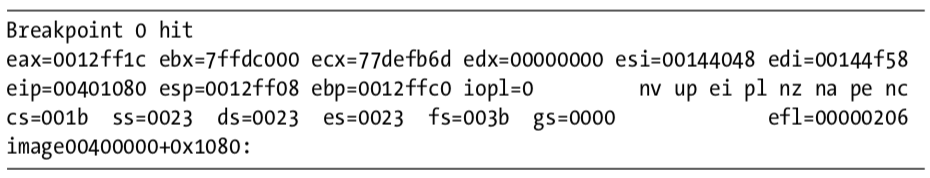
Then we start the program and wait until the breakpoint is hit. When the breakpoint is hit, we are presented with the following information in WinDbg:
Once the program is stopped at the breakpoint, we move out of the virtual machine in order to connect the kernel debugger and get information about Lab10-01.sys. We open another instance of WinDbg and select File -> Kernel Debug with pipe set to \\.\pipe\com_1 and a baud rate of 115200 to connect the instance of WinDbg running in the host machine to the kernel of the guest machine. We know that our service is called Lab10-01, so we can get a driver object by using the !drvobj command, as shown in Listing 10-6L.
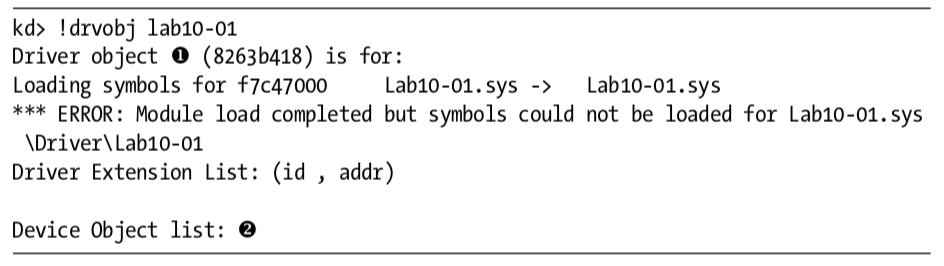
The output of the !drvobj command gives us the address of the driver object at \({\color {red} 1}\). Because there are no devices listed in the device object list at \({\color {red} 2}\), we know that this driver does not have any devices that are accessible by user-space applications.
NOTE
To resolve any difficulty locating the service name, you can get a list of driver objects currently in the kernel with the
!object \Drivercommand.
Once we have the address of the driver object, we can view it using the dt command, as shown in Listing 10-7L.
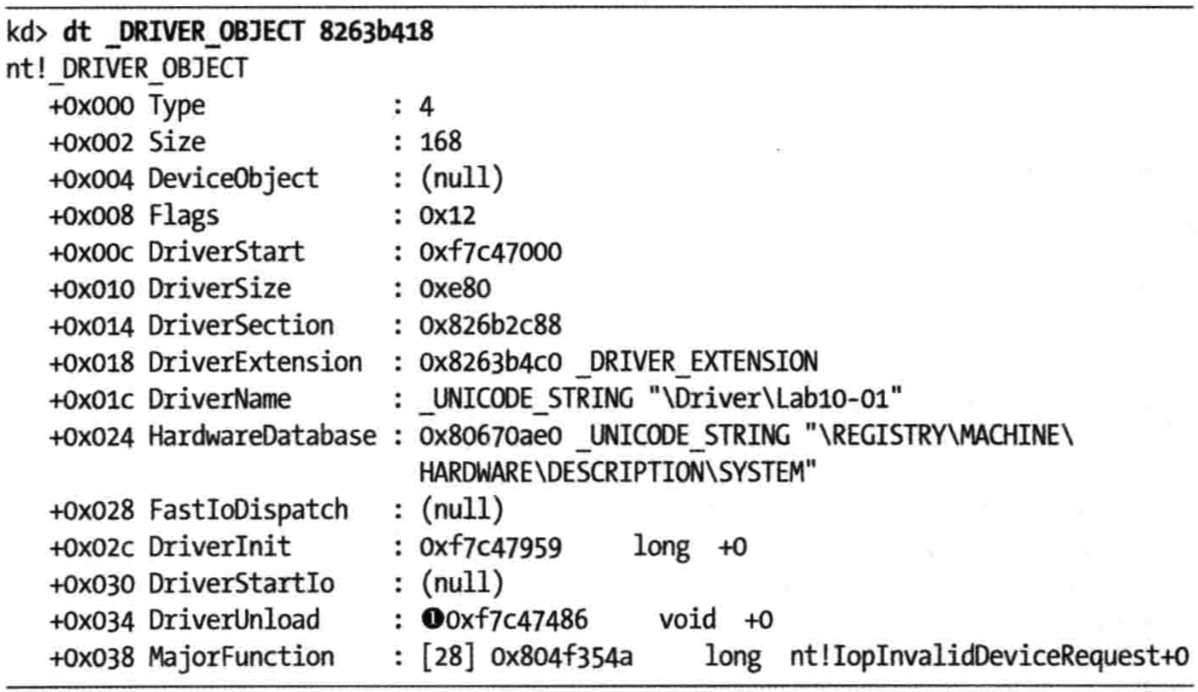
We’re trying to identify the function called when the driver is unloaded—information at offset 0x034, DriverUnload, as shown at \({\color {red} 1}\). Then we set a breakpoint using the following command:
kd> bp 0xf7c47486
Having set the breakpoint, we resume running our kernel. Then we return to the version of WinDbg running on the executable on our virtual machine and resume it as well. Immediately, the entire guest OS freezes because the kernel debugger has hit our kernel breakpoint. At this point, we can go to the kernel debugger to step through the code. We see that the program calls the RtlCreateRegistryKey function three times to create several registry keys, and then calls the RtlWriteRegistryValue twice to set the EnableFirewall value to 0 in two places. This disables the Windows XP firewall from the kernel in a way that is difficult for security programs to detect.
If the unload function at 0xf7c47486 were long or complex, it would have been difficult to analyze in WinDbg. In many cases, it’s easier to analyze a function in IDA Pro once you have identified where the function is located, because IDA Pro does a better job of analyzing the functions. However, the function location in WinDbg is different than the function location in IDA Pro, so we must perform some manual calculations in order to view the function in IDA Pro. We must calculate the offset of the function from the beginning of the file as it is loaded in WinDbg using the lm command, as follows:
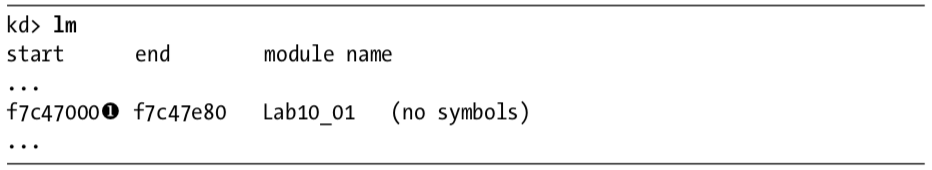
As you can see, the file is loaded at 0xf7c47000 at \({\color {red} 1}\), and from earlier, we know the unload function is located at 0xf7c47486. We subtract 0xf7c47000 from 0xf7c47486 to get the offset (0x486), which we then use to navigate to the unload function in IDA Pro. For example, if the base load address in IDA Pro is 0x00100000, then we navigate to address 0x00100486 to find the unload function in IDA Pro. We can then use static analysis and IDA Pro to confirm what we discovered in WinDbg.
Alternatively, we can change the base address in IDA Pro by selecting Edit -> Segments -> Rebase Program and changing the base address value from 0x00100000 to 0xf7c47000.
NOTE
If you tried to use a deferred breakpoint using the
bu $iment(Lab10-01), you may have run into trouble because WinDbg changes hyphens to underscores when it encounters them in filenames. The correct command to break on the entry point of the driver in this lab would bebu $iment(Lab10_01). This behavior is not documented anywhere and may be inconsistent across versions of WinDbg.
Preference
PRACTICAL MALWARE ANALYSIS: KERNEL DEBUGGING WITH WINDBG (LAB 10-01)

 浙公网安备 33010602011771号