Scipy的应用
首先总体概括一下Scipy的用处
>>> #Scipy依赖于numpy
>>> #Scipy提供了真正的矩阵
>>> #Scipy包含的功能:最优化,线性代数,积分,插值,拟合,特殊函数,快速傅里叶变换,信号处理,图形处理,常微分方程求解器等
>>> #Scipy是高端科学计算工具包
>>> #Scipy由一些特殊功能的子模块组成
>>> #图片消噪
下面介绍一些具体的应用
1:求圆周率
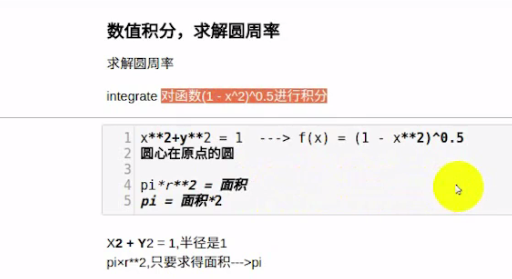
从图片易知道,圆周率为半径为一的半圆的面积的两倍,所以只需要求解半圆的面积即可,可通过积分的形式求解
具体过程如下
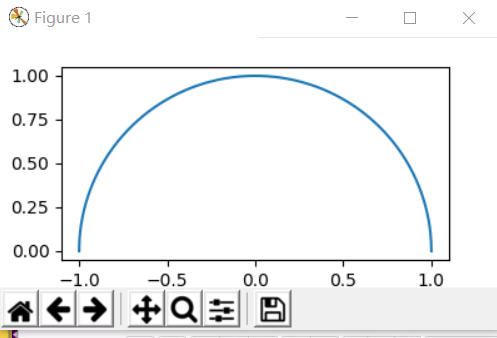
>>>x=np.linspace(-1,1,1000)#-1到1分成1000份来进行积分
>>> f=lambda x:(1-x**2)**0.5
>>>plt.plot(x,f(x))#画出该图形
>>> plt.figure(figsize=(4,2))#设置图形大小
>>> plt.show()
>>> #使用scipy.integrate进行积分,调用quad()方法
>>> import scipy.integrate as integrate
>>> integrate.quad (f,-1,1)#求积分
(1.5707963267948983, 1.0002354500215915e-09, 1.5707963267948983, 1.0002354500215915e-09)
>>> sq,err=integrate.quad (f,-1,1)#sq是半圆的面积,err是误差
>>> pi=sq*2#圆的面积是圆周率
>>> pi
3.1415926535897967
2:文件处理
>>> #Scipy文件输入输出
>>> #随机生成数组,使用Scipy中的io.savement()保存
>>> #文件格式是.mat,标准的二进制文件
>>> import scipy.io as spio
>>> nd=np.random.randint(0,150,size=10)
>>> spio.savemat('nd',{'data':nd})#保存文件,文件名为nd
>>> spio.loadmat('nd')['data']#读取文件
array([[ 92, 67, 50, 145, 81, 101, 144, 101, 92, 106]])
>>> #读取scipy中的misc.imread()/imsave()
>>> import scipy.misc as misc
>>> cat_data=misc.imread ('C:/a/a.jpg')#对图片进行操作
>>> misc.imshow(cat_data)
>>> misc.imshow(misc.imrotate(cat_data,angle=90))#旋转90度
>>> a=misc.imresize(cat_data,size=0.5)
>>> misc.imshow(a)#缩小一倍
>>> q=misc.imfilter(cat_data,'blur')#给图片添加一种模糊效果,smooth是平滑效果,当然还有许多其他的效果
>>> misc.show(q)
>>> misc.imshow(q)
3:操作图片
>>> #使用scipy.misc.face(gray=True)获取图片,使用ndimage移动坐标,旋转图片,切割图片缩放图片
>>> import numpy as np
>>> import scipy.misc as misc
>>> import scipy.ndimage as ndimage
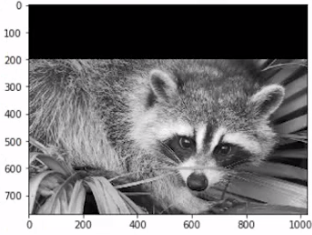
>>> face=misc.face(gray=True)#图片设置为黑白色了
>>> misc.imshow(face)

>>> import matplotlib.pyplot as plt
>>> ndimage.shift(face,[200,0])#图片向下移动200个单位
array([[ 0, 0, 0, ..., 0, 0, 0],
[ 0, 0, 0, ..., 0, 0, 0],
[ 0, 0, 0, ..., 0, 0, 0],
...,
[203, 207, 210, ..., 102, 100, 100],
[205, 208, 210, ..., 111, 109, 108],
[206, 210, 211, ..., 119, 117, 116]], dtype=uint8)
>>> ss=ndimage.shift(face,[200,0])#图片向下移动200个单位
>>> plt.imshow(ss)
<matplotlib.image.AxesImage object at 0x00000000110F8A58>
>>> plt.show()
>>> ss1=ndimage.shift(face,[350,0],mode='mirror')#图片向下移动350个单位,并产生镜像效果
>>> plt.imshow(ss)
<matplotlib.image.AxesImage object at 0x000000001161C9B0>
>>> plt.show()
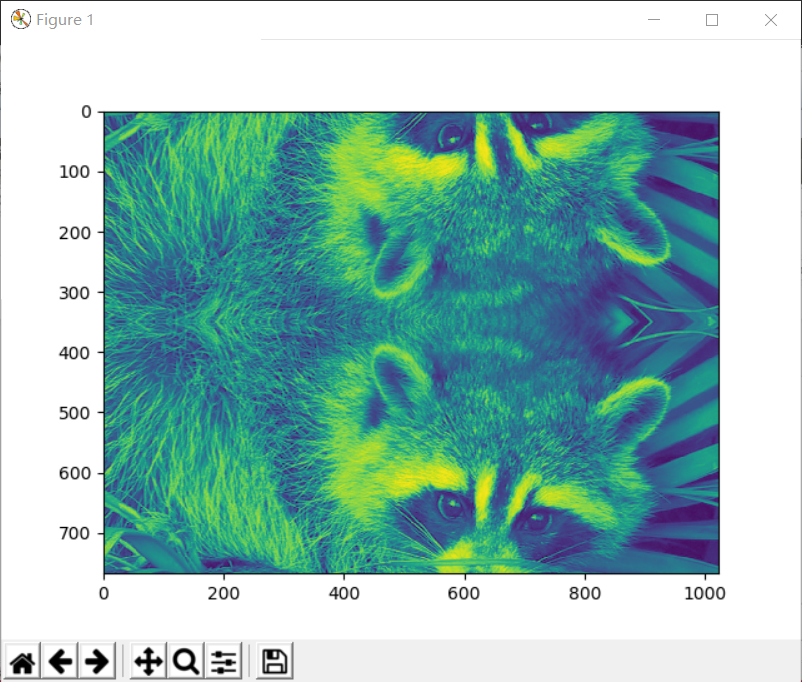
>>> plt.imshow(ss1)
<matplotlib.image.AxesImage object at 0x000000001180EFD0>
>>> plt.show()
>>> #mode 还可以指定为near和wrap等
>>> r=ndimage.rotate(face,angle=180,axes=(0,1))
>>> plt.imshow(r)
<matplotlib.image.AxesImage object at 0x000000001D7A3470>
>>> plt.show()

>>> #旋转
>>> #下面是缩放
>>> z=ndimage.zoom(face,zoom=0.5)
>>> plt.imshow(z)
<matplotlib.image.AxesImage object at 0x00000000117BE7B8>
>>> plt.show()
>>> #缩小一半
>>> face2=face[:512,-512:]
>>> plt.imshow(face2)
<matplotlib.image.AxesImage object at 0x000000001DA75B38>
>>> plt.show()

#
>>> face_g =ndimage.gaussian_filter(face,sigma=1)
>>> plt.imshow(face_g)
<matplotlib.image.AxesImage object at 0x0000000010D15DA0>
>>> plt.show()

>>> #高斯滤波可以使图片变得清晰些
>>> plt_m=ndimage.median_filter(face,size=2)
>>> plt.imshow(plt_m)
<matplotlib.image.AxesImage object at 0x000000001E2E58D0>
>>> plt.show()

>>> #中值滤波可以使图片变得清晰些
>>> #signal维纳滤波,滤镜尺寸的标量
>>> import scipy.signal as signal
>>> sw=signal.wiener(face,mysize=10)
>>> plt.imshow(sw)
<matplotlib.image.AxesImage object at 0x000000001DC1D278>
>>> plt.show()

 浙公网安备 33010602011771号