
『OpenCV3』Harris角点特征_API调用及python手动实现
一、OpenCV接口调用示意
介绍了OpenCV3中提取图像角点特征的函数:
 1 # coding=utf-8
 2 import cv2
 3 import numpy as np
 4
 5
 6 '''Harris算法角点特征提取'''
 7
 8 img = cv2.imread('chess_board.png')
 9 gray = cv2.cvtColor(img,cv2.COLOR_BGR2GRAY)
10 gray = np.float32(gray)
11
12 # {标记点大小,敏感度(3~31,越小越敏感)}
13 # OpenCV函数cv2.cornerHarris() 有四个参数 其作用分别为 :
14 #img - Input image, it should be grayscale and float32 type.
15 #blockSize - It is the size of neighbourhood considered for corner detection
16 #ksize - Aperture parameter of Sobel derivative used.
17 #k - Harris detector free parameter in the equation,在0.04 到0.05之间
18 dst = cv2.cornerHarris(gray,2,23,0.04)
19 img[dst>0.01 * dst.max()] = [0,0,255]
20
21 cv2.imshow('corners',img)
22 cv2.waitKey()
23 cv2.destroyAllWindows()
dst = cv2.cornerHarris(gray,2,23,0.04)中第3个参数(23)调整对结果影响如下:
取值为3时:

取值为23时:

二、使用Python实现harris胶垫检测
计算机视觉课后作业,因为已经提交了一段时间了,之前也注意到网上很少有python版本的harris角点检测代码,所以开源出来,
# Author : hellcat
# Time   : 18-3-22

"""
import os
os.environ["CUDA_VISIBLE_DEVICES"]="-1"

import numpy as np
np.set_printoptions(threshold=np.inf)

import tensorflow as tf
config = tf.ConfigProto()
config.gpu_options.allow_growth = True
sess = tf.Session(config=config)
"""

import numpy as np
from PIL import Image
from skimage import filters
from datetime import datetime
import matplotlib.pyplot as plt

IMAGE_PATH = '1653033843.jpg'     # 图片路径
WITH_NMS = False                  # 是否非极大值抑制,True/False
k = 0.04                          # 响应函数参数k
threshold = 0.01                  # 界定阈值

img = Image.open(IMAGE_PATH)
img_gray = img.convert('L')
img_num = np.pad(np.asarray(img_gray, dtype=np.float32), ((1, 1), (1, 1)), 'constant')
h, w = img_num.shape  # padding之后的图像尺寸

# 计算Ix,Iy
grad = np.empty([h, w, 2], dtype=np.float)
grad[:, 1:-1, 0] = img_num[:, 2:] - img_num[:, :-2]  # Ix
grad[1:-1, :, 1] = img_num[2:, :] - img_num[:-2, :]  # Iy

# 计算Ixx,Iyy,Ixy
m = np.empty([h, w, 3], dtype=np.float)
# m[:, :, 0] = grad[:, :, 0]**2
# m[:, :, 1] = grad[:, :, 0]**2
# m[:, :, 2] = grad[:, :, 0]*grad[:, :, 1]
m[:, :, 0] = filters.gaussian(grad[:, :, 0]**2, sigma=2)  # Ixx
m[:, :, 1] = filters.gaussian(grad[:, :, 1]**2, sigma=2)  # Iyy
m[:, :, 2] = filters.gaussian(grad[:, :, 0]*grad[:, :, 1], sigma=2)  # Ixy
m = [np.array([[m[i, j, 0], m[i, j, 2]],
               [m[i, j, 2], m[i, j, 1]]]) for i in range(h) for j in range(w)]

# 记录一下R计算时耗
start = datetime.now()
# 0:00:42.123384 迭代器策略:用时间换空间
# R = np.array([d-k*t**2 for d, t in zip(map(np.linalg.det, m), map(np.trace, m))])
# 0:00:35.846864
D, T = list(map(np.linalg.det, m)), list(map(np.trace, m))
R = np.array([d-k*t**2 for d, t in zip(D, T)])
end = datetime.now()
print(end-start)

R_max = np.max(R)
R = R.reshape(h, w)

# 标注角点
record = np.zeros_like(R, dtype=np.int)
img_row = np.pad(np.asarray(img, dtype=np.float32), ((1, 1), (1, 1), (0, 0)), 'constant')
for i in range(1, h-2):
    for j in range(1, w-2):
        if WITH_NMS:
            if R[i, j] > R_max*threshold and R[i, j] == np.max(R[i-1:i+2, j-1:j+2]):
                record[i, j] = 255
                img_row[i, j] = [255, 255, 255]
        else:
            if R[i, j] > R_max*0.01:
                record[i, j] = 255
                img_row[i, j] = [255, 255, 255]
# record[R > 0.01*R_max] = 255
# img_row[R > 0.01*R_max] = [255, 255, 255]

# 图像展示与保存
res = Image.fromarray(np.uint8(record[1:-1, 1:-1]))
img_row = Image.fromarray(np.uint8(img_row[1:-1, 1:-1]))

plt.figure()
plt.subplot(1, 2, 1)
plt.imshow(res)
plt.subplot(1, 2, 2)
plt.imshow(img_row)
if WITH_NMS:
    plt.savefig('角点检测_NMS.jpg')
    res.save('角点检测_NMS_1.png')
    img_row.save('角点检测_NMS_2.png')
else:
    plt.savefig('角点检测_no_NMS.jpg')
    res.save('角点检测_no_NMS_1.png')
    img_row.save('角点检测_no_NMS_2.png')
实际上在计算Ixx,Ixy,Iyy时要进行高斯滤波,理论推导中都采用了最简单的权重(全部为1),这点注意,使用全1权重啥也检测不出来。
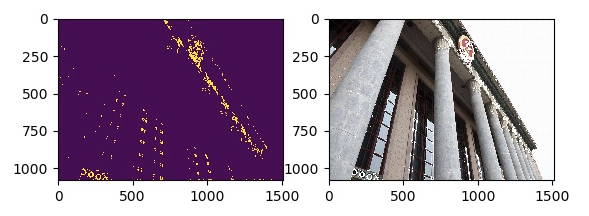
不进行非极大值抑制结果:
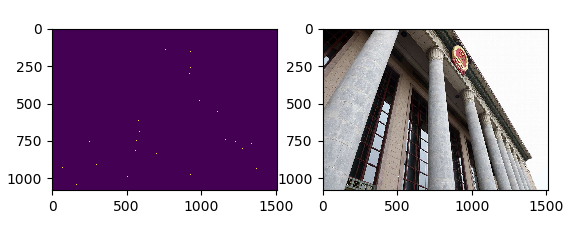
进行非极大值抑制结果(实际上检测出来的点很多,因为分辨率看不清):


 浙公网安备 33010602011771号