


Because of my work, I studied James 3.5 distributed version. In order to confirm how much concurrent users it can support under the existing hardware configuration, I made a stress test on it with JMeter.
1. Hardware
Hardware 1:Two physical machines, and seven virtual machine nodes are virtualized. Each virtual machine node is 8g / 4C, local disk
Hardware 2:Aliyun cloud 6 ECS( ecs.hfg6 .large), 2c/8G.
2. James Setup
In order to use James better, I compiled james with the source code, and deployed james with the traditional Java application deployment method, not using docker.
2.1 Step 1: download the source code
Clone the code of the James master branch to the local:
git clone https://github.com/apache/james-project.git
2.2 Step 2: compile and configure
Run the command mvn package , and after about 2 hours, the compilation is successful.
2.2.1 Copy server / container / Guice / Cassandra rabbitmq Guice / target to a directory (assuming it is copied to the dist directory
 #copy james
cp server/container/guice/cassandra-rabbitmq-guice/target/james-server-cassandra-rabbitmq-guice.jar dist/
cp -R server/container/guice/cassandra-rabbitmq-guice/target/james-server-cassandra-rabbitmq-guice.lib dist/
#copy james cp server/container/guice/cassandra-rabbitmq-guice/target/james-server-cassandra-rabbitmq-guice.jar dist/ cp -R server/container/guice/cassandra-rabbitmq-guice/target/james-server-cassandra-rabbitmq-guice.lib dist/
2.2.2. Copy the configuration file of James rabbit to dist directory
cp -R dockerfiles/run/guice/cassandra-rabbitmq/destination/ dist
2.2.3. Copy the CLI to dist
#copy cli&lib
cp -R server/container/cli/target/james-server-cli.lib dist/
cp server/container/cli/target/james-server-cli.jar dist/
2.2.4. Modify run_ james.sh, the script content is modified as follows
java -Dlogback.configurationFile=conf/logback.xml -Dworking.directory=./ $JVM_OPTIONS $GLOWROOT_OPTIONS -jar james-server-cassandra-rabbitmq-guice.jar
2.2.5 Start James
After modifying the configuration script of Cassandra / elastic search / rabbitmq in conf, execute run_ james.sh and the James will be started.
If there is a problem in the startup process, you can perform the corresponding troubleshooting according to the error prompt.
The above steps can be completed at one time by executing the following script:
#copy james
cp server/container/guice/cassandra-rabbitmq-guice/target/james-server-cassandra-rabbitmq-guice.jar dist/
cp -R server/container/guice/cassandra-rabbitmq-guice/target/james-server-cassandra-rabbitmq-guice.lib dist/

#copy cli&lib
cp -R server/container/cli/target/james-server-cli.lib dist/
cp server/container/cli/target/james-server-cli.jar dist/

#copy conf files
cp -R dockerfiles/run/guice/cassandra-rabbitmq/destination/ dist/
3.Test Process
3.1JMeter Setup
In order to simulate the user's real access scenarios, I used jammer to conduct 50 concurrent and 100 concurrent simulation stress tests on users, and the steps are as follows:
3.1.1 Configure JMeter
3.1.1.1 Create Mail Read Sampler
Right click on the ad group to add a mail read sampler

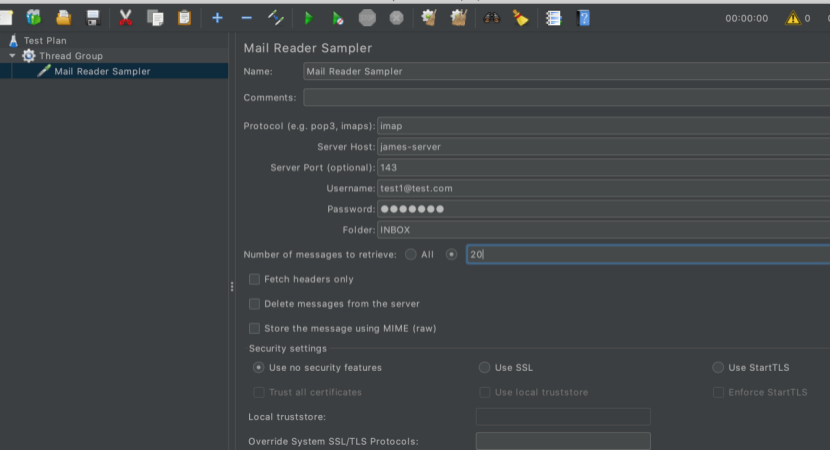
3.1.1.2 Configure mail server information
After adding, fill in the mail server information in the corresponding position, as shown in the figure below.
Note: parameters such as serverhost / port / username / password can be parameterized to achieve random values.
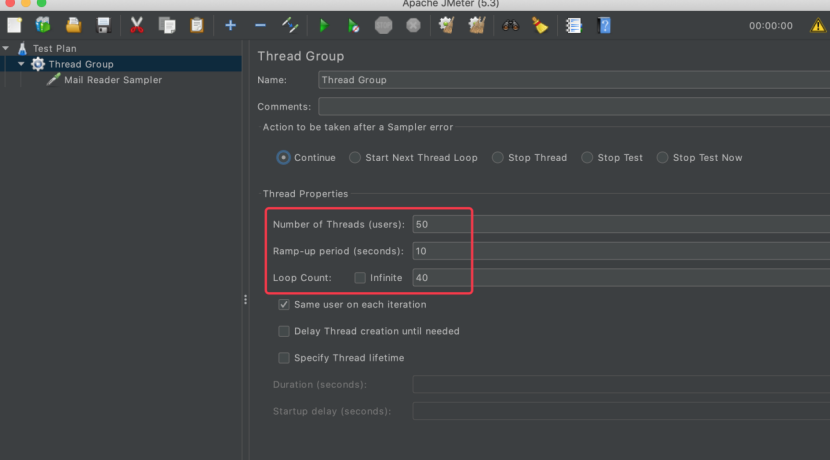
3.1.1.3 Configure user concurrency
Select thread group from the right node and configure number of threads (users) / ramp up period (seconds) / loop count respectively
Now, JMeter's mail reading configuration is complete.
3.1.1.4 Save Configuration
Save test plan as stress.config.jmx For subsequent use.
3.2 Run the test
Through the previous section, we have completed the preparation of the stress test. The simulation is that 50 concurrent users , and the 50 requests are sent out within 10 seconds. The loop round of stress test is 40 times.
The pressure test can be started directly through the GUI interface (but it is highly not recommended). You’d better closing the GUI and then start the pressure test through the command line. The startup command is as follows:
jmeter -n -t stress.config.jmx -l testlog.csv
3.2.1 Test scenarios
The following two groups of tests were carried out.
Test scenario 1: the number of inbox messages of users in James is 0
Test scenario 2: the number of inbox emails of users in James is 100+
In the above two scenarios, run the jam stress test script in Section 3.2 respectively to get the specific performance of James under 100 concurrent users.
3.2.2 Hardware configuration I test results (self built virtual machine, 100 concurrent)
3.2.2.1 When there is no mail in inbox
100 occurrent users, only 1 letters in the INBOX account
Creating summariser <summary>
Created the tree successfully using stress.config.jmx
Starting standalone test @ Sat Oct 24 07:18:49 CST 2020 (1603495129341)
Waiting for possible Shutdown/StopTestNow/HeapDump/ThreadDump message on port 4445
summary +    237 in 00:00:10 =   22.8/s Avg:  1493 Min:   633 Max:  3688 Err:    14 (5.91%) Active: 100 Started: 100 Finished: 0
summary +   1060 in 00:00:30 =   35.3/s Avg:  2612 Min:   982 Max:  7083 Err:   108 (10.19%) Active: 100 Started: 100 Finished: 0
summary =   1297 in 00:00:40 =   32.1/s Avg:  2407 Min:   633 Max:  7083 Err:   122 (9.41%)
summary +   1065 in 00:00:30 =   35.5/s Avg:  2660 Min:   593 Max:  7941 Err:   109 (10.23%) Active: 100 Started: 100 Finished: 0
summary =   2362 in 00:01:10 =   33.6/s Avg:  2521 Min:   593 Max:  7941 Err:   231 (9.78%)
summary +   1016 in 00:00:30 =   33.8/s Avg:  2732 Min:   821 Max:  6236 Err:   102 (10.04%) Active: 97 Started: 100 Finished: 3
summary =   3378 in 00:01:40 =   33.6/s Avg:  2585 Min:   593 Max:  7941 Err:   333 (9.86%)
summary +    622 in 00:00:28 =   22.1/s Avg:  2038 Min:   615 Max:  6266 Err:    60 (9.65%) Active: 0 Started: 100 Finished: 100
summary =   4000 in 00:02:09 =   31.1/s Avg:  2500 Min:   593 Max:  7941 Err:   393 (9.83%)
Tidying up ...    @ Sat Oct 24 07:20:58 CST 2020 (1603495258196)
3.2.2.2 When there are 100 + messages in inbox
100 coccurrent users, 100+ letters in the INBOX account

Starting standalone test @ Sat Oct 24 07:32:37 CST 2020 (1603495957260)
Waiting for possible Shutdown/StopTestNow/HeapDump/ThreadDump message on port 4445
summary +    106 in 00:00:23 =    4.6/s Avg:  5620 Min:   978 Max: 18250 Err:   106 (100.00%) Active: 100 Started: 100 Finished: 0
summary +    168 in 00:00:30 =    5.7/s Avg: 15111 Min:  2776 Max: 43114 Err:   154 (91.67%) Active: 100 Started: 100 Finished: 0
summary =    274 in 00:00:53 =    5.2/s Avg: 11439 Min:   978 Max: 43114 Err:   260 (94.89%)
summary +    167 in 00:00:30 =    5.5/s Avg: 15324 Min:  2081 Max: 45651 Err:   151 (90.42%) Active: 100 Started: 100 Finished: 0
summary =    441 in 00:01:23 =    5.3/s Avg: 12910 Min:   978 Max: 45651 Err:   411 (93.20%)
summary +    170 in 00:00:30 =    5.7/s Avg: 15315 Min:  2314 Max: 48428 Err:   153 (90.00%) Active: 96 Started: 100 Finished: 4
summary =    611 in 00:01:52 =    5.4/s Avg: 13579 Min:   978 Max: 48428 Err:   564 (92.31%)
summary +    155 in 00:00:31 =    5.1/s Avg: 15431 Min:  1774 Max: 49392 Err:   138 (89.03%) Active: 74 Started: 100 Finished: 26
summary =    766 in 00:02:23 =    5.4/s Avg: 13954 Min:   978 Max: 49392 Err:   702 (91.64%)
summary +    116 in 00:00:30 =    3.9/s Avg: 20965 Min:   852 Max: 50959 Err:    80 (68.97%) Active: 50 Started: 100 Finished: 50
summary =    882 in 00:02:53 =    5.1/s Avg: 14876 Min:   852 Max: 50959 Err:   782 (88.66%)
summary +    103 in 00:00:31 =    3.3/s Avg: 12570 Min:  1422 Max: 41389 Err:    69 (66.99%) Active: 11 Started: 100 Finished: 89
summary =    985 in 00:03:24 =    4.8/s Avg: 14635 Min:   852 Max: 50959 Err:   851 (86.40%)
summary +     15 in 00:00:24 =    0.6/s Avg: 11074 Min:  4383 Max: 14081 Err:     1 (6.67%) Active: 0 Started: 100 Finished: 100
summary =   1000 in 00:03:47 =    4.4/s Avg: 14582 Min:   852 Max: 50959 Err:   852 (85.20%)
Tidying up ...    @ Sat Oct 24 07:36:25 CST 2020 (1603496185045)
... end of run
3.2.2.3 Test result analysis of hardware configuration one
It can be seen from the results that the error rate is very high whether it is one email or 100 + e-mails, especially when it is 100 +, the error rate reaches more than 80%, which is obviously unacceptable.
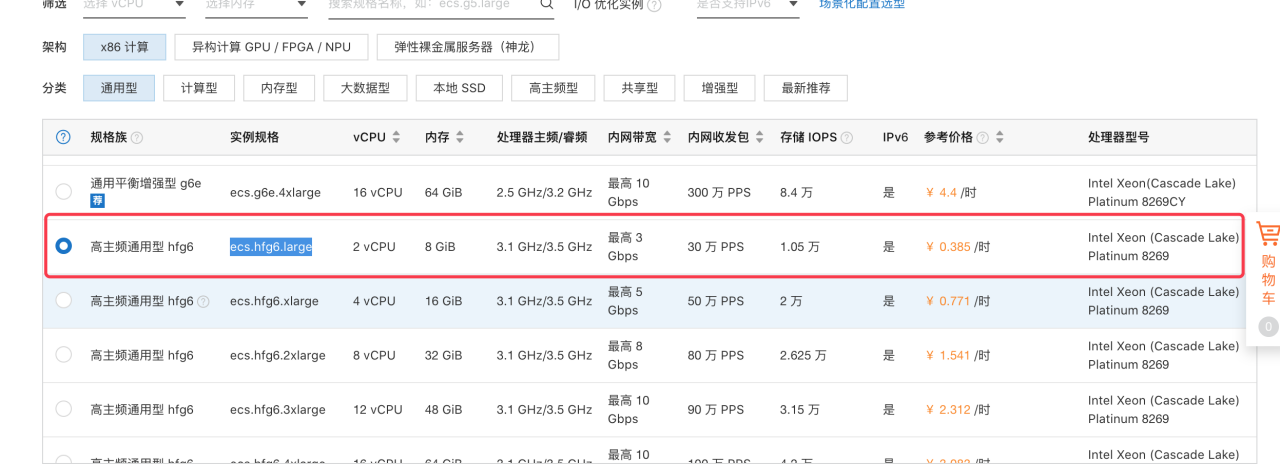
3.2.3 Hardware configuration 2 test (Aliyun ECS)
In order to confirm whether it's James or the hardware, I bought six ECSs virtual machines on Aliyun cloud, configured as 2C / 8g.
3.2.2.1 When there is no mail in inbox
100 occurrent users, only 1 letters in the INBOX account
Creating summariser <summary>
Created the tree successfully using stress.config.jmx
Starting standalone test @ Sun Oct 25 08:02:38 CST 2020 (1603584158446)
Waiting for possible Shutdown/StopTestNow/HeapDump/ThreadDump message on port 4445
summary +   1559 in 00:00:21 =   73.4/s Avg:   936 Min:   254 Max:  2449 Err:     0 (0.00%) Active: 100 Started: 100 Finished: 0
summary +   1441 in 00:00:31 =   47.1/s Avg:   857 Min:   254 Max: 16551 Err:     1 (0.07%) Active: 1 Started: 100 Finished: 99
summary =   3000 in 00:00:52 =   57.9/s Avg:   898 Min:   254 Max: 16551 Err:     1 (0.03%)
summary =   3000 in 00:00:52 =   57.9/s Avg:   898 Min:   254 Max: 16551 Err:     1 (0.03%)
Tidying up ...    @ Sun Oct 25 08:03:30 CST 2020 (1603584210617)
3.2.2.2 When there are 100 + messages in inbox
Aliyun ecs 100 coccurrent users, 100+ letters in the INBOX account
Creating summariser <summary>
Created the tree successfully using stress.config.jmx
Starting standalone test @ Sun Oct 25 08:07:09 CST 2020 (1603584429549)
Waiting for possible Shutdown/StopTestNow/HeapDump/ThreadDump message on port 4445
summary +    133 in 00:00:20 =    6.6/s Avg:  8173 Min:   854 Max: 10947 Err:     3 (2.26%) Active: 100 Started: 100 Finished: 0
summary +    316 in 00:00:30 =   10.5/s Avg:  9124 Min:  6557 Max: 12229 Err:     0 (0.00%) Active: 100 Started: 100 Finished: 0
summary =    449 in 00:00:50 =    8.9/s Avg:  8842 Min:   854 Max: 12229 Err:     3 (0.67%)
summary +    318 in 00:00:30 =   10.5/s Avg:  9141 Min:  6584 Max: 11725 Err:     0 (0.00%) Active: 100 Started: 100 Finished: 0
summary =    767 in 00:01:20 =    9.5/s Avg:  8966 Min:   854 Max: 12229 Err:     3 (0.39%)
summary +    312 in 00:00:30 =   10.3/s Avg:  9608 Min:  6782 Max: 12848 Err:     0 (0.00%) Active: 100 Started: 100 Finished: 0
summary =   1079 in 00:01:51 =    9.8/s Avg:  9152 Min:   854 Max: 12848 Err:     3 (0.28%)
summary +    312 in 00:00:30 =   10.5/s Avg:  9127 Min:  6832 Max: 11354 Err:     0 (0.00%) Active: 100 Started: 100 Finished: 0
summary =   1391 in 00:02:20 =    9.9/s Avg:  9146 Min:   854 Max: 12848 Err:     3 (0.22%)
summary +    325 in 00:00:30 =   10.8/s Avg:  9084 Min:   855 Max: 11426 Err:     1 (0.31%) Active: 100 Started: 100 Finished: 0
summary =   1716 in 00:02:50 =   10.1/s Avg:  9134 Min:   854 Max: 12848 Err:     4 (0.23%)
summary +    303 in 00:00:30 =   10.1/s Avg:  9510 Min:  6677 Max: 12177 Err:     0 (0.00%) Active: 100 Started: 100 Finished: 0
summary =   2019 in 00:03:20 =   10.1/s Avg:  9191 Min:   854 Max: 12848 Err:     4 (0.20%)
summary +    320 in 00:00:30 =   10.7/s Avg:  9434 Min:  6744 Max: 12099 Err:     0 (0.00%) Active: 100 Started: 100 Finished: 0
summary =   2339 in 00:03:50 =   10.2/s Avg:  9224 Min:   854 Max: 12848 Err:     4 (0.17%)
summary +    316 in 00:00:30 =   10.5/s Avg:  9265 Min:  6451 Max: 12176 Err:     0 (0.00%) Active: 100 Started: 100 Finished: 0
summary =   2655 in 00:04:20 =   10.2/s Avg:  9229 Min:   854 Max: 12848 Err:     4 (0.15%)
summary +    341 in 00:00:30 =   11.2/s Avg:  8269 Min:  3418 Max: 11460 Err:     0 (0.00%) Active: 3 Started: 100 Finished: 97
summary =   2996 in 00:04:51 =   10.3/s Avg:  9120 Min:   854 Max: 12848 Err:     4 (0.13%)
summary +      4 in 00:00:06 =    0.7/s Avg:  2782 Min:  2732 Max:  2846 Err:     0 (0.00%) Active: 0 Started: 100 Finished: 100
summary =   3000 in 00:04:57 =   10.1/s Avg:  9111 Min:   854 Max: 12848 Err:     4 (0.13%)
Tidying up ...    @ Sun Oct 25 08:12:06 CST 2020 (1603584726657)
3.2.2.3 Test result analysis of hardware configuration two
The TPS and error rate of hardware configuration 2 are greatly improved compared with hardware environment 1. This shows that the environment I built by myself may not be adjusted well. It may be that the error rate caused by network or disk IO is very high, and the TPS is also very low, and the average response time is even 20s +. Next, we will further configure hardware 1 to confirm the problem.
4 Summary
In the low configuration environment of Aliyun cloud, it has been many times better than the self built virtual same-sex performance. The error rate is reduced to 0.x%, and the TPS can reach 10 / s.
Although the average response time is about 10s, if the machine configuration can be further improved, I believe that the test results will be further improved. I believe that the higher configuration can reach 6000 + req / s, the average response time is within 100ms, and the error rate is lower.
Many Thanks to Tellier’s(https://github.com/chibenwa) help during the who testing process.

 浙公网安备 33010602011771号