import pandas as pd  #导入pandas
import matplotlib.pyplot as plt #导入matplotlib
from pylab import *
mpl.rcParams['font.sans-serif'] = ['SimHei']
mpl.rcParams['axes.unicode_minus'] = False
%matplotlib inline
数据读取与索引
bra = pd.read_csv('data/bra.csv')
bra.head()

选取列
bra.content

bra[['creationTime','productColor']].head()

选择行
bra[1:6]
选择行和列
bra.ix[[2,3],[1,3]] #使用ix

bra.ix[1:5,['productColor']]

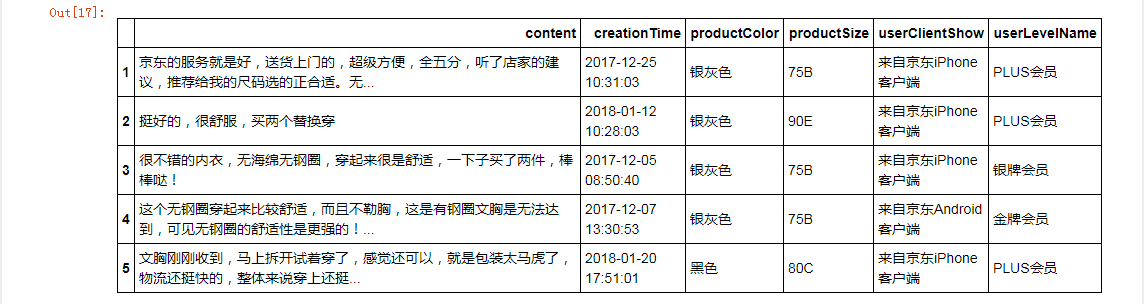
bra.iloc[[2,3],[1,3]] #使用iloc

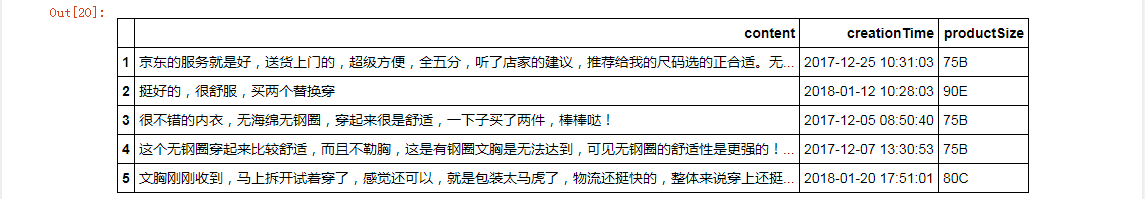
bra.loc[1:5,['content','creationTime','productSize']] #使用loc
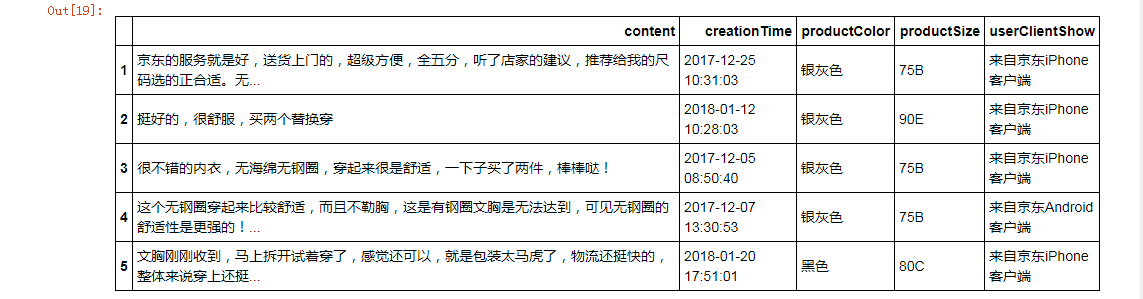
bra.loc[1:5,'content':'userClientShow']
数据预处理
缺失值
bra.describe() #查看数据的分布情况,可返回变量和观测的数量、缺失值和唯一值的数目、平均值、分位数等相关信息

bra['userClientShow'].unique() #userClientShow列有几种选项

bra['userClientShow'].isnull().sum() #初始缺失值数量

bra['userClientShow'].fillna('不详',inplace=True) #缺失值替换为“不详”

bra['userClientShow'].isnull().sum() #赋值后的缺失值数量

新增列
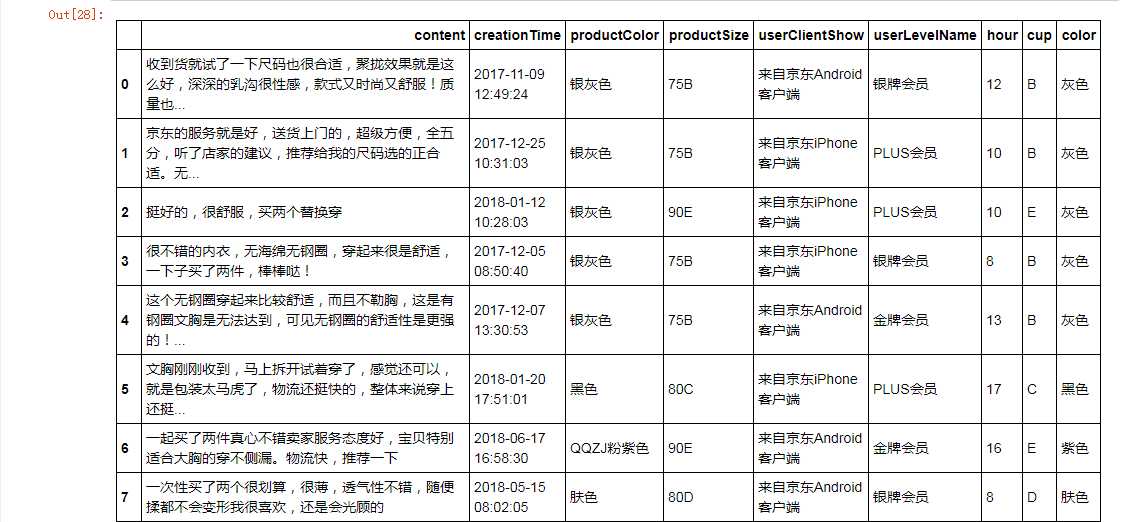
bra.dtypes #查看属性

bra['creationTime'] = pd.to_datetime(bra['creationTime']) #更新类型
bra.dtypes

bra['hour'] = [i.hour for i in bra['creationTime']] #新建hour列
bra

字符串操作
bra.productSize.unique() #查看productSize的唯一值

cup = bra.productSize.str.findall('[a-zA-Z]+').str[0] #新增列cup
cup2 = cup.str.replace('M','B')
cup3 = cup2.str.replace('L','C')
cup4 = cup3.str.replace('XC','D')
bra['cup'] = cup4
bra.head()

bra['cup'].unique() #查看cup唯一值

数据转换
bra.productColor.unique() #查看productColor唯一值

def getColor(s):
if '黑' in s:
return '黑色'
elif '肤' in s:
return '肤色'
elif '蓝' in s:
return '蓝色'
elif '红' in s:
return '红色'
elif '紫' in s:
return '紫色'
elif '白' in s:
return '白色'
elif '粉' in s:
return '粉色'
elif '灰' in s:
return '灰色'
elif '绿' in s:
return '绿色'
elif '青' in s:
return '青色'
else:
return s
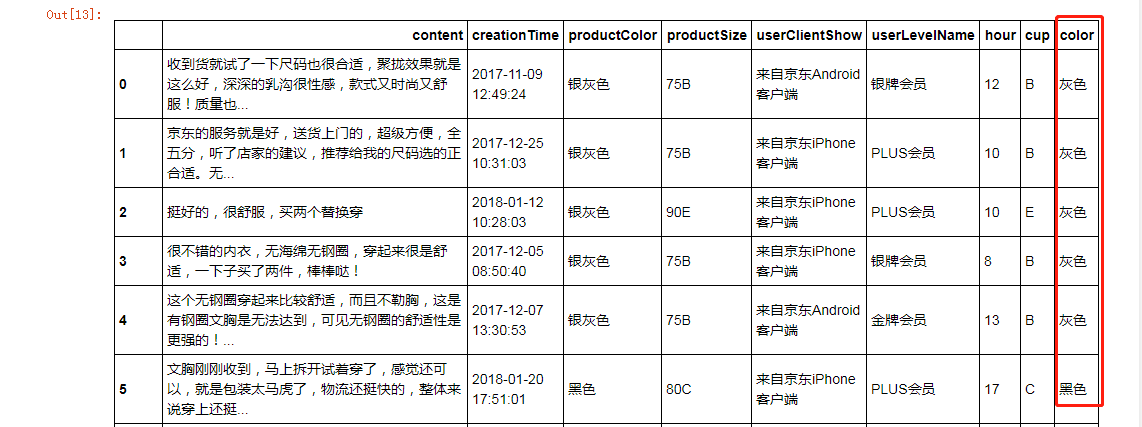
bra['color'] = bra['productColor'].map(getColor) #从productColor列查询,赋值到定义的函数getColor,最终新增列color
bra
bra.color.unique() #查询color的唯一值

数据可视化
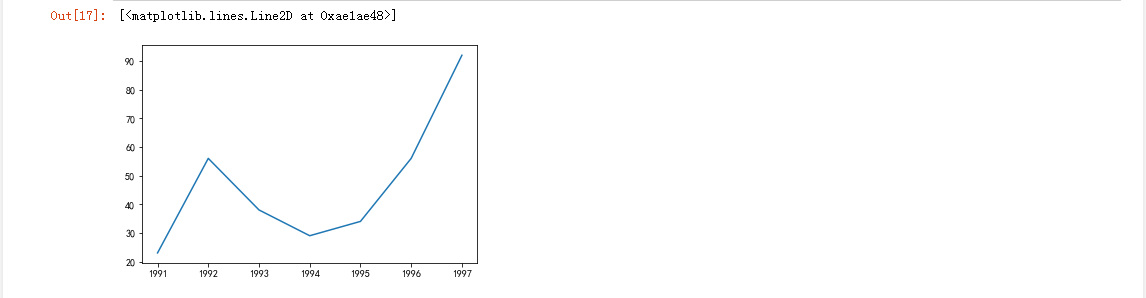
x = [1991,1992,1993,1994,1995,1996,1997]
y = [23,56,38,29,34,56,92]
plt.plot(x,y) #调用函数plot
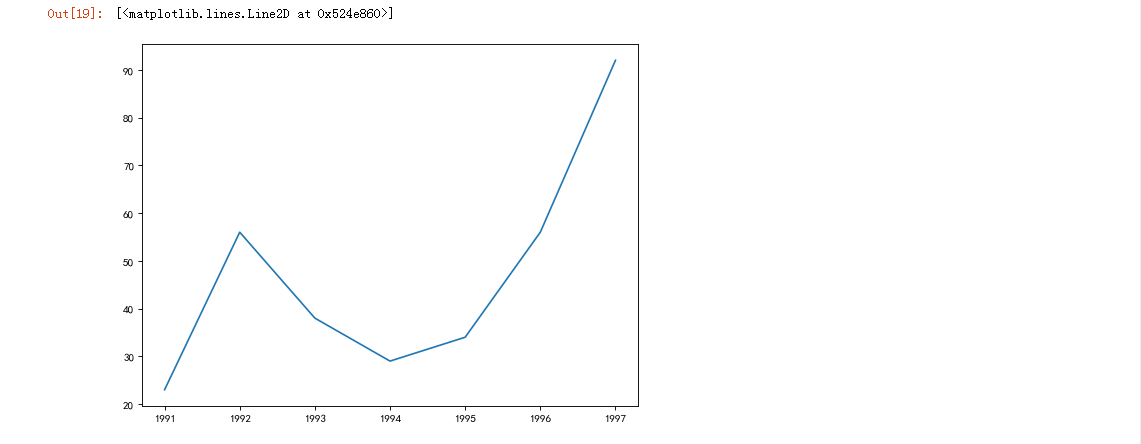
plt.figure(figsize=(8,6),dpi=80) #调用函数firgure
plt.plot(x,y)
hour = bra.groupby('hour')['hour'].count()  #hour列排序
hour

plt.xlim(0,25) #横轴0~25
plt.plot(hour,linestyle='solid',color='royalblue',marker='8') #颜色深蓝

cup_style = bra.groupby('cup')['cup'].count() #cup列唯一值得数量
cup_style

plt.figure(figsize=(8,6),dpi=80)
labels = list(cup_style.index)
plt.xlabel('cup') #x轴为cup
plt.ylabel('count') #y轴为count数量
plt.bar(range(len(labels)),cup_style,color='royalblue',alpha=0.7) #alpha为透明度
plt.xticks(range(len(labels)),labels,fontsize=12)
plt.grid(color='#95a5a6',linestyle='--',linewidth=1,axis='y',alpha=0.6)
plt.legend(['user-count'])
for x,y in zip(range(len(labels)),cup_style):
plt.text(x,y,y,ha='center',va='bottom')

color_style = bra.groupby('color')['color'].count() #color列唯一值得数量
color_style

plt.figure(figsize=(8,6),dpi=80)
plt.subplot(facecolor='gainsboro',alpha=0.2)
colors = ['brown','orange','gray','white','pink','purple','red','green','wheat','blue','gold','springgreen','black'] #颜色种类
labels = list(color_style.index)
plt.xlabel('count') #x轴为count数量
plt.ylabel('color') #y轴为color
plt.title('Color Distribution') #定义标题
plt.barh(range(len(labels)),color_style,color=colors,alpha=1)
plt.yticks(range(len(labels)),labels,fontsize=12)
plt.grid(color='#95a5a6',linestyle='--',linewidth=1,axis='x',alpha=0.4)

bra.head(30)


 浙公网安备 33010602011771号